Abstract
Many proteins and proteolytic peptides incorporate the same post-translational modification (PTM) at different sites, creating multiple localization variants with different functions or activities that may coexist in cells. Current analytical methods based on liquid chromatography (LC) followed by tandem mass spectrometry (MS/MS) are challenged by such isomers that often co-elute in LC and/or produce non-unique fragment ions. The application of ion mobility spectrometry (IMS) was explored, but success has been limited by insufficient resolution. We show that high-resolution differential ion mobility spectrometry (FAIMS) employing helium-rich gases can readily separate phosphopeptides with variant modification sites. Use of He/N2 mixtures containing up to 74% He has allowed separating to >95% three monophosphorylated peptides of identical sequence. Similar separation was achieved at 50% He, using an elevated electric field. Bisphosphorylated isomers that differ in only one modification site were separated to the same extent. We anticipate FAIMS capabilities for such separations to extend to other PTMs.
Introduction
Over the last decade, the rapid development of separation techniques, mass spectrometry (MS), and informatic tools has dramatically improved the sensitivity, dynamic range, and speed of peptide analyses, greatly expanding the proteome coverage.1,2 Thus the emphasis of proteomic research is shifting to characterization of post-translational modifications (PTMs) of proteins that control the critical aspects of their function without genome encoding.3 Several hundred PTM types are known, many associated with specific amino acid residue(s). Among the most common and extensively explored is phosphorylation4 - the addition of a phosphate. In eukaryotes, this group modifies hydroxyamino acids - serine (S), threonine (T), and tyrosine (Y).3 In bacteria, phosphorylation can also occur at basic residues (arginine, histidine, and lysine) or acidic residues (aspartic and glutamic acids).5,6 Reversible phosphorylation, with phosphorylation effected by kinases and dephosphorylation by phosphatases, underlies many signaling pathways and is a crucial regulatory mechanism with roles such as osmoregulation, enzyme inhibition, and mutual recognition or degradation of proteins.7-12
The S, Y, and T together make up ~16% of amino acid residues in the proteins (from the NCBI database), creating multiple potential phosphorylation sites for most proteins.13 At least ~1/3 of cellular proteins are phosphorylated, often more than once.3 For example, the p53 tumor suppressor protein (that regulates cell cycle arrest or apoptotic cell death) has over 18 actual phosphorylated sites, and the insulin receptor substrate (IRS-1) protein (that mediates insulin signaling) has over 40.11,12,14 With both prokaryotes and eukaryotes, many peptides, including those formed by proteolysis, contain several residues that bind the phosphate or other PTM. To illustrate, doubly or triply phosphorylated peptides comprised >70% of the 216 phosphopeptides sequenced in the tryptic digest of Saccharomyces cerevisiae3 and >40% of 606 phosphopeptides in the Lys-C digest of human embryonic kidney 293T cells.15 Greater multiplicity is not exceptional, e.g., tryptic peptides SRTESITATSPASMVGGKPGSFR from IRS-1 and LLGSSFSSGPVADGIIR from Sprouty2 human proteins14,16 have four serines. Thus a PTM may attach at different sites, creating isomers. These species are routinely encountered in protein digests,6,14 e.g., for Saccharomyces, RPTSPSISGSGSGGNSPSSSAGARQRSASLHRRK from the YJR059W protein singly phosphorylated at either T or S and QTHAPTTPNRTSPNRSSISRNATLK from the YHL007C protein doubly phosphorylated at T and either S. Observations include the phosphorylation of above LLGSSFSSGPVADGIIR at any16 S and of LPSPPGPQELLDSPPALYAEPLDSLR from mouse fibroblast cells17 at Y or either S. Thus differential modification may involve some PTMs with other(s) conserved or a single PTM, and different instances of same residue or different residues. Such isomeric proteins or peptides may have distinct properties and function, and site-directed mutagenesis to decipher the biological purpose of modification requires knowing the attachment site.18
However, differentiating peptides with variant PTM localization challenges the prevailing tools of bottom-up proteomics based on liquid chromatography (LC)/MS.10,13,14 The bonds between phosphate or other PTM and a peptide are typically weaker than the peptide backbone and are preferentially cleaved in thermal dissociation, suppressing the channels leading to the structurally informative modified peptide fragments.6 Thus regular MS/MS via collision-induced dissociation (CID)19 frequently fails to define the PTM site:13 with Saccharomyces, for >60% of observed phosphopeptides.3,6 Gas-phase rearrangements and competing fragmentation reactions further obstruct localization of PTMs by CID.20,21 Electron capture or transfer dissociation (EC/TD), a radically-driven process that cleaves the backbone N-Cα bonds while retaining PTMs,6,15-17,19,22-26 localizes phosphorylations better than CID.15,26 However, sensitivity is limited as the fragmentation yield for peptides and particularly phosphopeptides is low (~10% vs. >70% for CID) and spread among numerous (normally >10) products. The EC/TD methods have most success for peptides with charge states (z) of 3 or higher, rather than 2+ ions that dominate in the electrospray ionization (ESI) for tryptic digests.22,23 Subjecting ions to CID after ETD addresses this problem for unmodified peptides, but less so for phosphopeptides because of the labile PTM.25 Parallel use of CID and EC/TD provides the most complete characterization of phosphorylation sites.23,26
EC/TD methods generally fail for mixtures of localization variants with just two - four components16,24,26 in view of non-unique fragments for a peptide with more than two potential phosphorylated sites. That is, a mixture of XpSXSXSX (A), XSXpSXSX (B), and XSXSXpSX (C) (where X is any residue) would produce fragments unique for A and C, but not B. (For example, the c2 fragment of A is unique, but those of B and C are identical. Similarly, the z2 fragment of C is unique, but those of A and B are identical.) Such mixtures are common in biology, as discussed above with respect to various proteins and organisms. Some but not all of these species can be resolved employing MS3 methods,13,14 although competing dissociation pathways such as dehydration complicate the data interpretation.20,25 Localization variants often co-elute in LC, which prevents their fractionation prior to MS or requires long gradients incompatible with reasonable throughput.14,16,27
An attractive alternative to condensed-phase separations is ion mobility spectrometry (IMS), based on the transport properties of gas-phase ions in electric fields. As molecules move ~104 times faster in gases than in liquids, IMS permits sub-second analyses.28 While LC depends on the analyte affinity to a stationary phase, the key factor for IMS is the ion shape. Thus IMS is quite orthogonal to LC29 and should be useful to characterize phosphorylations, which tend to switch enzymes and receptors on/off via a structural change.7 In particular, an added PO4 converts a hydrophobic portion of a protein into a hydrophilic one,30 which may precipitate a conformational transition via interaction with other residues or solvent.
In conventional IMS, ions are dispersed by the mobility (K) in a field of moderate strength (E) that can be constant as in drift-tube (DT) IMS28 or time-varying as in traveling-wave (TW) IMS.31 The mobility is proportional to z divided by the orientationally averaged ion-molecule collision cross section, Ω. For ions of conserved shape, this quantity reflects the size that, within a compound class, is strongly correlated with mass. Hence, for a given z, chemically similar species such as peptides (and especially tryptic peptides) form trend lines in the IMS/MS space. The mean line for phosphopeptides is shifted toward higher K compared to that for unmodified analogs, which constrains the phosphopeptide candidate pool.32-34 However, the displacement for all modified sites (S, Y, or T) is same.34 These observations make sense, as Ω for compact tight-packed objects is mainly determined by the number of constituent atoms and their type that defines the physical size. That applies to peptides to some extent, and their mobility may be estimated from the stoichiometry using the “intrinsic size parameters” (ISPs) of constituent residues.35,36 The residues with side chains comprising heavy atoms (O, N, and particularly S) are denser than those with hydrocarbon chains, and thus have lower ISPs.36 Such “dense” residues contribute less to the ion size and cross section than others of similar mass, rendering a peptide more mobile than the average for its mass. In this context, one may treat PTMs as extra residues, and the phosphorus and three oxygens make the phosphate a very dense one. Therefore phosphopeptides should lie on the high-K side of unmodified peptides in the IMS/MS space, with the shift independent of the attachment site but roughly scaling with the number of phosphorylations. Indeed, peptides with the greatest number of phosphorylations (4 or 5) exhibit maximum deviations from the mean peptide trend line.34
The ISP model is approximate, as IMS can resolve peptides with sequence inversions.37 To find whether PTM localization variants can be separated, some of us have studied37 a 15-residue tryptic-like peptide APLS1FRGS2LPKS3YVK (1649 Da) that allows 3 monophosphorylated isomers (1729 Da) with pS1 (1), pS2 (2), or pS3 (3). In ESI, these species primarily generate the protonated 2+ and 3+ ions. For both, the mobility spectra of 1 and 3 measured using TWIMS (in the Waters Synapt G2 instrument with the resolving power R of ~40) differ,38 but not enough to separate either isomer for z = 2. In the 3+ state, 3 may possibly be separated from 1 using a minor conformer, but not vice versa.
Another approach to IMS is the differential or field asymmetric waveform IMS (FAIMS), based on the difference of mobility at high and low E that reveals the mean K(E) derivative over some E range.39,40 Here, ions are filtered in a gap between two electrodes carrying an asymmetric waveform, and the separation parameter is the “compensation voltage” (CV) superposed on that waveform to equilibrate a given species and let it pass the gap rather than be neutralized on an electrode. Scanning CV reveals the spectrum of species present. To remove the dependence on gap width,40 CV is converted to the “compensation field” (EC). As the derivative and magnitude of a function are a priori independent, FAIMS is largely orthogonal to conventional IMS40,41 and may resolve species where the latter fails. Further, FAIMS is more orthogonal to MS than conventional IMS, in particular for peptides.41-43 Hence FAIMS/MS is more likely to distinguish isomers, including PTM localization variants, than conventional IMS/MS with equal R. The capability of commercial FAIMS instruments (Thermo Fisher) to separate such variants was tested44 for 1 - 3. The spectra for all three mostly overlapped, but the regions of non-overlap allowed filtering 2 from 1 or 3 (but not vice versa) and 1 from 3 (but not vice versa). Much better separation is needed to make FAIMS broadly useful for localizing PTMs.
The above FAIMS unit has a cylindrical gap with inhomogeneous field,39,45 which limits R to ~10 (for peptides).45,46 Recently, use of planar units with homogeneous field, helium/nitrogen gas mixtures with high He content, and/or elevated field has raised R by an order of magnitude, to ~100 - 200 for multiply-charged peptides.47,48 Here we deploy this new platform to fully separate the localization variants of singly and multiply phosphorylated peptides.
Experimental methods
Analyses employed the FAIMS system with a 1.88 mm-wide gap, coupled to a modified ion trap mass spectrometer (Thermo Fisher LTQ).47,48 In mode I, the peak wave amplitude (dispersion voltage, DV) was 4 kV with He fraction up to 74% - the constraint imposed by electrical breakdown threshold for that voltage.48 In mode II, DV was increased to 5.4 kV, limiting the He fraction to 50%. For unmodified peptides, the resolution was slightly (~20%) higher in mode II than in I.48 Besides 1, 2, and 3, we analyzed their bisphosphorylated analogs with pS1 and pS2 (4) or pS1 and pS3 (5) at 1809 Da, which also produced 2+ and 3+ ions. The standards, synthesized by Alta Bioscience (Birmingham, UK) and authenticated by ETD using LTQ Orbitrap XL (Thermo Fisher), were dissolved to ~5 μM in 50:49:1 methanol/water/acetic acid and infused to an ESI emitter at the flow of ~0.3 - 0.5 μL/min. The FAIMS spectra for proteins depend on the solvent, proving at least some retention of solution structure in the ESI process.49,50 To gauge the importance of solvent here, we reanalyzed some samples in the 50:49.8:0.2 acetonitrile/water/formic acid solvent. While these tests were not comprehensive, no change of FAIMS spectra was noted. This is in agreement with previous experience for smaller peptides, implying that free ions have no memory of the solution structure and/or that said structure is insensitive to the solvent over broad composition ranges.
When juxtaposing the FAIMS spectra acquired at different times, an issue is the EC drift due to variations of DV, waveform profile, and ambient pressure or temperature. To assure the stability of experiment and anchor the EC scale, an internal calibrant Syntide 2 (St, 1508 Da) was added to each sample in ~1:1 ratio. This peptide was chosen since it is close in mass to present phosphopeptides and produces intense, well-defined peaks for z = 2 and 3 at similar CVs.47,48 In the following results, the EC axes for 2+ and 3+ ions were scaled separately to match the spectra for St ions of same charge. Between the measurements, DV was occasionally adjusted to keep the EC variation for either St2+ or St3+ within ~2%. The accuracy of this procedure and thus comparability of all spectra was confirmed by the data for isomeric mixtures, as discussed below.
Results and Discussion
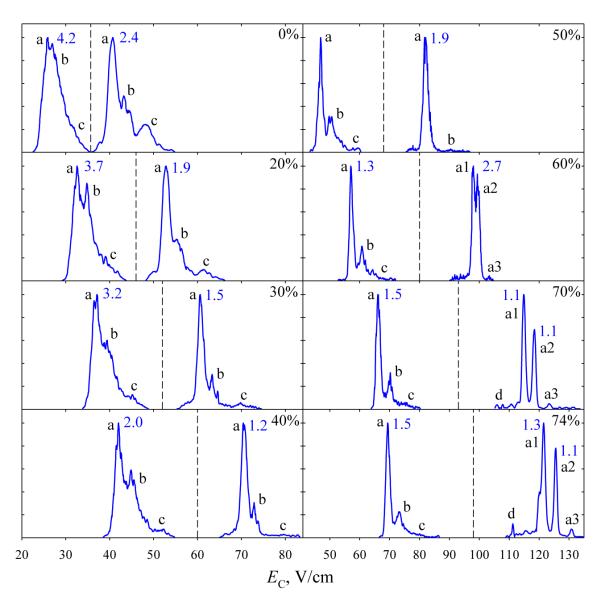
We started by mapping the FAIMS spectra for 3 as a function of He content in mode I. As for unmodified peptides,47,48 moving from 0 to 74% He in He/N2 mixtures shifts the spectra for z = 2 or 3 to higher EC and narrows the features (Fig. 1). Increasing or constant width of some peaks despite He addition is due to progressive separation of isomers merged at lower resolution. For example, the base 3+ peak broadens from 1.2 to 1.9 V/cm between 40% and 50% He, then splits into two at >60% He. At the highest He content, the major 2+ and 3+ peak(s) are close in width to the corresponding Syntide 2 ions,46,47 suggesting one dominant conformer. (The peaks in planar FAIMS analyzers broaden for less mobile ions40,51 and thus could be slightly wider for the present peptides than for Syntide 2 because of their larger mass and thus likely lower mobility). Ions in FAIMS inevitably experience field heating, which may induce conformational transitions for flexible species with low isomerization barriers.52 For peptides, this usually means unfolding, manifested as the conversion of some features to others at lower EC values.47,48 These behaviors include that high-EC conformers (b) and (c) of 3+ diminish and eventually vanish on the way from 0 to 50% He, conformer (a2) decreases relative to (a1) between 60% and ~70% He, and a low-EC conformer (d) emerges at ~70% He (Fig. 1). The abundances of conformers (b) and (c) for 2+ similarly drop between 0% and ~50% He.
Fig. 1.
Spectra of 3 with z = 2 (left of the dashed line) and 3 (right of the line) at DV = 4 kV at 0 - 74% He, as labeled. The widths at half maximum (V/cm) are given for the major well-shaped peaks. The conformer labels in this and further figures are specific to a particular peptide and charge state.
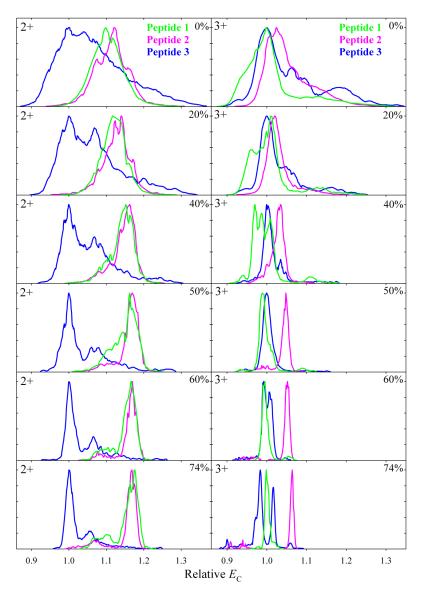
The evolution of spectra for 1 and 2 with increasing He content broadly tracks that of 3 (Fig. 2). The rise of features at lower EC at the expense of those at higher EC, most conspicuous for 3+ ions of 2, indicates that the field heating unfolds those isomers, too. However, the detailed spectra for all three variants drastically differ. For 2+, the major peaks for 1 and 2 have much higher EC at any He fraction, suggesting more folded conformers. This is consistent with the TWIMS data38 for 1 and 3. The spectra for 1 and 2 are close, presumably reflecting similar geometries. The 3+ ions of 2 always come at higher EC than the major conformers of 1 or 3, which are close and invert order depending on the He content (Fig. 2). In N2, the spectrum for 1 is shifted to lower EC compared to 3, suggesting less folded geometries - again, in line with TWIMS data. For 3, the relative intensities of present conformers (a), (b), and (c) of 2+ ion and the better-resolved (a) and (c) of 3+ ion seem to match, respectively, those of the three and two features in TWIMS data. However, the correlation is not apparent for 1. Robust cross-assignment of features in conventional IMS and FAIMS spectra, as well as certain structural elucidation of conformers resolved by FAIMS, calls for 2-D FAIMS/DTIMS analyses.41,53
Fig. 2.
Spectra of 1 and 2 relative to those for 3 for 2+ and 3+ ions at DV = 4 kV and 0 - 74% He, as marked. The EC axis was scaled to align the major peak for 3 to unity.
As expected from the trend of resolving power, all three peptides are best resolved at the maximum He fraction. Each can be filtered from the other two with ~95% purity by setting EC at the apexes of major peaks for z = 3 (Fig. 2). One can also (and perhaps more cleanly) filter 3 from 1 and/or 2 by selecting the major peak apex for z = 2. These capabilities were verified by analyses of all three binary mixtures at 70 - 74% He: every significant feature in their spectra was assigned using the data for individual components (Fig. S1).
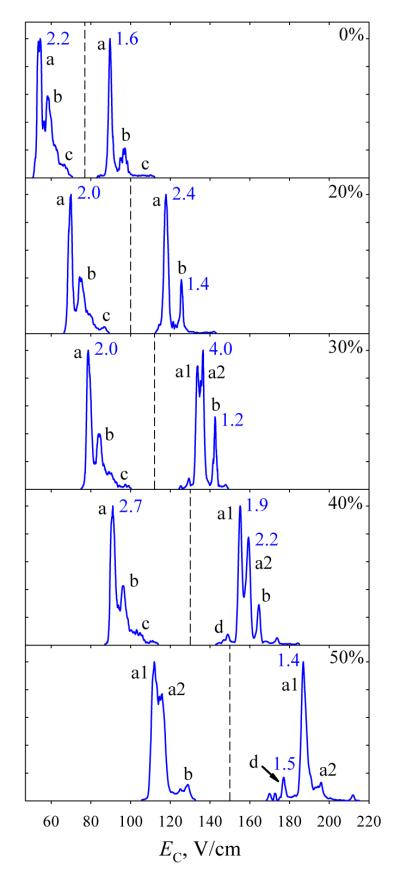
For unmodified peptides, raising DV from 4 kV to 5.4 kV at the maximum He content increases both EC and peak widths, producing same or only slightly higher resolution.48 Ions are heated stronger at higher DV, leading to greater peptide unfolding. However, as greater He content also increases the heating,47,48 it can offset a lower DV to produce the same ion temperature and thus similar conformations. For peptides, the spectral profiles at DV = 5.4 kV are closest to those at 4 kV with the He fraction shifted by ~30 - 35% up.48 These trends hold here: the spectra for both 2+ and 3+ states of 3 at DV = 5.4 kV in N2 (Fig. 3) are close to those at 4 kV and 30% He (Fig. 1). The changes upon He addition up to 40% mirror those for DV = 4 kV up to 74% He, except for longer persistence of (b). The data at 50% He (Fig. 3) show further unfolding, including the splitting of (a) and major decrease of (b) for z = 2, and growth of (d) and loss of (a2) for z = 3. Imminent splitting of (a) was anticipated from the spectra in Fig. 1, where the peak broadened on the way from 60% to 74% He.
Fig. 3.
Same as Fig. 1 at DV = 5.4 kV and 0 - 50% He, as marked.
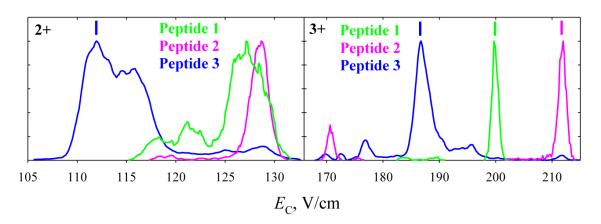
The spectra for 2 at DV = 5.4 kV (Fig. S2) similarly evolve along the trend at DV = 4 kV, with present profiles at 0% and 40% He matching those in Fig. 2 at ~20 - 40% and 74% He, respectively. The spectra at 5.4 kV and 50% He exhibit further unfolding, with a growing conformer for z = 3 at lowest EC values. The separation of 2 and 3 expectedly improves at higher He fractions, and the resolution of all three localization variants was evaluated at 50% He (Fig. 4). The profiles for 1 in both 2+ and 3+ states are close to those at DV = 4 kV and 74% He, with further unfolding again indicated by the emergence or growth of two features at lower EC. At its peak apex, one can purify each peptide to ~95% for z = 3 and filter 3 from 1 and/or 2 essentially perfectly using z = 2. This conclusion has been verified by analyses of 1 + 2 and 1 + 3 mixtures (Fig. S3). The results at DV = 5.4 kV are overall similar to those at 4 kV, but thorough inspection of spectra hints at small gains in separation quality.
Fig. 4.
Spectra for 1, 2, and 3 with z = 2 and 3 measured using DV = 5.4 kV and 50% He. Vertical bars mark the EC values for best filtering of each peptide.
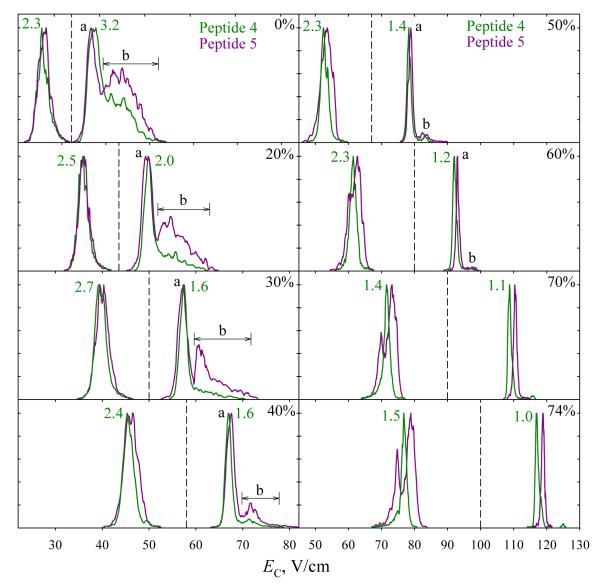
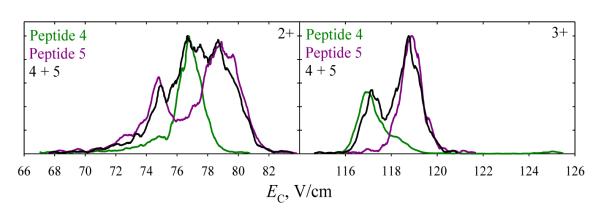
Bisphosphorylated peptides 4 and 5 have proven harder to separate than monophosphorylated ones. In N2 at DV = 4 kV, the spectra over both charge states are more similar for 4 and 5 (Fig. 5) than for any pair of 1, 2, or 3 (Fig. 2): the spectra for 4 and 5 cover identical EC ranges for either z = 2 or 3, whereas those for 1 - 3 have non-overlapping segments that enable filtering 3 from 1 or 2 (for z = 2) and 1 from 2 (for z = 3). The spectra for 3+ ions of 4 and 5 exhibit a block of unresolved features (b) on the high-EC side of major peak (a), presumably due to more compact conformers. Consistent with unfolding driven by the field heating, these features shift toward (a) and drop in intensity with increasing He fraction, virtually vanishing by 60% He (Fig. 5). The needed heating is stronger for 5 than for 4 (suggesting greater stability of folded structures for 5) and six-fold enrichment of the 4 + 5 mixture in 5 is possible at 30% He. Even stronger heating upon further He addition reduces the distinction between the two spectra as the (b) features are destroyed in both. However, the major peaks for 4 and 5 with z = 3 that coincide at ≤50% He begin to diverge at 60% He and can be resolved near half-maximum at 74% He, allowing each variant to be purified to >90% at its peak apex and ~98% at half the peak height. For 2+ ions, the feature for 5 (but not 4) splits into two at ≥60% He (Fig. 5). The spectra of 4 and 5 diverge more upon further He addition, and at 74% He one can filter 5 with >98% purity near its major peak apex. These separations for both charge states were validated by analyses of a 4 + 5 mixture (Fig. 6). Here, multiply modified peptides differing in the site of one PTM were more difficult to separate than singly modified variants, but one data point is obviously insufficient to clarify how general this is.
Fig. 5.
Same as Fig. 1 for 4 and 5. The peak widths are given for 4.
Fig. 6.
Spectra for the mixture of 4 and 5 with z = 2 and 3 at DV = 4 kV and 74% He, the scaled spectra for 4 and 5 are overlaid.
Conclusions
High-resolution differential ion mobility spectrometry (FAIMS) using He-rich gases or elevated electric field was applied to separate phosphopeptides having variant modification sites. We studied APLSFRGSLPKSYVK modifications with 3 serines that allowed 3 monophosphorylated isomers, for which ESI produced 2+ and 3+ ions. For either charge state, the resolution of localization variants expectedly improved with increasing He content in He/N2 mixtures. At a dispersion voltage (DV) of 4 kV and maximum He fraction of 74%, all 3 variants were separated to ≥95% purity for 2+ and/or 3+ ions. The resolution slightly improved at DV = 5.4 kV and 50% He - the maximum for this DV. Bisphosphorylated isomers (APLpSFRGpSLPKSYVK and APLpSFRGSLPKpSYVK) that differ in one attachment site were more difficult to distinguish, yet >95% separation was achieved at DV = 4 kV and 74% He. The isomer resolution was often, but not always, better for 3+ than 2+ ions. If this pattern is general, the localization of phosphates using FAIMS may share the bias of EC/TD against 2+ ions. However, these situations are not exactly parallel as FAIMS might perform better for 3+ ions in the majority but not all cases, whereas EC/TD is always more effective for z > 2 for well-known reasons. Present separations are greatly superior to the results for same species using the commercial FAIMS or traveling-wave IMS platforms. A comparison with (non-commercial) DTIMS systems54 that have higher resolving power than Synapt G2 remains to be made.
Ion transmission efficiency through the present FAIMS device is low (~0.1 - 1%), but losses at the FAIMS/MS interface can be ameliorated using slit-aperture inlets that match the geometry of ion beams exiting a planar FAIMS gap.45,55 The current EC/TD methods for localization of phosphorylations involve signal reductions by a similar 102 - 103 times compared to the parent ion, but cannot address mixtures of more than two variants because of non-unique fragmentation. Hence FAIMS even at the present level may be competitive for fast analyses of coexistent phosphopeptide localization isomers that, for example, have distinct biological roles. High-resolution FAIMS should be of utility for localizing PTMs beyond phosphorylation, an even greater challenge for PTMs that are more labile and/or permit internal structural variations (such as glycosylation).
While DTIMS or TWIMS are dispersive methods that are optimum for global analyses, FAIMS is a filtering technique that works best for targeted applications. This distinction is analogous to the different preferred applications of time-of-flight and quadrupole MS instruments. Hence FAIMS may be most suitable for the detection and quantification of specific PTM localization variants. With sufficient sensitivity, one may perform CID or EC/TD after FAIMS to assign the resolved isomers, thus vacating the issue of non-unique fragmentation for mixtures. For much higher sensitivity in targeted analyses, one may avoid MS/MS by using standards to find EC values for the variants of interest and then searching for them with FAIMS operated at fixed EC. Online FAIMS/(conventional IMS) separations53 may characterize the conformations of resolved variants and perhaps improve the overall resolution. One may also implement ETD between the FAIMS and conventional IMS stages to first resolve parent isomers and then separate the variants of PTM-retaining fragments for additional specificity. Both capabilities would be delivered by coupling FAIMS to Synapt G2 with the ETD option,38,56 which may make a powerful platform for PTM localization in complex scenarios.
Supplementary Material
Fig. S1. Spectra for binary mixtures of 1, 2, or 3 with z = 2 (left column) and 3 (right column) measured using DV = 4 kV and 70 or 74% He, as marked. The spectra for components, scaled to match the heights of corresponding features in the mixtures, are overlaid.
Fig. S2. FAIMS spectra for peptide 2 relative to those for 3 with z = 2 (left column) and 3 (right column). Measurements used DV = 5.4 kV and 0 - 50% He, as marked. The EC axis was scaled to align the major peak for 3 to unity.
Fig. S3. FAIMS spectra for mixtures of 1 + 2 and 1 + 3 with z = 2 (left column) and 3 (right column) measured using DV = 5.4 kV and 50% He. The spectra for components, scaled to match the heights of corresponding features in the mixtures, are overlaid.
Acknowledgements
We thank Heather Brewer, Therese Clauss, and Ron Moore for experimental help, and Dr. Errol Robinson, Dr. Feng Yang, Dr. Vlad Petyuk, and Professor Steven Gygi for discussions of peptide phosphorylation and its MS characterization. Portions of this research were supported by the US Department of Energy Office of Biological and Environmental Research (DoE/BER), NIH National Center for Research Resources (RR18522), and the Wellcome Trust (074131). Work was performed in the Environmental Molecular Sciences Laboratory, a national scientific user facility at PNNL sponsored by DoE-BER.
References
- 1.Aebersold R, Mann M. Nature. 2003;422:198–207. doi: 10.1038/nature01511. [DOI] [PubMed] [Google Scholar]
- 2.Domon B, Aebersold R. Science. 2006;312:212–217. doi: 10.1126/science.1124619. [DOI] [PubMed] [Google Scholar]
- 3.Ficarro SB, McCleland ML, Stukenberg PT, Burke DJ, Ross MM, Shabanowitz J, Hunt DF, White FM. Nat. Biotechnol. 2002;20:301–305. doi: 10.1038/nbt0302-301. [DOI] [PubMed] [Google Scholar]
- 4.Collins MA, Yu L, Choudhary JS. Proteomics. 2007;7:2751–2768. doi: 10.1002/pmic.200700145. [DOI] [PubMed] [Google Scholar]
- 5.Cozzone AJ. Ann. Rev. Microbiol. 1988;42:97–125. doi: 10.1146/annurev.mi.42.100188.000525. [DOI] [PubMed] [Google Scholar]
- 6.Chi A, Huttenhower C, Geer LY, Coon JJ, Syka JEP, Bai DL, Shabanowitz J, Burke DJ, Troyanskaya OG, Hunt DF. Proc. Natl. Acad. Sci. USA. 2007;104:2193–2198. doi: 10.1073/pnas.0607084104. [DOI] [PMC free article] [PubMed] [Google Scholar]
- 7.van Weeren PC, de Bruyn KM, de Vries-Smits AM, van Lint J, Burgering BM. J. Biol. Chem. 1998;273:13150–13156. doi: 10.1074/jbc.273.21.13150. [DOI] [PubMed] [Google Scholar]
- 8.Cole PA, Shen K, Qiao Y, Wang D. Curr. Opin. Chem. Biol. 2003;7:580–585. doi: 10.1016/j.cbpa.2003.08.009. [DOI] [PubMed] [Google Scholar]
- 9.Babior BM. Blood. 1999;93:1464–1476. [PubMed] [Google Scholar]
- 10.Olsen JV, Blagoev B, Gnad F, Macek B, Kumar C, Mortensen P, Mann M. Cell. 2006;127:635–648. doi: 10.1016/j.cell.2006.09.026. [DOI] [PubMed] [Google Scholar]
- 11.Bates S, Vousden KH. Curr. Opin. Genet. Dev. 1996;6:12. doi: 10.1016/s0959-437x(96)90004-0. [DOI] [PubMed] [Google Scholar]
- 12.Ashcroft M, Kubbutat MH, Vousden KH. Mol. Cell. Biol. 1999;19:1751–1758. doi: 10.1128/mcb.19.3.1751. [DOI] [PMC free article] [PubMed] [Google Scholar]
- 13.Boersema PJ, Mohammed S, Heck AJR. J. Mass Spectrom. 2009;44:861–878. doi: 10.1002/jms.1599. [DOI] [PubMed] [Google Scholar]
- 14.Langlais P, Mandarino LJ, Yi Z. J. Am. Soc. Mass Spectrom. doi: 10.1016/j.jasms.2010.05.009. doi: 10.1016/j.jasms.2010.05.009. [DOI] [PMC free article] [PubMed] [Google Scholar]
- 15.Molina H, Horn DM, Tang N, Mathivanan S, Pandey A. Proc. Natl. Acad. Sci. U.S.A. 2007;104:2199–2204. doi: 10.1073/pnas.0611217104. [DOI] [PMC free article] [PubMed] [Google Scholar]
- 16.Sweet SMM, Mardakheh FK, Ryan KJP, Langton AJ, Heath JK, Cooper HJ. Anal. Chem. 2008;80:6650–6657. doi: 10.1021/ac800963a. [DOI] [PubMed] [Google Scholar]
- 17.Cunningham DL, Sweet SMM, Cooper HJ, Heath JK. J. Prot. Res. 2010;9:2317–2328. doi: 10.1021/pr9010475. [DOI] [PMC free article] [PubMed] [Google Scholar]
- 18.Loyet KM, Stults JT, Arnott D. Mol. Cell. Proteomics. 2005;4:235–245. doi: 10.1074/mcp.R400011-MCP200. [DOI] [PubMed] [Google Scholar]
- 19.Gerber SA, Rush J, Stemman O, Kirschner MW, Gygi SP. Proc. Natl. Acad. Sci. USA. 2003;100:6940–6945. doi: 10.1073/pnas.0832254100. [DOI] [PMC free article] [PubMed] [Google Scholar]
- 20.Palumbo A, Reid GE. Anal. Chem. 2008;80:9735–9743. doi: 10.1021/ac801768s. [DOI] [PubMed] [Google Scholar]
- 21.Edelson-Averbukh M, Shevchenko A, Pipkorn R, Lehmann WD. Anal. Chem. 2009;81:4369–4381. doi: 10.1021/ac900244e. [DOI] [PubMed] [Google Scholar]
- 22.Creese AJ, Cooper HJ. J. Am. Soc. Mass Spectrom. 2008;19:1263–1274. doi: 10.1016/j.jasms.2008.05.015. [DOI] [PMC free article] [PubMed] [Google Scholar]
- 23.Zubarev RA, Zubarev AR, Savitski MM. J. Am. Soc. Mass Spectrom. 2008;19:753–761. doi: 10.1016/j.jasms.2008.03.007. [DOI] [PubMed] [Google Scholar]
- 24.Woodling KA, Eyler JR, Tsybin YO, Nilsson CL, Marshall AG, Edison AS, Al-Naggar IM, Bubb MR. J. Am. Soc. Mass Spectrom. 2007;18:2137–2145. doi: 10.1016/j.jasms.2007.09.010. [DOI] [PubMed] [Google Scholar]
- 25.Swaney DL, McAlister GC, Wirtala M, Schwartz JC, Syka JEP, Coon JJ. Anal. Chem. 2007;79:477–485. doi: 10.1021/ac061457f. [DOI] [PMC free article] [PubMed] [Google Scholar]
- 26.Sweet SMM, Bailey CM, Cunningham DL, Heath JK, Cooper HJ. Mol. Cell. Proteomics. 2009;8:904–912. doi: 10.1074/mcp.M800451-MCP200. [DOI] [PMC free article] [PubMed] [Google Scholar]
- 27.Singer D, Kuhlmann J, Muschket M, Hoffman R. Anal. Chem. 2010;82:6409–6414. doi: 10.1021/ac100473k. [DOI] [PubMed] [Google Scholar]
- 28.Eiceman GA, Karpaz Z. Ion Mobility Spectrometry. CRC Press; Boca Raton, FL: 2005. [Google Scholar]
- 29.Liu C, Valentine SJ, Plasencia MD, Trimpin S, Naylor S, Clemmer DE. J. Am. Soc. Mass Spectrom. 2007;18:1249–1264. doi: 10.1016/j.jasms.2007.04.012. [DOI] [PMC free article] [PubMed] [Google Scholar]
- 30.McNulty DE, Annan RS. Mol. Cell. Proteom. 2008;7:971–980. doi: 10.1074/mcp.M700543-MCP200. [DOI] [PubMed] [Google Scholar]
- 31.Pringle SD, Giles K, Wildgoose JL, Williams JP, Slade SE, Thalassinos K, Bateman RH, Bowers MT, Scrivens JH. Int. J. Mass Spectrom. 2007;261:1–12. [Google Scholar]
- 32.Ruotolo BT, Verbeck GF, Thomson LM, Woods AS, Gillig KJ, Russell DH. J. Prot. Res. 2002;1:303–306. doi: 10.1021/pr025516r. [DOI] [PubMed] [Google Scholar]
- 33.Ruotolo BT, Gillig KJ, Woods AS, Egan TF, Ugarov MV, Schultz JA, Russell DH. Anal. Chem. 2004;76:6727–6733. doi: 10.1021/ac0498009. [DOI] [PubMed] [Google Scholar]
- 34.Thalassinos K, Grabenauer M, Slade SE, Hilton GR, Bowers MT, Scrivens JH. Anal. Chem. 2009;81:248–254. doi: 10.1021/ac801916h. [DOI] [PubMed] [Google Scholar]
- 35.Valentine SJ, Counterman AE, Hoaglund-Hyzer CS, Clemmer DE. J. Phys. Chem. B. 1999;103:1203–1207. [Google Scholar]
- 36.Shvartsburg AA, Siu KWM, Clemmer DE. J. Am. Soc. Mass Spectrom. 2001;12:885–888. doi: 10.1016/S1044-0305(01)00269-0. [DOI] [PubMed] [Google Scholar]
- 37.Wu C, Siems WF, Klasmeier J, Hill HH. Anal. Chem. 2000;72:391–395. doi: 10.1021/ac990601c. [DOI] [PubMed] [Google Scholar]
- 38.Cooper HJ, Brown J, Campuzano IDG, Tomczyk N, Creese AJ, Williams JP. Proceedings of the 58th ASMS Meeting; Salt Lake City. 2010. [Google Scholar]
- 39.Guevremont R. J. Chromatogr. A. 2004;1058:3–19. [PubMed] [Google Scholar]
- 40.Shvartsburg AA. Differential Ion Mobility Spectrometry. CRC Press; Boca Raton, FL: 2008. [Google Scholar]
- 41.Tang K, Li F, Shvartsburg AA, Strittmatter E, Smith RD. Anal. Chem. 2005;77:6381–6388. doi: 10.1021/ac050871x. [DOI] [PMC free article] [PubMed] [Google Scholar]
- 42.Shvartsburg AA, Mashkevich SV, Smith RD. J. Phys. Chem. A. 2006;110:2663–2673. doi: 10.1021/jp055349t. [DOI] [PMC free article] [PubMed] [Google Scholar]
- 43.Guevremont R, Barnett DA, Purves RW, Vandermey J. Anal. Chem. 2000;72:4577–4584. doi: 10.1021/ac0000271. [DOI] [PubMed] [Google Scholar]
- 44.Xuan Y, Creese AJ, Horner JA, Cooper HJ. Rapid Commun. Mass Spectrom. 2009;23:1963–1969. doi: 10.1002/rcm.4101. [DOI] [PubMed] [Google Scholar]
- 45.Shvartsburg AA, Li F, Tang K, Smith RD. Anal. Chem. 2006;78:3706–3714. doi: 10.1021/ac052020v. [DOI] [PMC free article] [PubMed] [Google Scholar]
- 46.Shvartsburg AA, Tang K, Smith RD. Anal. Chem. 2010;82:32–35. doi: 10.1021/ac902133n. [DOI] [PMC free article] [PubMed] [Google Scholar]
- 47.Shvartsburg AA, Danielson WF, Smith RD. Anal. Chem. 2010;82:2456–2462. doi: 10.1021/ac902852a. [DOI] [PMC free article] [PubMed] [Google Scholar]
- 48.Shvartsburg AA, Prior DC, Tang K, Smith RD. Anal. Chem. DOI: 10.1021/ac101413k. [Google Scholar]
- 49.Shvartsburg AA, Bryskiewicz T, Purves R, Tang K, Guevremont R, Smith RD. J. Phys. Chem. B. 2006;110:21966–21980. doi: 10.1021/jp062573p. [DOI] [PubMed] [Google Scholar]
- 50.Shvartsburg AA, Noskov SY, Purves R, Smith RD. Proc. Nat. Acad. Sci. USA. 2009;106:6495–6500. doi: 10.1073/pnas.0812318106. [DOI] [PMC free article] [PubMed] [Google Scholar]
- 51.Shvartsburg AA, Smith RD. J. Am. Soc. Mass Spectrom. 2007;18:1672–1681. doi: 10.1016/j.jasms.2007.06.013. [DOI] [PubMed] [Google Scholar]
- 52.Shvartsburg AA, Li F, Tang K, Smith RD. Anal. Chem. 2007;79:1523–1528. doi: 10.1021/ac061306c. [DOI] [PubMed] [Google Scholar]
- 53.Shvartsburg AA, Li F, Tang K, Smith RD. Anal. Chem. 2006;78:3304–3315. doi: 10.1021/ac060283z. [DOI] [PubMed] [Google Scholar]
- 54.Srebalus CA, Li J, Marshall WS, Clemmer DE. Anal. Chem. 1999;71:3918–3927. doi: 10.1021/ac9903757. [DOI] [PubMed] [Google Scholar]
- 55.Mabrouki R, Kelly RT, Prior DC, Shvartsburg AA, Tang K, Smith RD. J. Am. Soc. Mass Spectrom. 2009;20:1768–1774. doi: 10.1016/j.jasms.2009.05.019. [DOI] [PMC free article] [PubMed] [Google Scholar]
- 56.Chawner R, Brown J, Giles K, Gaskell SJ, Eyers C. Proceedings of the 58th ASMS Meeting; Salt Lake City. 2010. [Google Scholar]
Associated Data
This section collects any data citations, data availability statements, or supplementary materials included in this article.
Supplementary Materials
Fig. S1. Spectra for binary mixtures of 1, 2, or 3 with z = 2 (left column) and 3 (right column) measured using DV = 4 kV and 70 or 74% He, as marked. The spectra for components, scaled to match the heights of corresponding features in the mixtures, are overlaid.
Fig. S2. FAIMS spectra for peptide 2 relative to those for 3 with z = 2 (left column) and 3 (right column). Measurements used DV = 5.4 kV and 0 - 50% He, as marked. The EC axis was scaled to align the major peak for 3 to unity.
Fig. S3. FAIMS spectra for mixtures of 1 + 2 and 1 + 3 with z = 2 (left column) and 3 (right column) measured using DV = 5.4 kV and 50% He. The spectra for components, scaled to match the heights of corresponding features in the mixtures, are overlaid.


