Abstract
Using a diverse collection of small molecules generated from a variety of sources, we measured protein-binding activities of each individual compound against each of 100 diverse (sequence-unrelated) proteins using small-molecule microarrays. We also analyzed structural features, including complexity, of the small molecules. We found that compounds from different sources (commercial, academic, natural) have different protein-binding behaviors and that these behaviors correlate with general trends in stereochemical and shape descriptors for these compound collections. Increasing the content of sp3-hybridized and stereogenic atoms relative to compounds from commercial sources, which comprise the majority of current screening collections, improved binding selectivity and frequency. The results suggest structural features that synthetic chemists can target when synthesizing screening collections for biological discovery. Because binding proteins selectively can be a key feature of high-value probes and drugs, synthesizing compounds having features identified in this study may result in improved performance of screening collections.
Keywords: chemical diversity, cheminformatics, natural products, small-molecule microarrays, small-molecule probes
Small-molecule probe- and drug-discovery activities in academia and the pharmaceutical industry often begin with high-throughput screening. Many thousands of small molecules are tested with the expectation that each has potential as a discovery lead. Thus, assembling or synthesizing compound collections for small-molecule screening represents an important step in discovery success, particularly when selecting among compounds from a variety of synthetic and natural sources. Unbiased methods to evaluate the assay performance of compounds from different sources, and to relate performance to chemical structure (defined by computed structural properties) (1, 2), can provide guidance to one element of more valuable small-molecule screening collections.
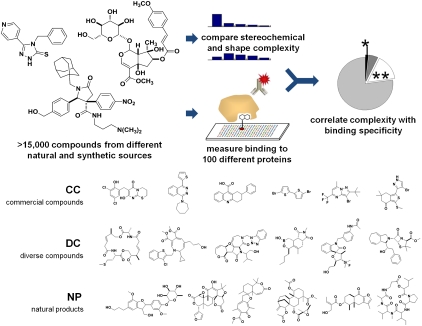
Comparative analyses between compounds often involve cheminformatic analysis of compound structures (3–5) or retrospective analysis of compound performance by mining the literature (6–8) or historical data (9, 10). For example, intermediate molecular complexity has been suggested as theoretically preferable for drug leads (11), and this relationship is supported by evidence mined from historical data (9). In this study, we performed unbiased comparisons of compounds from natural and synthetic sources by first identifying compounds with unknown activities and then exposing them to a common assay platform. We identified a compound collection comprising three subsets: (i) 6,152 compounds from commercial sources that are representative of many common screening collections (commercial compounds; CC); (ii) 6,623 compounds assembled from the academic synthetic chemistry community using, e.g., diversity-oriented synthesis (diverse compounds; DC); and (iii) 2,477 naturally occurring compounds (natural products; NP). We then (i) analyzed distributions of stereochemical and shape complexity for each set; (ii) measured protein-binding activities of each member against each of 100 diverse proteins using small-molecule microarrays (SMMs) (12, 13); and (iii) correlated these computed and measured properties (Fig. 1). The resulting correlations suggest that structural features of small molecules relating to hybridization and stereochemistry are important contributors to binding proteins selectively.
Fig. 1.
Study design to relate structural complexity to protein-binding profiles. Three sources of compounds were studied; diverse samples of each subset are shown to illustrate differences between the subsets (all structures in the study are presented in Dataset S1 and Dataset S2).
Results
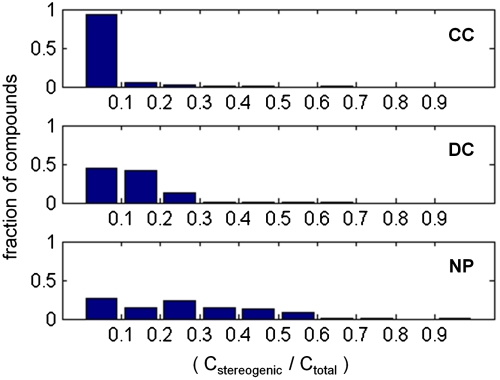
To quantify stereochemical and shape complexity, we calculated two parameters for each compound for comparative analysis between the three compound sources. While it is likely that more complex descriptors may better physically model molecular shape complexity, one motivation of the current study was to link simple size-independent metrics with compound performance. First, we defined stereochemical complexity as the proportion of carbon atoms that are stereogenic (Cstereogenic/Ctotal). This metric provides a size-independent global assessment of stereochemical complexity, varying on the range [0,1] for each molecule. Inspecting histograms of this metric as a function of compound source (Fig. 2) revealed that CC is lowest in stereochemical complexity (median = 0.00; mean = 0.022). In contrast, NP is highest in stereochemical complexity (median = 0.24; mean = 0.24), while DC has intermediate values (median = 0.11; mean = 0.12).
Fig. 2.
Stereochemical complexity of compounds from three sources. Complexity is expressed as the proportion of all carbon atoms that are stereogenic carbon atoms (Cstereogenic/Ctotal).
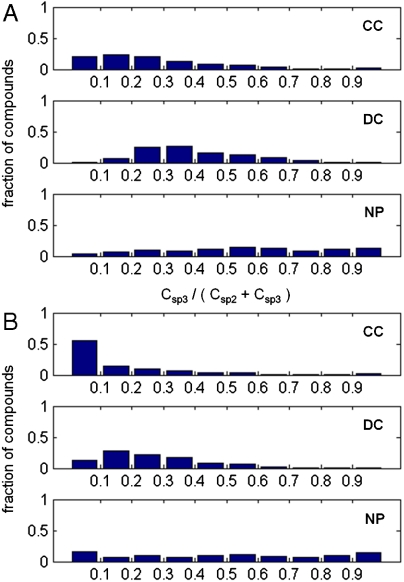
Second, we defined shape complexity as the ratio of sp3-hybridized carbon atoms to total sp3- and sp2-hybridized carbons (Csp3/[Csp2 + Csp3]). This metric is similar to the recently reported Fsp3 metric (14); again, this metric is size-independent, varying on the range [0,1] for each molecule. Using this metric (Fig. 3A), we observed that CC is lowest in proportion of sp3-hybridized carbons (median = 0.22; mean = 0.27), NP is highest (median = 0.55; mean = 0.55), and DC has an intermediate distribution (median = 0.36; mean = 0.39). When we restricted our analysis to carbon atoms in the molecular scaffold (15), we observed a decrease in overall sp3 carbon proportions in all three populations (Fig. 3B). This effect was most striking in CC (median = 0.071; mean = 0.16), indicating that a substantial portion of sp3 carbons in these molecules are in appendages rather than in (predominantly flat) core skeletons. In contrast, NP molecules retain a large proportion of their sp3 carbons in core skeletons (median = 0.50; mean = 0.49).
Fig. 3.
Shape complexity of compounds from three sources. Complexity is expressed as the proportion of sp2- or sp3-hybridized carbon atoms that are sp3-hybridized (Csp3/[Csp2 + Csp3]); (A) whole molecules, (B) “scaffold” atoms in the molecular framework only.
In addition to analyzing computed properties, we sought to determine differences in protein-binding abilities of compounds from different origins. For this study, we analyzed a dataset resulting from testing all members of the compound collection individually in binding assays against each of 100 different purified proteins using the SMM platform, which gives a preliminary indication of protein binding. In terms of sequence, proteins were selected having a wide range of structural types rather than representing a family or families of proteins. In terms of function, the proteins were selected having varying roles in transcriptional regulation. SMM slides were exposed in triplicate to each of 100 purified proteins in independent experiments and to a common epitope tag as a control. For the present study, we scored as “hits” for each protein those compounds whose average deviation from control-spot intensities exceeded a fixed threshold for statistical significance, after correction for multiple hypothesis testing (see Materials and Methods). We also eliminated compounds that bound the antibody to the control epitope tag, because these events likely do not correspond to specific binding to the 100 panel proteins. These experiments resulted in a matrix of binary hit calls for 15,252 compounds versus 100 proteins, of which 3,433 (22.5%) compounds bound at least one protein (Fig. 4). We note that this high fraction of compounds binding any protein is not unexpected with 100 parallel protein-binding assays; for example, if hit rates were 0.5% for each protein, and hit compounds were selected randomly for each of 100 proteins, we would expect 1 - (0.995)100≈39% of compounds to bind at least one protein.
Fig. 4.
Binary hit calls for compounds from three sources against 100 proteins. Heatmap depicts presence (white) or absence (black) of a hit call for all compounds scoring as hits against at least one protein. Colored bars indicate source of compounds: CC (red), NP (green), DC (blue).
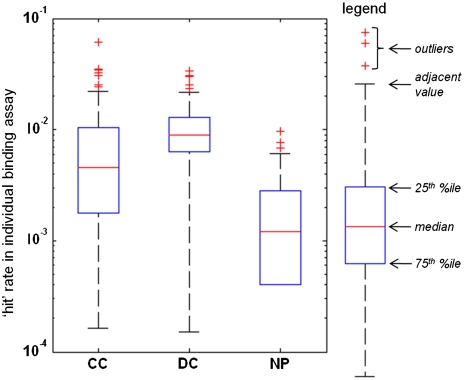
We characterized the resulting 100 protein-binding profiles for each of CC, DC, and NP subsets using two measures of performance that inform how useful a small-molecule collection might be to the screening community: (i) a measure of the rate at which hits were identified from each subset, and (ii) a measure of specificity of the discovered hits from each subset, based on the number of proteins bound by a given hit. First, we examined the propensity of compounds from different sources to score positive in any protein-binding assay. A smaller proportion of NP compounds (13%; 324) were called a hit in any assay than were CC (23%; 1,415) or DC (26%; 1,694) compounds. To determine whether compounds from different sources afford different hit rates in protein-binding assays, we calculated 100 separate hit rates (one per protein) for compounds from each source. Analysis of these hit-rate distributions (Fig. 5) revealed that median hit rates are highest, and distribution least disperse, for DC. Median hit rates were intermediate for CC but with more dispersion in their values. Median hit rates were lowest for NP, with only 7 of 100 rates for NP exceeding those in the lowest quartile for DC. Thus, compounds from different sources exhibit different group-wide behavior in protein-binding experiments, using the proteins included in this study.
Fig. 5.
Hit-rate analysis of compounds from three sources in 100 protein-binding assays. Box-whisker plots depict second and third quartiles (blue boxes) above and below median values (red lines) with adjacent values indicating maximum nonoutlier values (black whiskers) and outlier values (red crosses); see legend at right. These data show the greatest hit rates for DC and lowest for NP (see text).
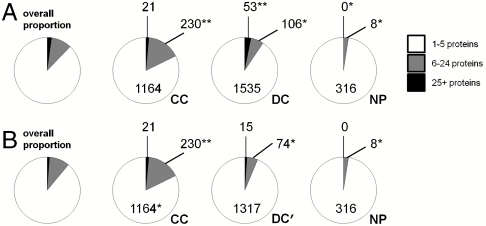
This first analysis considered any binding event in establishing hit rates. To compare the binding specificity for compounds from each source, we determined the relative proportions of both highly promiscuous and highly specific compounds. To evaluate highly promiscuous compounds (Fig. 6A), we determined the relative proportion of hit compounds binding 1–5 proteins (specific), 6–24 proteins (promiscuous), or 25+ proteins (highly promiscuous). Both CC and DC harbor significantly enriched proportions of compounds that were either promiscuous (CC; 16%) or highly promiscuous (DC; 3.1%) in binding profiles. Because the synthetic pathways for DC were well-defined, we were able to categorize most (74.7%) of the 1,160 hit compounds as having come from one of 21 distinct synthetic chemistry pathways each having at least 20 members in DC (the remainder were either individual submissions or only identified by the contributing laboratory, rather than by a specific synthesis pathway).
Fig. 6.
Analysis of binding promiscuity among hit compounds. Three promiscuity categories were evaluated for compounds scored as hits against at least one protein in 100 protein-binding assays: binding to 1–5 proteins (white), 6–24 proteins (gray), 25+ proteins (black); numbers of compounds with significant enrichment (**) or depletion (*), relative to the overall proportion (far left), are indicated. These data show (A) CC members are most likely to bind 6+ proteins, NP members least likely, and DC members intermediate; (B) reevaluation after removing spiroxindole-based compounds derived from one synthetic pathway in DC to create DC′ (see text) suggests that much promiscuous binding among DC can be attributed to a single class of compound.
To determine whether binding promiscuity in DC could be traced to a relatively small number of similar compounds, we tested whether the distributions of numbers of bound proteins for each of these 21 pathways could be distinguished from DC at large. We identified a single pathway, based on a spiroxindole skeleton (16), that was dramatically enriched (p < 1.6 × 10⁻¹² using a Kolmogorov–Smirnov test (17) between its members and the rest of DC) in the number of proteins to which its members bound (mean = 11.4 proteins vs. mean = 2.4 proteins for the rest of DC). This insight allowed us to reanalyze promiscuity using a DC subset, termed DC′, lacking the 660 compounds derived from this synthetic pathway (of which 288 were hit compounds, the right-most 288 columns in Fig. 4). Using DC′ rather than DC in the overall comparison (Fig. 6B), we observed that only CC remained significantly enriched in promiscuous compounds and contained fewer specific members (82%) than expected by chance (i.e., if promiscuous compounds were spread across CC, DC′, and NP in proportion to the size of each group), given the lower total number of compounds. In contrast, DC (6.3%), DC′ (5.3%), and NP (2.5%) all contained proportions of promiscuous compounds lower than expected by chance (again relative to proportional representation). All other observations could be explained by statistical expectation, based on overall proportions across all three sources. This ability to identify and to eliminate problematic outliers derived from a specific synthetic pathway in DC should be useful in efforts to create optimally diverse and specific small-molecule screening collections.
To rule out whether cryptic groups of related structures might similarly explain promiscuity within CC (analogous to the spiroxindoles removed from DC), we compared Tanimoto fingerprint similarities (unfolded ECFP_4) (18, 19) among the most promiscuous members of CC to those of the entire CC group and found them to be very similar (0.109 vs. 0.112 average similarity, indicating slightly more self-similarity among CC as a whole than among the most promiscuous members). We also checked the 251 most promiscuous members of CC for substructures common to at least 10% of the members and found nothing larger than an N-benzylethylamine substructure (27 instances, or 10.8%, compared with 11.7% occurrence in all of CC) in common among these compounds. These tests suggest that, in contrast to DC, the tendency to promiscuity among CC members is distributed over a large number of “chemotypes.”
We also examined the distribution of hit specificities in the CC, DC′, and NP subsets (Fig. 7). We determined the relative proportion of hit compounds binding exactly one protein (highly specific), 2–5 proteins (partially specific), or 6+ proteins (promiscuous). These groupings parallel those in our promiscuity analysis, merging the two promiscuous groups into a single category and splitting the specific group into two categories. We found that CC harbors significantly enriched proportions of partially specific (28%) and promiscuous (18%) compounds and is depleted in highly specific (54%) compounds. In contrast, both DC′ (73%) and NP (83%) are significantly enriched in highly specific compounds, with a corresponding depletion (DC′: 6.3%; NP: 2.5%) of promiscuous compounds. Further, NP is depleted even of partially specific compounds (15%). Across all specificity categories, only the proportion of partially specific DC′ members was consistent with overall proportions across all three sources.
Fig. 7.
Analysis of binding specificity among hit compounds. Three specificity categories were evaluated for compounds scored as hits against at least one protein in 100 protein-binding assays: binding to exactly one protein (white), 2–5 proteins (gray), 6+ proteins (black); numbers of compounds indicating significant enrichment (**) or depletion (*), relative to the overall proportion (far left), are indicated. These data show both DC′ and NP members are most likely to bind exactly one protein, while significant fractions of CC members bind at least two proteins (see text).
Finally, we determined whether binding trends could be connected directly with computed properties, irrespective of compound source. We categorized all 15,252 compounds into three categories of stereochemical complexity (using Cstereogenic/Ctotal), restricting our analysis to carbons in the molecular scaffold (cf., Fig. 2B): stereochemically simple (Cstereogenic/Ctotal = 0), intermediate (0 < Cstereogenic/Ctotal ≤ 0.25), and complex (Cstereogenic/Ctotal > 0.25) molecules (Fig. 8). We observed that stereochemically simple molecules are significantly enriched in binders to 2+ proteins (9.5%), and stereochemically complex molecules are depleted for such binders (3.5%). The stereochemically complex category is also depleted for compounds binding any protein, consistent with our finding that NP has both the highest stereochemical complexity and the lowest overall hit rates. Most interestingly, compounds with intermediate stereochemical complexity, regardless of source, are enriched in binders to exactly 1 of 100 tested proteins (15.7%) and depleted of compounds that bind 6+ proteins (1.7%). To verify that these results were not significantly skewed by false negatives, i.e., small molecules lacking a functional group known to print effectively on SMMs (20), we confirmed that there were no significant differences in proportions among promiscuity categories between compounds having or lacking such functional groups.
Fig. 8.
Connection between binding specificity and stereochemical complexity. Four specificity categories (including non-hits) were evaluated: binding to 0 proteins (light gray), exactly 1 protein (white), 2–5 proteins (gray), 6+ proteins (black); numbers of compounds indicating significant enrichment (**) or depletion (*) relative to proportional representation are indicated. These data show stereochemically simple compounds most likely bind multiple proteins, intermediate complexity compounds most likely bind exactly 1 protein, and the most complex compounds most likely bind 0 proteins (see text).
Discussion
Viewed globally, approximately 15,000 compounds from three different sources have strikingly different behaviors when tested individually for their ability to bind members of a large collection of sequence-unrelated proteins. The subcollections of compounds tested here are unbiased, because they were assembled without prior knowledge of the properties or assay performances of their members, although we note that the choices otherwise were made largely for practical reasons, namely availability in our overall screening collection in formats amenable to SMM production.
We observed general trends among stereochemical and shape descriptions of these compound collections. Both protein-binding frequencies and selectivities are increased among compounds having: (i) increased content of sp3-hybridized atoms relative to commercial compounds, and (ii) intermediate frequency of stereogenic elements relative to commercial (low frequency) and natural (high frequency) compounds. Encouragingly, these favorable structural features are increasingly accessible using modern advances in the methods of organic synthesis (21–26) and commonly targeted by academic organic chemists as judged by the compounds used in this study that were contributed by members of this community. On the other hand, these features are notably deficient in members of compound collections currently widely used in probe- and drug-discovery efforts.
The choice of our simple stereochemical complexity descriptor for correlation with binding data reflects the motivation of the current study to link simple size-independent metrics and performance. In future studies, we will aim to test more systematically whether other descriptors, features, or physicochemical properties might be quantitatively related to such performance metrics, e.g., as judged by multivariate regression analysis. Future studies might also be more deliberate about choosing either structurally representative or diverse subsets from larger compound collections. Similarly, larger samples of compounds, different proteins, and different assay formats, especially cell-based ones, will be required to establish the generality of our conclusions.
The ability of small molecules to bind proteins selectively is just one factor that determines their value as leads in probe- and drug-discovery efforts. Not examined in this study are their ability to modulate protein functions in cells and organisms and their ease of optimization using organic synthesis. Nevertheless, these results already cast some doubt on the wisdom of the common heavy reliance on sp2-rich commercial compounds in small-molecule screening efforts. In preliminary analyses to be and recently reported elsewhere, additional differences have been identified in cellular assay contexts on the one hand and relative to natural selection (27) on the other. In the future, measuring the facility of optimizing compounds having different origins will be useful to guide even more valuable screening collections. The studies reported here constitute one step toward the goal of quantifying the biological performance of compounds from different origins and having different computed structural properties, assisting in distinguishing fact from intuition.
Materials and Methods
Compound Collections.
Small molecules in CC were obtained from ChemDiv (www.chemdiv.com/), Maybridge (www.maybridge.com/), and TimTec (www.timtec.com/). Small molecules in DC were obtained from several academic laboratories, including member laboratories of the NIGMS Centers of Excellence in Chemical Methodology and Library Development (www.nigms.nih.gov/Initiatives/CMLD/). Small molecules in NP were obtained from Analyticon (www.ac-discovery.com/). In all cases, compounds were maintained by the Broad Institute compound management group prior to their use in the experiments described. Dataset S1 contains: a table (“compounds”) listing the simplified molecular input line entry specification (SMILES) (28, 29) representation of each compound used in this study; a table (“descriptors”) indicating the category (CC, DC, or NP), structure descriptors, and ChemBank (30) names for each compound; a table (“proteins”) listing the proteins used in this study; and a table (“CpdsXProteins”) of binary hit calls for all measurements. ChemBank names identify commercial sources and can be used to obtain additional information about the compounds from either ChemBank (http://chembank.broadinstitute.org) or PubChem (http://pubchem.ncbi.nlm.nih.gov). Dataset S2 contains an alternative representation of all compound structures in SDF file format.
Small-Molecule Microarrays.
Each compound in the study was printed on glass microscope slides according to published SMM protocols (13). In silico functional group analysis of compounds study revealed that 76.8% of the compounds contain at least one functional group previously shown to undergo covalent attachment to SMMs (20) using an isocyanate surface-attachment chemistry, such as alcohols, phenols, acids, thiols, and amines. The remaining compounds may print covalently through groups not previously tested or may simply adsorb noncovalently. Proteins spanning 145 InterPro domain classifications (www.ebi.ac.uk/interpro/) were obtained commercially as His6 epitope-tagged reagents for rapid identification using fluorophore-conjugated anti-His6 antibodies. Importantly, many of these proteins were explicitly tested in appropriate functional assays to ensure that they were properly folded, and all SMM experiments were performed under conditions that were developed to be compatible with protein function. Complete details of these binding assays, including SMM printing, protein-binding, wash conditions, image analysis, scoring methods, confirmatory experiments, and functional studies of hit compounds, will be described elsewhere. Dataset S1 contains a table listing the complete set of protein names used in this study, each as approved names or aliases recognized by the HUGO Gene Nomenclature Committee (http://www.genenames.org/index.html).
Data Analysis.
SMM slides were scanned by a GenePix scanner (Molecular Devices), and each SMM spot intensity was scored by its deviation from a population of vehicle-control spots on the same slide. Three replicate measurements were combined as weighted averages of deviations, normalized by the variance of corresponding vehicle-control distributions and measurement uncertainties. We called a positive hit any compound whose normalized score for protein binding exceeded the expected score for the most extreme acceptable vehicle-control outlier at a fixed statistical significance (familywise error rate p < 0.05 by Holm–Bonferroni method) (31), indicating a greater likelihood that the compound was a member of a putative hit distribution than of the vehicle-control distribution. To ensure that hit calls were not influenced by subset-specific differences in functional groups predicted to print covalently, we compared the overall hit rates for the sets of compounds either lacking or having known-printable functional groups (20) and found these rates essentially unchanged for all three subsets (23.3% vs. 22.8% for CC, 24.7% vs. 25.7% for DC, 13.7% vs. 13.0% for NP). ECFP4 fingerprints, molecular scaffolds, molecular property counts, and derived descriptors were computed using Pipeline Pilot (Accelrys, Inc.). Statistical analyses, visualizations of distributions, and all Results figures were prepared in MATLAB (The MathWorks, Inc.). Significance of enrichment or depletion of compound groups in either promiscuity or specificity groups was determined using the chi-squared test for homogeneity, with individual enrichment/depletion assignments by the method of normalized residuals (32). Dataset S1 contains a table listing the complete binary (15,252 × 100) hit calls used in the analysis.
Supplementary Material
Acknowledgments.
Supported by NIGMS (P50-GM069721), the National Institutes of Health RoadMap (P20-HG003895), and the National Cancer Institute (N01-CO-12400). S.L.S. is an investigator at the Howard Hughes Medical Institute.
Footnotes
The authors declare no conflict of interest.
This article contains supporting information online at www.pnas.org/lookup/suppl/doi:10.1073/pnas.1012741107/-/DCSupplemental.
References
- 1.Iwasa J, Fujita T, Hansch C. Substituent constants for aliphatic functions obtained from partition coefficients. J Med Chem. 1965;8:150–153. doi: 10.1021/jm00326a002. [DOI] [PubMed] [Google Scholar]
- 2.Fujita T, Hansch C. Analysis of the structure-activity relationship of the sulfonamide drugs using substituent constants. J Med Chem. 1967;10:991–1000. doi: 10.1021/jm00318a001. [DOI] [PubMed] [Google Scholar]
- 3.Feher M, Schmidt JM. Property distributions: Differences between drugs, natural products, and molecules from combinatorial chemistry. J Chem Inf Comput Sci. 2003;43:218–227. doi: 10.1021/ci0200467. [DOI] [PubMed] [Google Scholar]
- 4.Ertl P, Schuffenhauer A. Cheminformatics analysis of natural products: lessons from nature inspiring the design of new drugs. Prog Drug Res. 2008;66:218–235. doi: 10.1007/978-3-7643-8595-8_4. [DOI] [PubMed] [Google Scholar]
- 5.Singh N, et al. Chemoinformatic analysis of combinatorial libraries, drugs, natural products, and molecular libraries small molecule repository. J Chem Inf Model. 2009;49:1010–1024. doi: 10.1021/ci800426u. [DOI] [PMC free article] [PubMed] [Google Scholar]
- 6.Lipinski CA. Experimental and computational approaches to estimate solubility and permeability in drug discovery and development settings. Adv Drug Deliver Rev. 1997;23:3–25. doi: 10.1016/s0169-409x(00)00129-0. [DOI] [PubMed] [Google Scholar]
- 7.Lipinski CA, Hopkins A. Navigating chemical space for biology and medicine. Nature. 2004;432:855–861. doi: 10.1038/nature03193. [DOI] [PubMed] [Google Scholar]
- 8.Ganesan A. The impact of natural products upon modern drug discovery. Curr Opin Chem Biol. 2008;12:306–317. doi: 10.1016/j.cbpa.2008.03.016. [DOI] [PubMed] [Google Scholar]
- 9.Schuffenhauer A, Brown N, Selzer P, Ertl P, Jacoby E. Relationships between molecular complexity, biological activity, and structural diversity. J Chem Inf Model. 2006;46:525–535. doi: 10.1021/ci0503558. [DOI] [PubMed] [Google Scholar]
- 10.Muchmore SW, et al. Application of belief theory to similarity data fusion for use in analog searching and lead hopping. J Chem Inf Model. 2008;48:941–948. doi: 10.1021/ci7004498. [DOI] [PubMed] [Google Scholar]
- 11.Hann MM, Leach AR, Harper G. Molecular complexity and its impact on the probability of finding leads for drug discovery. J Chem Inf Comput Sci. 2001;41:856–864. doi: 10.1021/ci000403i. [DOI] [PubMed] [Google Scholar]
- 12.Koehler AN, Shamji AF, Schreiber SL. Discovery of an inhibitor of a transcription factor using small molecule microarrays and diversity-oriented synthesis. J Am Chem Soc. 2003;125:8420–8421. doi: 10.1021/ja0352698. [DOI] [PubMed] [Google Scholar]
- 13.Duffner JL, Clemons PA, Koehler AN. A pipeline for ligand discovery using small-molecule microarrays. Curr Opin Chem Biol. 2007;11:74–82. doi: 10.1016/j.cbpa.2006.11.031. [DOI] [PubMed] [Google Scholar]
- 14.Lovering F, Bikker J, Humblet C. Escape from flatland: Increasing saturation as an approach to improving clinical success. J Med Chem. 2009;52:6752–6756. doi: 10.1021/jm901241e. [DOI] [PubMed] [Google Scholar]
- 15.Bemis GW, Murcko MA. The properties of known drugs. 1. Molecular frameworks. J Med Chem. 1996;39:2887–2893. doi: 10.1021/jm9602928. [DOI] [PubMed] [Google Scholar]
- 16.Lo MM, Neumann CS, Nagayama S, Perlstein EO, Schreiber SL. A library of spirooxindoles based on a stereoselective three-component coupling reaction. J Am Chem Soc. 2004;126:16077–16086. doi: 10.1021/ja045089d. [DOI] [PubMed] [Google Scholar]
- 17.Massey FJ., Jr The Kolmogorov-Smirnov Test for Goodness of Fit. J Am Stat Assoc. 1951;46:68–78. [Google Scholar]
- 18.Rogers D, Brown RD, Hahn M. Using extended-connectivity fingerprints with Laplacian-modified Bayesian analysis in high-throughput screening follow-up. J Biomol Screen. 2005;10:682–686. doi: 10.1177/1087057105281365. [DOI] [PubMed] [Google Scholar]
- 19.Rogers D, Hahn M. Extended-connectivity fingerprints. J Chem Inf Model. 2010;50:742–754. doi: 10.1021/ci100050t. [DOI] [PubMed] [Google Scholar]
- 20.Bradner JE, et al. A robust small-molecule microarray platform for screening cell lysates. Chem Biol. 2006;13:493–504. doi: 10.1016/j.chembiol.2006.03.004. [DOI] [PubMed] [Google Scholar]
- 21.Corey EJ, Cheng X-M. The Logic of Chemical Synthesis. New York: John Wiley; 1989. p. 436. [Google Scholar]
- 22.Sharpless KB. Searching for new reactivity (Nobel lecture) Angew Chem Int Ed Engl. 2002;41(12):2024–2032. [PubMed] [Google Scholar]
- 23.Grubbs RH. Olefin-metathesis catalysts for the preparation of molecules and materials (Nobel lecture) Angew Chem Int Ed Engl. 2006;45:3760–3765. doi: 10.1002/anie.200600680. [DOI] [PubMed] [Google Scholar]
- 24.Beeler AB, Su S, Singleton CA, Porco JA., Jr Discovery of chemical reactions through multidimensional screening. J Am Chem Soc. 2007;129:1413–1419. doi: 10.1021/ja0674744. [DOI] [PubMed] [Google Scholar]
- 25.Muratore ME, et al. Enantioselective Bronsted acid-catalyzed N-acyliminium cyclization cascades. J Am Chem Soc. 2009;131:10796–10797. doi: 10.1021/ja9024885. [DOI] [PubMed] [Google Scholar]
- 26.Verendel JJ, et al. Highly flexible synthesis of chiral azacycles via iridium-catalyzed hydrogenation. J Am Chem Soc. 2010;132:8880–8881. doi: 10.1021/ja103901e. [DOI] [PubMed] [Google Scholar]
- 27.Dancik V, Seiler KP, Young DW, Schreiber SL, Clemons PA. Distinct biological network properties between the targets of natural products and disease genes. J Am Chem Soc. 2010;132:9259–9261. doi: 10.1021/ja102798t. [DOI] [PMC free article] [PubMed] [Google Scholar]
- 28.Weininger DA. SMILES, a chemical language and information system 1: Introduction and encoding rules. J Chem Inf Comput Sci. 1988;28:31–36. [Google Scholar]
- 29.Weininger DA, Weininger A, Weininger JL. SMILES 2: Algorithm for generation of unique SMILES notation. J Chem Inf Comput Sci. 1989;29:97–101. [Google Scholar]
- 30.Seiler KP, et al. ChemBank: A small-molecule screening and cheminformatics resource database. Nucleic Acids Res. 2008;36:D351–359. doi: 10.1093/nar/gkm843. [DOI] [PMC free article] [PubMed] [Google Scholar]
- 31.Holm S. A simple sequentially rejective multiple test procedure. Scand J Stat. 1979;6:65–70. [Google Scholar]
- 32.Sheshkin DJ. Handbook of Parametric and Nonparametric Statistical Procedures. 2nd Ed. Boca Raton, FL: Chapman & Hall/CRC; 2004. p. 1016. [Google Scholar]
Associated Data
This section collects any data citations, data availability statements, or supplementary materials included in this article.


