

Abstract
Background
Microarray hybridization studies in Sezary Syndrome (SS) have compared T lymphocytes from cutaneous T-cell lymphoma patients to those of normal controls; a major limitation of this design is that significant inherent genetic variability of lymphocyte populations between individuals may produce differences in gene expression unrelated to disease state.
Objective
The objective of this study was to minimize the heterogeneity of information derived from whole-genome expression analysis and to identify specific genetic differences between highly purified malignant and nonmalignant (control) T cells from the same SS patient.
Patients/Methods
Peripheral blood mononuclear cells were obtained from a SS patient, stained with anti-T cell receptor-Vβ (TCR-Vβ) antibodies, and sorted by multiparameter flow cytometry. Malignant cells expressed the dominant TCR-Vβ; control T cells lacked the dominant TCR-Vβ but were otherwise phenotypically identical (CD3+ CD4+ CD45RO+). These cell populations were compared using the Illunina Inc. Sentrix Human-6 expression BeadChip system.
Results
Transcriptome analysis using the J5 test, which was selected for data analysis based on an efficiency analysis of competing statistical methods, showed differential expression of 44 genes between the malignant and nonmalignant cell subsets. Promyelocytic leukemia zinc finger protein (ZBTB16) was the most profoundly upregulated gene in the malignant cell population, while interferon regulatory factor 3 (IRF3) and interferon-induced protein 35 (IFI35), which are important elements of the cellular response to viral infection, were significantly downregulated.
Conclusions
The results of this study suggest the feasibility of this novel comparative approach to genomic profiling in SS. Using this approach, we identified several differentially expressed genes and pathways not previously described in SS. While these findings require validation in larger studies, they may be important in SS pathogenesis.
Keywords: Cutaneous T-Cell Lymphoma, Sezary Syndrome, Gene Expression Microarray Analysis, genomics, T-Cell Receptor beta-Chain
What’s already known about this topic?
A number of microarray hybridization studies have compared Sezary cells to peripheral blood mononuclear cells from individuals without CTCL, and have identified differentially expressed genes.
What does this study add?
This study introduces a novel approach to genomic profiling in Sezary syndrome, comparing leukemic to non-tumour CD4+ cells from the same Sezary syndrome patient by genomic hybridization. This new method minimizes the confounding effects of genetic variability unrelated to tumour status, which has likely contributed to inconsistent results in previous Sezary syndrome microarray studies.
Introduction
The pathogenesis of Sezary syndrome (SS), a rare leukemic form of cutaneous T cell lymphoma (CTCL), is largely unknown, and the discovery of disease-specific biomarkers is important for the advancement of diagnostic and therapeutic paradigms for the disorder. Several studies have compared CTCL gene expression profiles to those of various controls, yielding highly inconsistent results1-4. We sought to minimize this variation through the novel approach of comparing malignant and nonmalignant CD4+ T cells in a patient with SS, with the patient’s own nonmalignant CD4+ cells serving as an internal control.
Methods
Blood was drawn from a patient with histologically confirmed Sezary Syndrome (SS), seen at the Cutaneous Lymphoma Clinic at the University of Pittsburgh, in accordance with an Institutional Review Board-approved protocol.
Peripheral blood mononuclear cells (PBMCs) were isolated by Ficoll-Paque (GE Healthcare Life Sciences, Piscataway, NJ) density centrifugation and stained with eight TCR-Vβ cocktails (Beckman Coulter, Fullerton, CA), each containing three TCR-Vβ antibodies conjugated to FITC, PE, or both FITC and PE (representing a total of 24 Vβ families). Stained cells were incubated for 20 minutes on ice, washed, resuspended in fixative, and analyzed by multiparameter flow cytometry. In this patient, malignant CD3+/CD4+ cells were identified as possessing an expansion of Vβ 5.1. For malignant cell isolation, PBMCs were stained with anti-CD3-ECD, anti-CD4-PC7, anti-CD45RO-APC, and anti-Vβ5.1-PE antibodies (Beckman Coulter). CD3+ CD4+ CD45RO+ T cells were sorted into Vβ 5.1+ and Vβ 5.1- subsets using a Dako-Cytomation MoFLo high speed cell sorter. A Giemsa stained blood smear confirmed Sezary cell morphology.
Total RNA was isolated using the Ambion RNAqueous®-Micro RNA isolation kit (Applied Biosystems, Austin, TX). RNA Amplification and conjugation were performed using the BD Biosciences Super SMART RNA amplification and labeling system (Clontech Laboratories, Inc. Mountain View, CA), per manufacturer instructions. Biotinilated cRNA was hybridized to an Illumina Inc. Sentrix Human-6 Expression BeadChip (Illumina, Inc., San Diego, CA). The BeadChip was processed and scanned per manufacturer instructions.
Based on an efficiency analysis, performed to determine the analysis method and normalization/feature selection combination leading to the most internally consistent gene set5, data was normalized with log2 and z-transformation, and the J5 test was used to identify differentially expressed genes6.
A pathway level impact analysis was implemented, which was designed to provide both statistical and biological significance in indicating the pathways affected by observed gene expression changes7. The results are summarized as impact scores and p-values.
To compare relative frequencies of gene ontology categories represented in the gene list, we used the Webgestalt module of the Gene Ontology Tree Machine8.
Results and Discussion
Several microarray studies have compared the PBMCs of CTCL patients to those of normal controls1-4. Genomic differences were demonstrated, but with widely inconsistent results. Major limitations in comparing SS PBMCs to normal controls are (1) significant inherent genetic variability of lymphocyte populations between individuals, which could produce differences in gene expression unrelated to disease state, and (2) heterogeneity of SS patients’ circulating T lymphocytes, which do not consist exclusively of the malignant cell population.
To minimize the heterogeneity of information derived from SS patients’ PBMCs and improve the purity of controls, we compared malignant to control T cells from the same SS patient that were phenotypically identical except for TCR-vβ expression. The majority of malignant cells from CTCL/SS patients possess a mature memory phenotype and express markers (CD3+CD4+CD45RO+) which can be used to non-selectively separate cells containing the malignant population9. Expression of dominant TCR-vβ was then used to distinguish between the malignant (expressing the dominant TCR-vβ) and nonmalignant (all other TCR-vβ families) mature memory CD4+ populations. The patient’s circulating CD4+ T cell population showed expansion of the TCR-Vβ 5.1 family, with the Vβ 5.1+ subset constituting 36% of the patient’s CD3+CD4+CD45RO+ cells. Blood smear of isolated Vβ 5.1+ cells demonstrated cells with convoluted nuclei, consistent with Sezary cell morphology. Thus, highly purified and selected cell populations were identified and isolated from an SS patient’s blood based on the central memory phenotype of CD4+ cells and TCR-vβ identity.
To further improve assay specificity and reduce the signal/noise ratio, we used BeadChip microarray technology (Illumina Inc.), which had not previously been used in CTCL. The J5 test6, chosen to analyze the microarray data based on an efficiency analysis analysis5, demonstrated 44 genes significantly over- or under-expressed in malignant Vβ 5.1+ circulating CD4+ T cells relative to nonmalignant Vβ 5.1- circulating CD4+ T cells (Table 1). Importantly, many of these genes are known to be associated with carcinogenesis and immunologic dysfunction.
Table 1.
Overexpressed (positive J5) and underexpressed (negative J5) genes in malignant circulating CD4+ T cells relative to non-malignant circulating CD4+ cells. Shown in order of decreasing J5 score
| Gene symbol | Gene title | J5 | Accession |
|---|---|---|---|
| ZBTB16 | Zinc finger and BTB domain containing 16 (promyelocytic leukemia zinc finger protein) | 15.893 | NM_006006.3 |
| CD6 | CD6 antigen | 15.797 | NM_006725.1 |
| OK/SW-cl.56 | Beta 5-tubulin | 13.379 | XM_114617.3 |
| UBE4B | Ubiquitination factor E4B | 12.16 | NM_006048.2 |
| ZNF331 | Zinc finger protein 331 | 12.132 | NM_018555.3 |
| SFXN1 | Sideroflexin 1 | 12.021 | NM_022754.3 |
| HNRPU | Heterogeneous nuclear ribonucleoprotein U (scaffold attachment factor A), transcript variant 2 | 11.904 | NM_004501.2 |
| BIK | BCL2-interacting killer (apoptosis-inducing) | 11.903 | NM_001197.3 |
| LOC286379 | LOC286379 | 11.321 | XM_212297.1 |
| KIAA1030 | Immunoglobulin superfamily, member 9B | 11.297 | XM_290502.1 |
| DDX41 | DEAD (Asp-Glu-Ala-Asp) box polypeptide 41 | 11.275 | NM_016222.2 |
| DKFZP434I0714 | Hypothetical protein DKFZP434I0714 | 11.188 | XM_098247.1 |
| KCNN4 | Potassium intermediate/small conductance calcium-activated channel, subfamily N, member 4 | 11.148 | NM_002250.2 |
| LOC351347 | LOC351347 | 11.146 | XM_304482.1 |
| RNF19A | Ring finger protein 19A, transcript variant 1 | 11.077 | NM_183419.1 |
| TMEM175 | Transmembrane protein 175 | 10.652 | NM_032326.2 |
| PTOV1 | Prostate tumor overexpressed gene 1 | 10.57 | NM_017432.2 |
| ITGB1 | Integrin, beta 1, transcript variant 1A | 10.409 | NM_002211.2 |
| LOC157562 | Hypothetical protein LOC157562 | 10.374 | XM_098779.1 |
| LOC283745 | LOC283745 | 10.371 | XM_211188.1 |
| CNIH4 | Cornichon homolog 4 (Drosophila) | 10.324 | NM_014184.1 |
| BAIAP2L2 | BAI1-associated protein 2-like 2 | 10.184 | NM_025045.3 |
| MED27 | Mediator complex subunit 27 | 10.155 | NM_004269.2 |
| CHIC2 | Cysteine-rich hydrophobic domain 2 | 10.063 | NM_012110.2 |
| CD52 | CD52 antigen (CAMPATH-1 antigen) | 10.024 | NM_001803.1 |
| PEBP1 | Phosphatidylethanolamine binding protein 1 | 10.012 | NM_002567.2 |
| CAPN3 | Calpain 3, (p94), transcript variant 5 | 9.949 | NM_173089.1 |
| PTPRCAP | Protein tyrosine phosphatase, receptor type, C-associated protein | 9.936 | NM_005608.1 |
| SP140 | SP140 nuclear body protein | -9.898 | NM_007237.2 |
| KIAA1171 | KIAA1171 protein | -9.983 | XM_370928.2 |
| LOC388299 | Similar to coenzyme A diphosphatase | -9.998 | XM_370993.1 |
| RPS2 | Ribosomal protein S2 | -10.302 | NM_002952.2 |
| SLC27A3 | Solute carrier family 27 (fatty acid transporter), member 3 | -10.341 | NM_024330.1 |
| LOC388011 | Hypothetical gene supported by AK091668 | -10.442 | XM_373606.2 |
| RAPGEF3 | Rap guanine nucleotide exchange factor (GEF) 3 | -10.593 | NM_006105.3 |
| VAMP8 | Vesicle-associated membrane protein 8 (endobrevin) | -10.792 | NM_003761.2 |
| IFI35 | Interferon-induced protein 35 | -11.481 | NM_005533.2 |
| LOC167454 | LOC167454 | -11.98 | XM_094496.3 |
| ARID1A | AT rich interactive domain 1A (SWI-like) | -12.227 | NM_006015 |
| PWWP2 | PWWP domain containing 2 | -12.412 | NM_138499.1 |
| LOC285535 | Hypothetical protein LOC285535 | -14.14 | XM_211930.1 |
| PAG | Phosphoprotein associated with glycosphingolipid-enriched microdomains | -14.344 | NM_018440.2 |
| IRF3 | Interferon regulatory factor 3 | -15.17 | NM_001571.1 |
| LOC144571 | Hypothetical protein LOC144571 | -16.063 | XM_096630.1 |
Previous gene array studies have identified a number of genes, including T-Plastin, STAT4, and integrin β1, that may be differentially expressed in CTCL1-4. Despite some overlap among these studies’ findings, no single gene differentially expressed in all CTCL tumor studies has been identified. It may be the case, for instance, that elucidated genetic abnormalities represent the “downstream” dysregulation of various genes, while the inciting “upstream” events may still be unknown. At the very least, the published data suggest that CTCL pathogenesis and maintenance are multifactorial and complex. In the context of this intricate milieu, the analysis of gene classes is of utmost importance, providing important insights into a multifaceted disease process.
To better classify and contextualize our differentially expressed genes, we next performed gene ontology analysis8. This process mines input data for statistically significant over- or under-expression of gene classes, providing insight into domains of cellular function that may be of great import in a particular disease. Our analysis showed two affected ontological classes, regulation of gene expression and response to virus (Fig. 1), indicating that perturbations in these areas of cellular operation may be important to CTCL pathogenesis.
Fig 1.
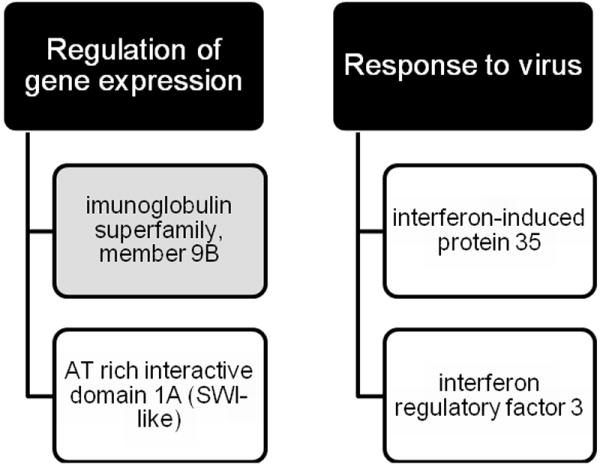
Gene ontology category analysis. Two affected ontological classes are shown in black. Overexpressed (gray) and underexpressed (white) genes belonging to each class are shown.
Using our differentially expressed gene list, we also performed a pathway analysis to evaluate clusters of functionally related genes (Table 2). We found two pathways to be significantly affected (p<0.05) in malignant cells, leukocyte transendothelial migration and cellular adhesion pathways, both well known to be important in cancer pathogenesis.
Table 2.
Impacted pathways, shown in order of decreasing impact factor and increasing p-value
| Pathway | Impact Factor | p-value | Differentially expressed gene(s) in pathway | Gene symbol (s) |
|---|---|---|---|---|
| Leukocyte transendothelial migration | 3.889 | 0.020 | Integrin, beta 1; | ITGB1; |
| Rap guanine nucleotide exchange factor 3 | RAPGEF3 | |||
| Cell adhesion molecules (CAMs) | 3.716 | 0.024 | CD6 antigen; | CD6; |
| Integrin, beta 1 | ITGB1 | |||
| SNARE interactions in vesicular transport | 2.687 | 0.068 | Vesicle-associated membrane protein 8 | VAMP8 |
| Pathogenic Escherichia coli infection | 2.43 | 0.088 | Integrin, beta 1 | ITGB1 |
| Acute promyelocytic leukemia (M3) | 2.247 | 0.106 | Zinc finger and BTB domain containing 16 (promyelocytic leukemia zinc finger protein) | ZBTB16 (PLZF) |
| Ribosome | 2.095 | 0.123 | Ribosomal protein S2 | RPS2 |
| Long-term potentiation | 2.067 | 0.127 | Rap guanine nucleotide exchange factor 3 | RAPGEF3 |
Confirmatory studies are necessary to determine the role of these differentially expressed genes in CTCL pathogenesis. Nevertheless, this pilot study suggests the feasibility of this novel approach to genomic profiling in SS, in which malignant T cells are compared to control T cells from the same SS patient. This study will hopefully stimulate further work applying this experimental design to genomic profiling in SS.
Acknowledgments
Microarray data were generated by the Genomics Core Laboratory, University of Pittsburgh, and statistical analyses were performed by the GPCL-Bioinformatics Analysis Core (GPCL-BAC), University of Pittsburgh. We thank Dr. James Lyons-Weiler and Haiwen Shi (BAC) for their valuable assistance.
Funding sources: National Institutes of Health, Dermatology Foundation, University of Pittsburgh Clinical & Translational Research Centre
Footnotes
Conflict of interest disclosures: None
References
- 1.Booken N, Gratchev A, Utikal J, et al. Sezary syndrome is a unique cutaneous T-cell lymphoma as identified by an expanded gene signature including diagnostic marker molecules CDO1 and DNM3. Leukemia. 2008;22:393–9. doi: 10.1038/sj.leu.2405044. [DOI] [PubMed] [Google Scholar]
- 2.Hahtola S, Tuomela S, Elo L, et al. Th1 response and cytotoxicity genes are down-regulated in cutaneous T-cell lymphoma. Clin Cancer Res. 2006;12:4812–21. doi: 10.1158/1078-0432.CCR-06-0532. [DOI] [PubMed] [Google Scholar]
- 3.Kari L, Loboda A, Nebozhyn M, et al. Classification and prediction of survival in patients with the leukemic phase of cutaneous T cell lymphoma. J Exp Med. 2003;197:1477–88. doi: 10.1084/jem.20021726. [DOI] [PMC free article] [PubMed] [Google Scholar]
- 4.van Doorn R, Dijkman R, Vermeer MH, et al. Aberrant expression of the tyrosine kinase receptor EphA4 and the transcription factor twist in Sezary syndrome identified by gene expression analysis. Cancer Res. 2004;64:5578–86. doi: 10.1158/0008-5472.CAN-04-1253. [DOI] [PubMed] [Google Scholar]
- 5.Jordan R, Patel S, Hu H, Lyons-Weiler J. Efficiency analysis of competing tests for finding differentially expressed genes in lung adenocarcinoma. Cancer Inform. 2008;6:389–421. doi: 10.4137/cin.s791. [DOI] [PMC free article] [PubMed] [Google Scholar]
- 6.Patel S, Lyons-Weiler J. caGEDA: a web application for the integrated analysis of global gene expression patterns in cancer. Appl Bioinformatics. 2004;3:49–62. doi: 10.2165/00822942-200403010-00007. [DOI] [PubMed] [Google Scholar]
- 7.Draghici S, Khatri P, Tarca AL, et al. A systems biology approach for pathway level analysis. Genome Res. 2007;17:1537–45. doi: 10.1101/gr.6202607. [DOI] [PMC free article] [PubMed] [Google Scholar]
- 8.Zhang B, Schmoyer D, Kirov S, Snoddy J. GOTree Machine (GOTM): a web-based platform for interpreting sets of interesting genes using Gene Ontology hierarchies. BMC Bioinformatics. 2004;5:16. doi: 10.1186/1471-2105-5-16. [DOI] [PMC free article] [PubMed] [Google Scholar]
- 9.Dummer R, Nestle FO, Niederer E, et al. Genotypic, phenotypic and functional analysis of CD4+CD7+ and CD4+CD7- T lymphocyte subsets in Sezary syndrome. Arch Dermatol Res. 1999;291:307–11. doi: 10.1007/s004030050414. [DOI] [PubMed] [Google Scholar]