Abstract
PURPOSE
To assess the histopathological changes in a postmortem sample derived from an eye donor with Macular Telangiectasia Type 2 (MacTel type 2) to gain further insight into the cause of the disease.
DESIGN
Clinicopathological case report
PARTICIPANTS
Postmortem tissue was collected from 5 different donors: one MacTel type 2 patient, one healthy control, two type 2 diabetic patients; one with retinopathy and one without retinopathy, and one patient with unilateral Coat’s disease.
METHODS
Macular pigment distribution in the posterior part of freshly dissected eyes was documented by macro photography. Paraffin sections from both the macular and peripheral regions were assessed using antigen retrieval and immunohistochemistry to study the distribution of cell-specific markers. Blood vessels were visualized with antibodies directed against collagen IV and claudin5, glial cells with antibodies against glial fibrillary acidic protein (GFAP), vimentin, glutamine synthetase (GS) and retinaldehyde binding protein (RLBP1, also known as CRALBP), microglia with an antibody against allograft inflammatory factor 1 (AIF1, also known as Iba1) and photoreceptors with antibodies against rhodopsin and opsin. Using anatomical landmarks the sections were then matched with the macular pigment distribution and a fluorescein angiogram of the patient that was taken before the patient’s death.
MAIN OUTCOME MEASURES
Presence and distribution of macular pigment and cell-specific markers.
RESULTS
Macular pigment was absent in the macula. Furthermore, abnormally dilated capillaries were identified in a macular region that correlated spatially with regions of fluorescein leakage in an angiogram that was taken 12 years prior to death. These telangiectatic vessels displayed a marked reduction of the basement membrane component collagen IV, indicating vascular pathology. GFAP was limited to retinal astrocytes and no reactive Müller cells were identified. Importantly, reduced immunoreactivity with Müller cell markers (vimentin, GS and RLBP1) in the macula was observed. The area that lacked Müller cells corresponded with the region of depleted macular pigment.
CONCLUSIONS
These findings suggest that macular Müller cell loss or dysfunction is a critical component of MacTel type 2, which may have implications for future treatment strategies.
INTRODUCTION
Macular telangiectasia (MacTel), also known as idiopathic juxtafoveolar telangiectasia, is an uncommon ocular disease that can lead to legal blindness. Two major types of the disease are distinguished. Type 1 is unilateral and accompanied by pronounced exudation and edema, whereas type 2 is bilateral and is associated with minimal macular edema despite hyperfluorescence on retinal fluorescein angiography. MacTel type 2 is also characterized by loss of macular transparency, superficial white crystals, depletion of macular pigment and progressive foveal thinning.1–5 More advanced cases may develop pigment clumping and less commonly, subretinal neovascularization leading to severe visual loss.2 The cause of MacTel type 2 is not known, and no treatment exists to prevent the progressive loss of central vision that is often seen in this disease.
Most of existing knowledge about MacTel type 2 pathobiology is based upon observations on living patients; there is only one published clinico-pathological study of a confirmed MacTel type 2 case. In this case a 58 year old female with no ophthalmic complaints was found to have MacTel type 2 on routine examination before undergoing maxillectomy and orbital exenteration for squamous cell carcinoma of her left eye.6 Light microscopic examination revealed retinal thickening in the inner retinal layers of the macular area with edematous and cystic changes present in the outer plexiform layer (OPL) that extended into the outer nuclear layer (ONL). Ultrastructural analysis of blood vessels in the clinically affected perifoveal zone revealed damaged capillaries with an almost total lack of pericytes and occasional endothelial cell disruption. Furthermore, occasional loss of pericytes and multi-laminar capillary basement membrane with lipid inclusions and debris containing vacuoles was observed throughout the retina. The authors noted that these features were similar in many respects to those of diabetic retinopathy. A second case study of presumed MacTel type 2 has been carried out on a postmortem specimen from a 36-year-old woman with Down Syndrome. However, this case was not clinically diagnosed as MacTel type 2. The authors described macular edema and telangiectatic vessels with partial degeneration of endothelium and pericytes.7 Neither of these two cases attempted to identify individual cell types in the retina.
In order to learn more about the pathobiology of this disease, one definitive case of MacTel type 2 was identified in an eye repository managed by Gregory S Hageman. The diagnosis was made by an established retinal specialist, supported by fluorescein angiography photographs, and confirmed by the retinal consultant involved with the analysis of this eye. Here we report the immunohistochemical findings from this eye.
MATERIALS and METHODS
Donors and tissue processing
Institutional Review Board (IRB)/Ethics Committee approval was obtained. The time elapsed between death and fixation of the MacTel type 2 specimen employed in this study was 4 hours 12 minutes. The right eye was fixed and stored in 4% paraformaldehyde. The left eye was frozen unfixed and used for biochemical analysis (not shown). After removal of the anterior parts the eyes were flattened (using four radial incisions) and photographed.
Control eyes for the macroscopic appearance and macular pigment distribution were provided by an anonymous 67 year old donor (cause of death: lung cancer, 2008, no reported ophthalmic pathology) and a 75 year old donor with a diagnosis of unilateral Coat’s disease in the left eye (based on fluorescein angiogram and the presence of microaneurysms in the left macula, not shown). Control eyes for immunohistochemistry were obtained from the right eye from a 79 year old male donor (cause of death: lung cancer, 2007) with no reported ophthalmic problems, retrieved and fixed in 2% paraformaldehyde 13 hours after death. A further control eye from a 78 year old type 2 diabetic patient without diabetic retinopathy (cause of death: stroke, 2008) was fixed 9 hours after death in 2% paraformaldehyde. An additional control eye from a 71 year donor (cause of death: cerebrovascular accident, 2007) with a history of diabetic retinopathy, laser surgery and intraocular lens replacement was fixed under 12 hours after death in 2% paraformaldehyde. To test effects of postmortem fixation delays both eyes from a 63 year old male donor (cause of death: prostate cancer, 2008, no reported ophthalmic pathology) were used. The right eye was fixed 8 hours post mortem and the left eye was kept at room temperature for 48 hours before fixation.
A region that included the optic disc, fovea and a section of nasal periphery was dissected from the eye cups and placed into running water for 24 hours before paraffin wax embedding. The fixed tissue was dehydrated through graded alcohols and embedded in paraffin wax. Naso-temporal sections were cut at 6 µm and mounted onto Superfrost® plus slides (VWR). Sections were then deparaffinized with xylene and rehydrated through graded alcohols and processed for hematoxylin and eosin (H&E) staining or immunohistochemistry.
Antigen retrieval
Due to the long lag periods in fixative and the wax embedding of the tissue, antigen retrieval methods were employed for immunohistochemical analysis. Each antibody required slightly different retrieval conditions. For employment of antibodies directed against GS, RLBP1 and collagen IV, slides were heated to a minimum of 125°C in 90% glycerol (molecular grade) and 10% 0.1M citrate buffer pH6.0 in for 20 minutes. Claudin-5 immunostaining required 129°C for 15 minutes, whereas GFAP, vimentin, ML-opsin and rhodopsin immunostaining required heating to a minimum of 120°C for 15 minutes in the same buffer. Iba1 immunostaining required heating to 128°C for 10 minutes in 10% 0.1M Tris ethylenediaminetetraacetate (EDTA) buffer (10mM Tris-Base, 1mM EDTA, 0.05% Tween20) pH9.0 in Glycerol.
Immunohistochemistry
Following antigen retrieval, sections were briefly washed in water, incubated for 1 hour at room temperature in blocking buffer (1% BSA, 0.5% triton X-100 in PBS) and then in primary antibody (diluted 1:200 in blocking buffer) either at room temperature for 1 hour or overnight at 4°C. Sections were washed in washing buffer (0.1% tween20 in PBS) and incubated for 1 hour at room temperature in secondary antibodies (Invitrogen, diluted 1:200 in blocking buffer). Subsequently sections were washed in washing buffer, treated with Hoechst (10µg/ml in washing buffer) for 30 seconds, washed again and mounted in Citifluor mounting medium (Agar Scientific). Images were taken using a Leica DM IRB fluorescent microscope and/or a Zeiss LSM510 UV confocal microscope.
Primary Antibodies
Primary antibodies used were: claudin-5 (Invitrogen, 35–2500), collagen IV (AbD Serotec 2150-0140), Iba1 (Biocare Medical, CP290A), GFAP-Cy3 (Sigma, C9205), vimentin-Cy3 (Sigma, C9080), RLBP1 (AffinityBioReagents, MA1-813), GS (Chemicon, MAB302), rhodopsin (Chemicon, MAB5356) and ML-opsin (Millipore, AB5405).
Nuclei counting
H&E stained sections were used to count cell nuclei in the inner nuclear layer. Three sections through the macula, superior to the fovea (sections 140, 143 and 150) from the MacTel type 2 specimen were counted. As a control four sections through a similar region of the macula (superior, perifoveal) from an age matched control donor were analyzed. The distance between the fovea and optic disc edge was measured and split into 20 equal sized segments. The inner nuclear layer nuclei were counted in 15 segments temporal to the fovea and in 15 segments nasal to, and including the fovea. The values from the MacTel sections and the control sections were averaged and the most nasal point was used for normalization to 100%.Statistical analysis was carried out by Student’s t-test.
RESULTS
Clinical features
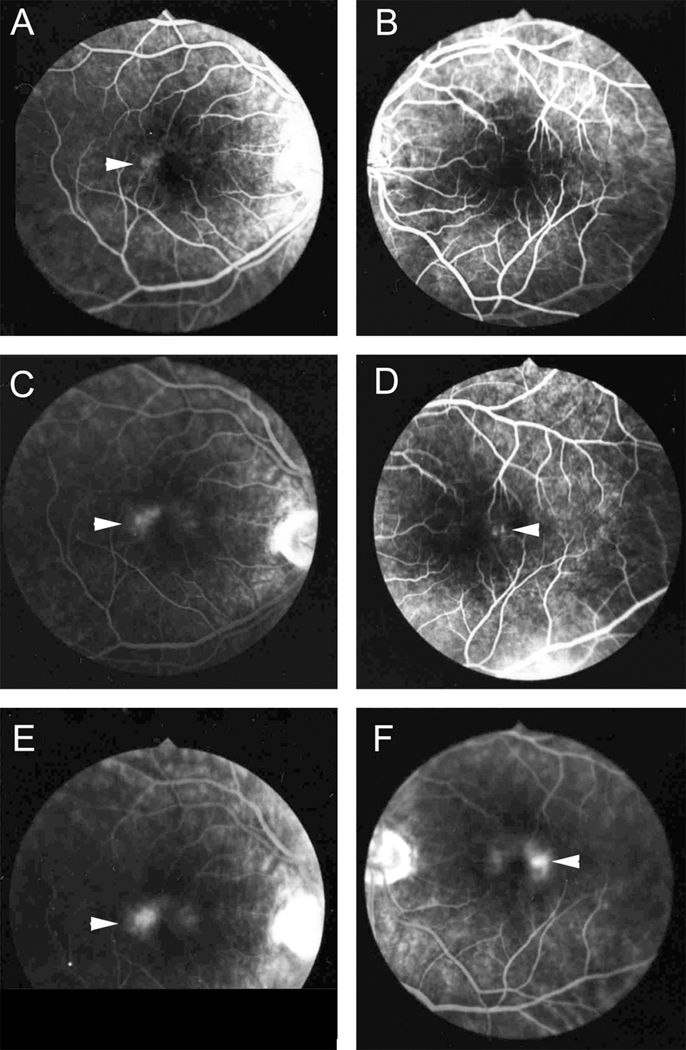
The 65 year old male donor, who died in 1999 from a cerebrovascular accident, had a history of type 2 diabetes, hyperlipidemia and hyperthyroidism. He had a family history of age-related macular degeneration however, no features of diabetic retinopathy (DR) or macular degeneration were described in the ophthalmologist’s notes, nor were there any features of DR evident in the available color photographs and fluorescein angiograms, or evidence upon gross examination. The donor was diagnosed with MacTel type 2 by a retinal specialist in 1987. An angiogram available from that time shows typical features of MacTel type 2 (Fig. 1). Telangiectatic vessels were observed in the temporal perifoveal area early in the angiogram with more widespread diffuse staining of the entire perifoveal area in later images. Crystalline deposits2 (often but not always present in MacTel type 2) were not noted in clinical notes or images from the patient’s file. Visual acuity was 20/25 OD, 20/40 OS. These readings were unchanged at the last recorded clinic visit, which was 10 years before his death.
Figure 1.
Angiogram of the right (A, C, E) and left eye (B, D, F) showing fluorescein leakage in the perifovea (arrowheads). The leakage is particularly prominent temporal to the fovea, which is characteristic for MacTel type 2.
Macroscopic appearance of the retina
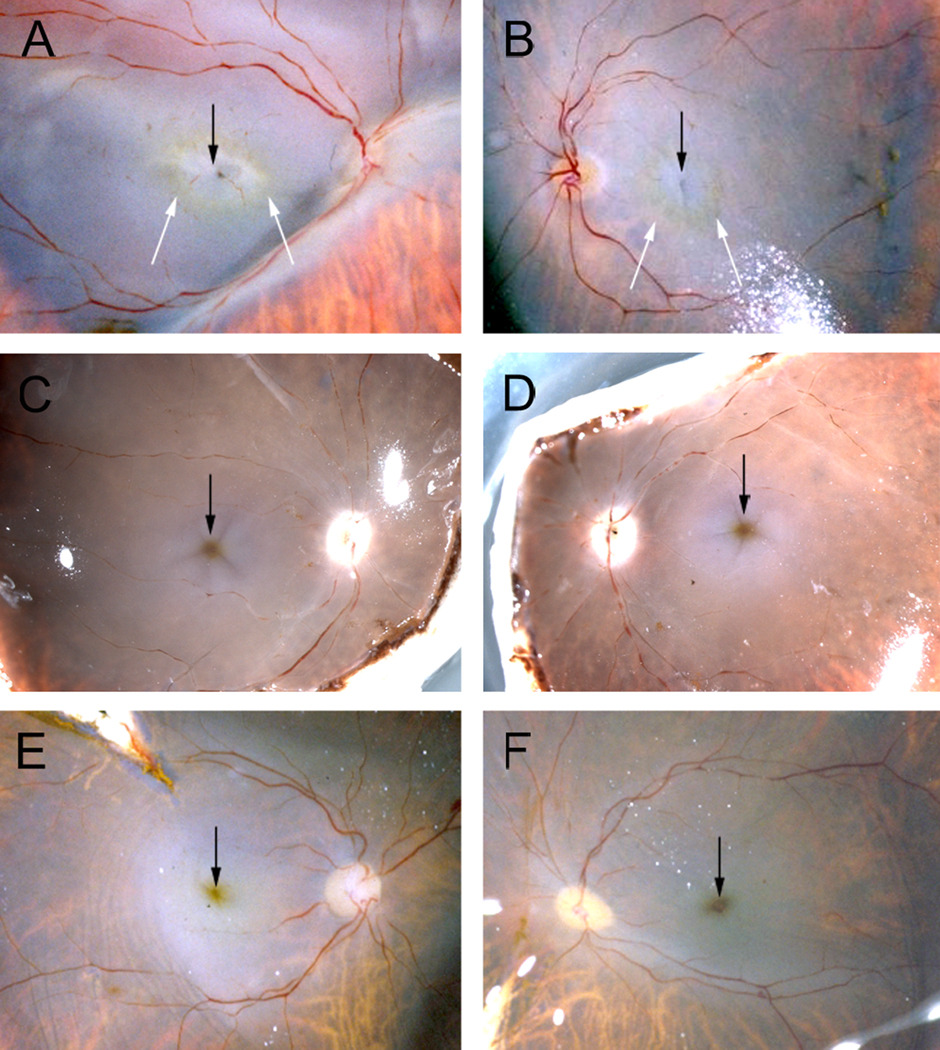
Photographs taken of the freshly dissected postmortem eye revealed loss of macular pigment in the MacTel type 2 retina (Fig. 2 A, B). Rings of remaining macular pigment (white arrows in Fig. 2 A, B) appeared sharply delineated towards the center of the macula and diffuse towards the periphery. On the other hand, in control retinas from an anonymous donor with no reported ophthalmic pathology the macular pigment appeared as a yellow/brownish dot in the center of the macula (Fig. 2 C, D). Similarly, the macular pigment in a patient with Coat’s disease in the left eye appeared normal in both eyes (Fig. 2 E, F). Depletion of macular pigment (with the most pronounced alterations in the temporal perifoveolar region) has recently been described to be a specific and early clinical feature of MacTel type 2.1;4;8 Our observation further confirms the nature of the changes to macular pigment distribution in MacTel type 2, and in combination with the fluorescein angiogram identify our MacTel sample as a definite case of MacTel type 2.
Figure 2.
Photographs of dissected eye globes from three different donors before fixation showing the distribution of macular pigment. In the MacTel type 2 patient (A, B) macular pigment is absent from the center of the macula (black arrows) but faintly visible as a perifoveolar ring (white arrows). In contrast, in the two control donors (C–F) the highest concentration of macular pigment is found in the fovea (black arrows).
Retinal vasculature
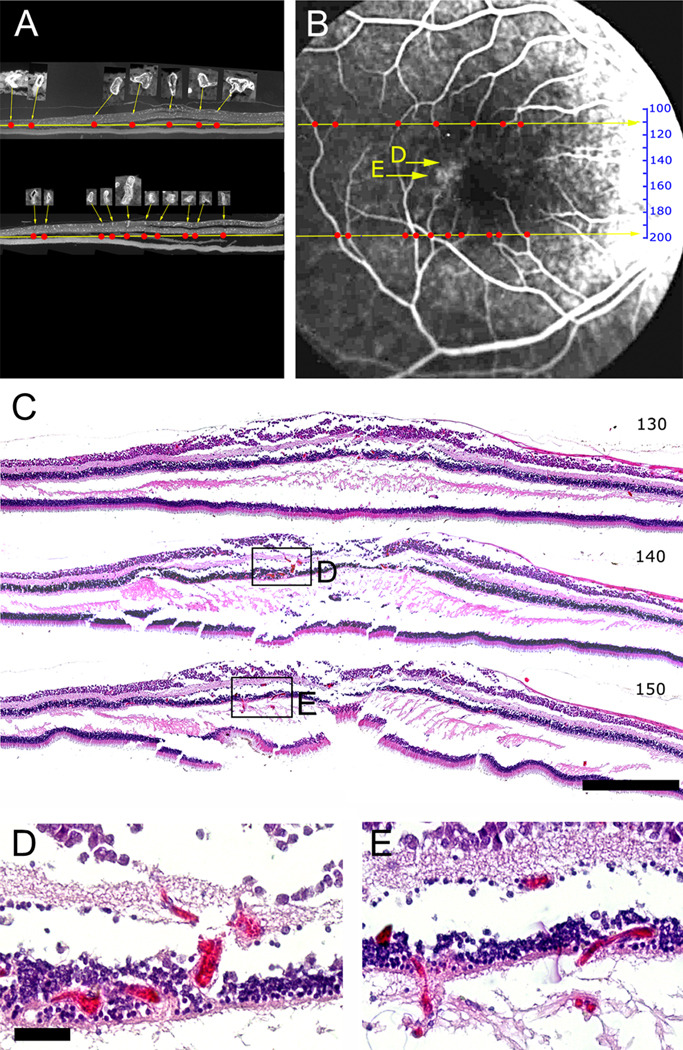
Since perifoveal vascular telangiectasis is also a defining clinical characteristic of MacTel type 2 we sought to study the abnormal vessels seen in the angiogram (arrowheads in Fig. 1) more closely by examining wax sections that had been serially cut from the right eye. To this end some of the sections were stained with an antibody directed against collagen IV to reveal vascular profiles (Fig. 3 A). The naso-temporal position of all major vessels (insets in Fig. 3 A) was mapped in the sections (red dots in Fig. 3 A) and then matched with the angiogram (Fig. 3 B). The specific distribution of main vessels in the naso-temporal axis allowed us to identify the approximate position in the superior-inferior axis of each wax section on the angiogram (numbered scale in Fig. 3 B).
Figure 3.
Mapping of wax sections onto the angiogram. Two sections (110, superior, and 198, inferior to the macula) stained against collagen IV show the distribution of vessels (A). Larger vessels were identified (insets in A) and plotted as red dots in the naso-temporal axis. The distribution of red dots was used to define the superior-inferior position of the two sections and to position a scale that gives the approximate position of every section in the angiogram (B). Hematoxylin & eosin stains of three sections (C, section 130, 140 and 150) shows that vascular abnormalities (visible at higher magnification in D, E) match well to fluorescein leakage visible in the angiogram (yellow arrows in B). Scale bar is in C 500µm and in D 50µm.
H&E staining of some of the sections revealed blood-filled, abnormally dilated vessels in the deeper plexus of the retinal vasculature (sections 140 and 150; Fig. 3 C–E). These abnormal vessels were limited to the clinically affected, perifoveal region and particularly pronounced temporal to the fovea, but were not present in the periphery. Furthermore, they were limited to the deeper plexus whilst vessels in the retinal ganglion cell layer were of normal diameter throughout the retina. The specimen showed a tendency to splitting in the horizontal plane throughout the macular region. Whether this is a tissue processing artifact or due to structural changes inherent in the condition is not clear, although this is unlikely as the eye was immersion fixed and the more peripheral regions are well-preserved.
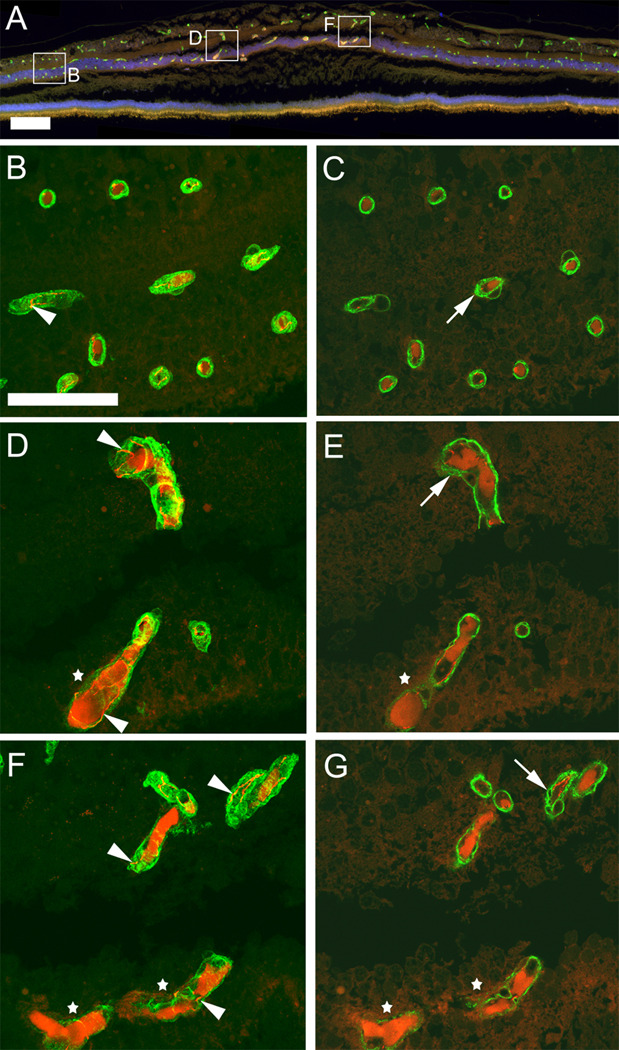
In order to characterize the telangiectatic, perifoveal vessels further we used immunohistochemistry to visualize collagen IV, marking vascular basement membrane, and claudin-5, marking tight junctions between retinal endothelial cells (Fig. 4 A–G). Claudin-5 immunoreactivity was visible in all vessels (arrowheads Fig. 4 B, D, F), despite uniform, strong autofluorescence in the lumen of many vessels. The claudin-5 staining indicates the presence of endothelial cells in normal appearing vessels as well as in telangiectatic vessels (stars in Fig. 4 D, F). However, telangiectatic vessels appeared to have reduced collagen IV staining in comparison to normal vessels within the same specimen in the unaffected peripheral retina (Fig. 4 D–G). This reduction in the basal lamina component collagen IV was only seen in deeper plexus vessels in the perifovea. However, other abnormalities were also noted. Small vacuoles within vascular basal lamina were noted in single confocal slices (arrows Fig. 4 E, G) in most macular vessels but also to some degree in the periphery (Fig. 4 C).
Figure 4.
Immunohistochemistry with antibodies against collagen IV (green) and claudin-5 (red) labels retinal blood vessels (section 133) of MacTel type 2 retina. A non-specific luminal stain is also visible in the red channel and is prominent in telangiectatic, deeper plexus vessels. This is particularly obvious in the overview micrograph (A) as an orange stain. However, confocal microscopy through the entire thickness of the wax section (B, D, F) from selected regions shows that claudin-5 staining can be clearly distinguished as a junctional stain (arrowheads in B, D, F). Single confocal slices (C, E, G) reveal fine vacuoles (arrows C, E, G) in vascular basal lamina throughout the retina. In telangiectatic vessels collagen IV staining appears diffuse and interrupted (white stars in D–G). Temporal is to the left and nasal to the right. Scale bar is in A 200µm and in B 50µm.
Microglia
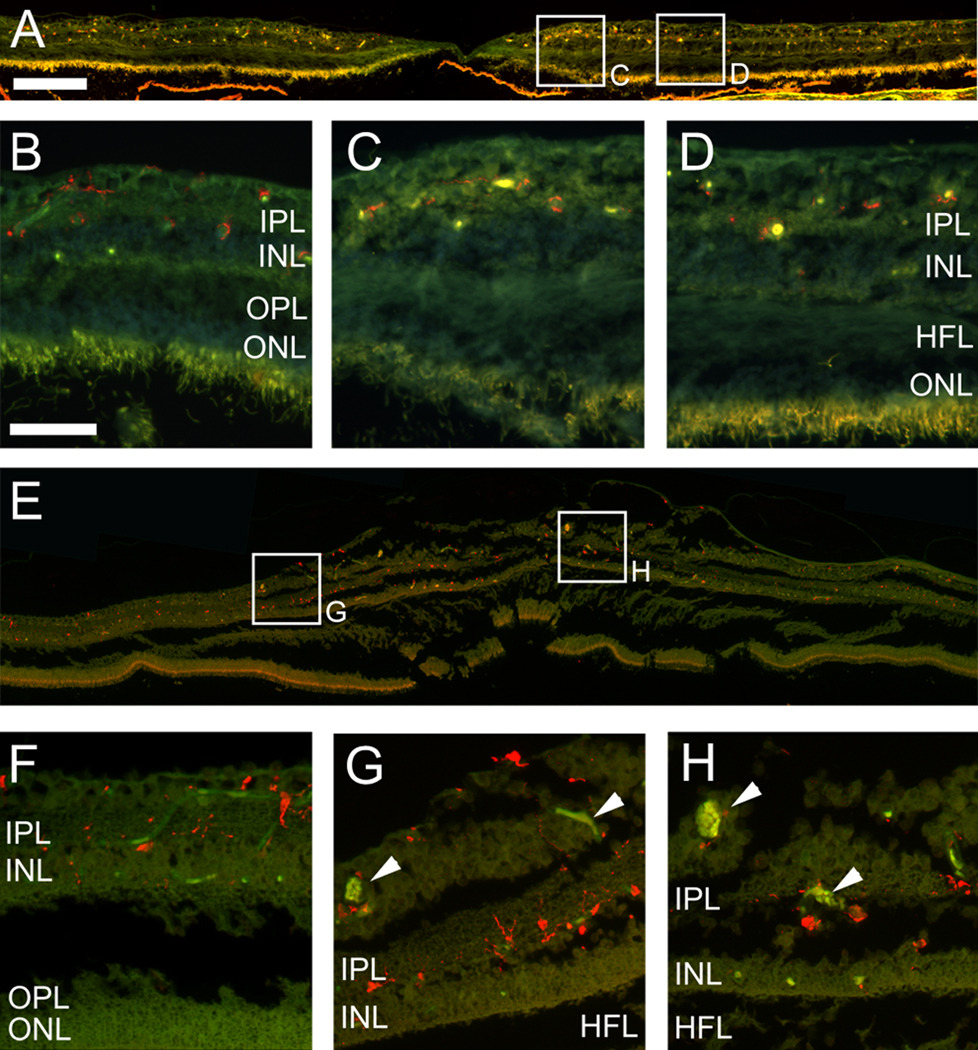
In order to assess whether an inflammatory component may contribute to the vascular abnormalities characteristic of the MacTel type 2 retina, we used the microglia marker Iba1 9 (Fig.5 A–H). In a control retina from a healthy donor Iba1-positive microglia were found in the retinal ganglion cell layer (RGC), the inner plexiform layer (IPL) and the inner nuclear layer (INL, Fig. 5 A–D). Microglia were often associated with blood vessels, consistent with previous studies.10;11 The distribution of Iba1-positive microglia in the MacTel type 2 retina was similar to the control and no obvious changes in microglia number or morphology were noted. Even around abnormal vessels (arrowheads Fig. 5 G, H) the density and morphology of macrophages appeared normal.
Figure 5.
Immunohistochemistry with the Iba1 antibody (red) labeling macrophages in the control (A–D) and the MacTel type 2 eye (E–H, section 153). Macrophages are distributed in both samples throughout the RGC layer, IPL and INL in the periphery (B, F) and the macula (C, D, G, H). They tend to be associated with blood vessels (visible as green/yellow autofluorescence), telangiectatic vessels indicated with arrowheads in G, H. RGC; retinal ganglion cell, IPL; inner plexiform layer, INL; inner nuclear layer, HFL; Henle’s fiber layer, OPL; outer plexiform layer, ONL; outer nuclear layer. Temporal is to the left and nasal to the right. Scale bar is in A 200µm and in D 50µm.
Glia
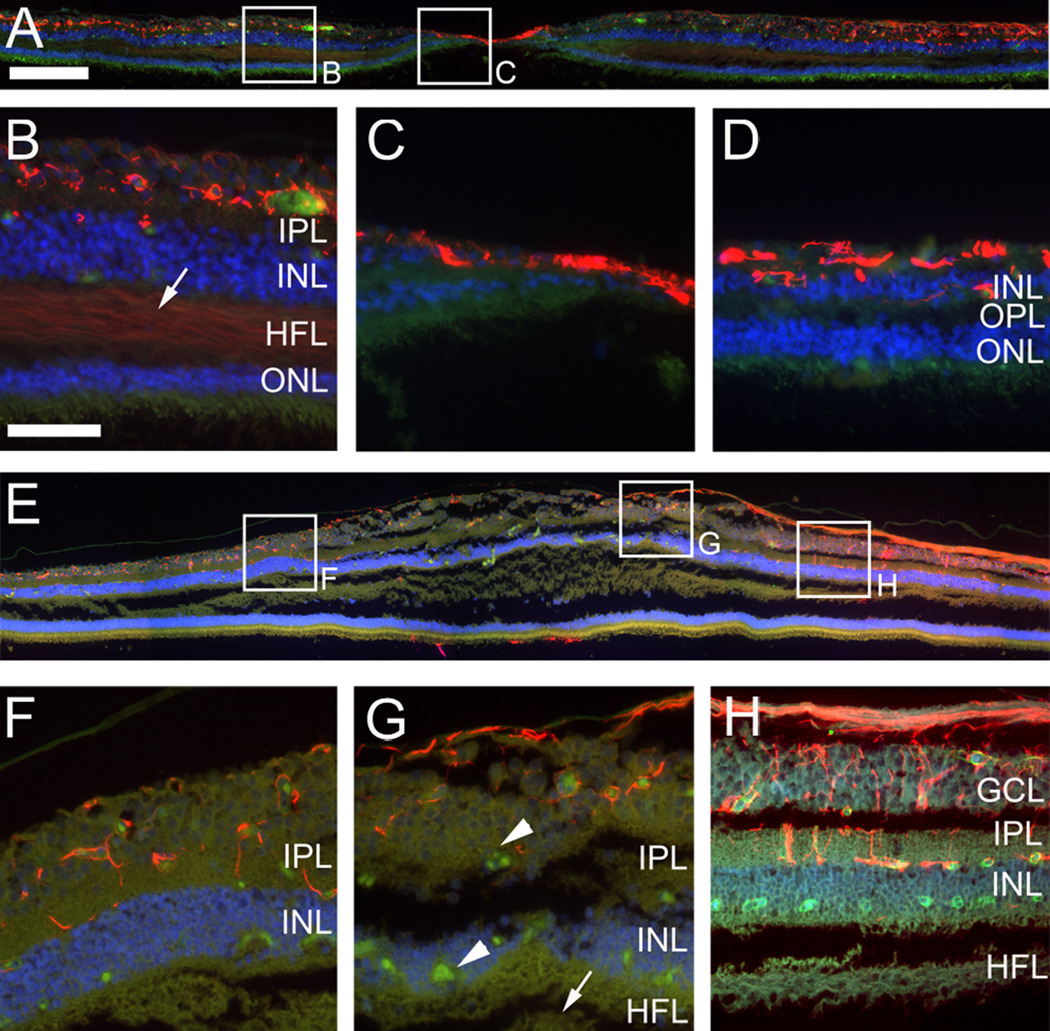
An antibody directed against glial fibrillary acidic protein (GFAP) was used to visualize retinal astrocytes. In the healthy control eye (Fig. 6 A–D) retinal astrocytes were found in their expected distribution in the nerve fiber layer, the RGC layer and in the inner plexiform layer. The strong GFAP-positive signal visible in the fovea (Fig. 6 C) is likely to be a manifestation of the so-called Müller cell cone 12 and not retinal astrocytes as they are normally excluded from the fovea.13 In the nasal retina the inner plexiform layer exhibited particularly pronounced astrocyte staining with prominent perpendicular processes into the retina (Fig. 6 D). These processes did not appear to be from Müller cells since they only extended to the boundary between the IPL and the INL. In the MacTel type 2 retina (Fig. 6 E–H) retinal astrocytes seemed to be distributed in a similar fashion as in the control specimen. They were associated with nerve fibers and blood vessels in the RGC layer and the IPL. There was no Müller cell cone but this may have been because the section examined did not contain the fovea.
Figure 6.
Immunohistochemistry with an antibody directed against glial fibrillary acidic protein (GFAP) (red). GFAP immunostaining labels retinal astrocytes in a control retina (A–D) and the MacTel type 2 specimen (E–H, section 134). Strong GFAP labeling in the fovea of the control eye (A, C) might indicate the “Müller cell cone”. There is also weak labeling in Henle’s fiber layer (arrow B). Retinal astrocytes are associated with blood vessels and nerve fibers in both samples and appear in similar distribution and density. Blood vessels are visible as green/yellow autofluorescence (telangiectatic vessels; arrowheads G). No GFAP labeling is visible in Henle’s fiber layer of the MacTel eye (arrow G). GCL; ganglion cell layer, IPL; inner plexiform layer, INL; inner nuclear layer, HFL; Henle’s fiber layer, OPL; outer plexiform layer, ONL; outer nuclear layer. Temporal is to the left and nasal to the right. Scale bar is in A 200µm and in D 50µm.
Müller cells normally express GFAP only at very low levels and in healthy retina they are barely detectable by immunohistochemistry. Nevertheless we found a very faint stain in Henle’s fiber layer (arrow Fig. 6 B). However, GFAP is known to be strongly upregulated by reactive Müller cells and is therefore a popular marker to detect certain retinal pathologies.14;15 Remarkably, no evidence of reactive Müller cells was found in the MacTel type 2 retina (Fig. 6 E–H).
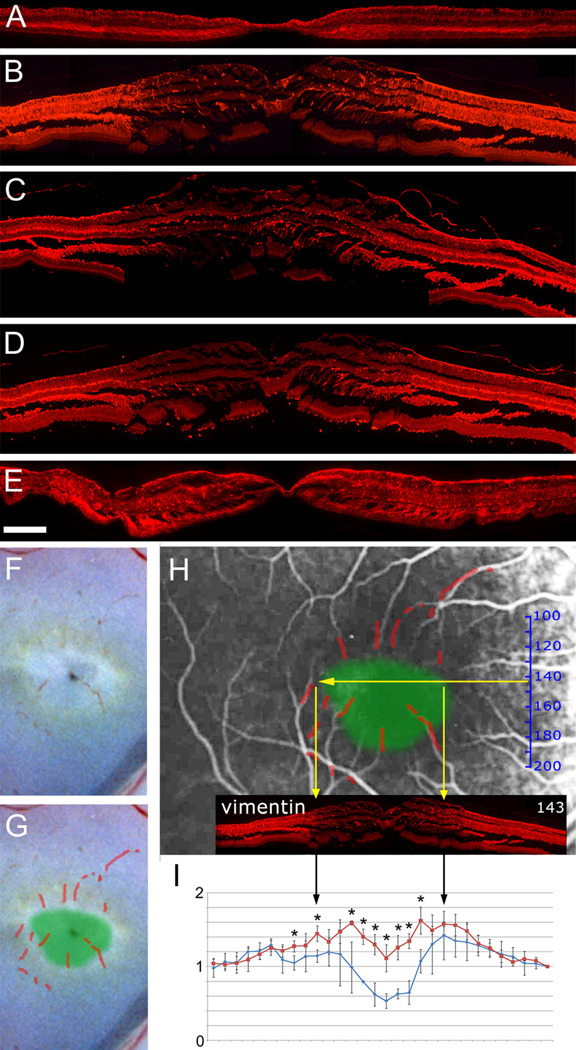
Müller cell distribution was then visualized with an antibody directed against vimentin (Fig. 7 A, B). In the control retina strong staining was visible throughout the macula and peripheral retina consistent with the expected distribution of Müller cells. However, in the MacTel type 2 specimen vimentin immunoreactivity was markedly reduced in the macula (Fig. 7 B). To confirm that this lack of staining represented a true loss of Müller cells (and not just downregulation of vimentin) we used two further Müller cell markers, glutamine synthetase (GS, Fig. 7 C) and retinaldehyde binding protein (RLBP1 also known as CRALBP, Fig. 7 D). A clearly demarcated area in the central macula exhibited reduced staining with both antibodies, suggesting Müller cell dropout in a specific macular region in the MacTel type 2 eye.
Figure 7.
Immunohistochemistry with antibodies directed against three different Müller cell markers (A–E). The distribution of vimentin (A, B) indicates the presence of Müller cells throughout the macula and periphery in the control eye (A) but a strong reduction in the macula of the MacTel eye (B). Similarly, glutamine synthetase, GS (C) and retinaldehyde binding protein 1, RLBP1 (D) are reduced in the MacTel macula. A 48 hour postmortem delay before fixation did not affect vimentin staining in the macula of a control eye (E). In order to compare the area of macular pigment depletion with the area of Müller cell depletion, blood residues were traced in the color photograph (F, G). The image was scaled to match vessels in the angiogram, which locates the approximate position of the area of pigment depletion (green area) in the angiogram (H). The vimentin immunostaining (B) was scaled and centered on the angiogram (based on the size relationship established in Fig. 3), which demonstrates a rough correlation between macular pigment and Müller cell depletion (yellow arrows in H). The relative frequency of cell nuclei in the inner nuclear layer (based on H&E stained, perifoveal sections) is plotted in I and shows a reduction in the perifoveal region in the MacTel specimen (blue) versus control (red). Stars in I indicate statistical significance with a p-value below 0.05. Temporal is to the left and nasal to the right. Scale bar in E is 200µm
It could be argued that the lack of Müller cell staining in the MacTel type 2 eye is artifactual and caused by degenerative, postmortem changes. Although the MacTel type 2 eye was enucleated and fixed 4 hours after death and showed normal Müller cell staining in the periphery it cannot be entirely excluded that the macula could be particularly sensitive to postmortem artifacts. In order to address this possibility, we kept an enucleated postmortem eye in an unfixed state for 48 hours at room temperature in phosphate buffered saline (PBS) before standard processing for immunohistochemistry was carried out. Müller cell staining was not affected in the macula of this eye (Fig. 7 E). Furthermore, because our MacTel type 2 donor had a history of type 2 diabetes, we also checked the distribution of the three Müller cell stains in two control eyes from type 2 diabetes patients, one with and one without diabetic retinopathy, and found normal distribution of Müller cells (data not shown).
Since the region with reduced Müller cell staining in the MacTel type 2 eye was clearly defined, we attempted to spatially correlate this area with the region of macular pigment loss, which is also clearly defined in MacTel type 2.1 We scaled and matched the color photograph (from Fig. 2 A) with the angiogram using small traces of blood in the macular region (Fig. 7 F–H), and then superimposed the area of macular pigment depletion onto the angiogram (green patch in Fig. 7 H). Since the approximate position and scale of each cross-section was already mapped within the angiogram we were able to show that the lack of Müller cell staining correlated with the area of macular pigment loss (Fig. 7 H).
In order to further test whether the disappearance of Müller cell markers represents a lack of cells in the macula, we used H&E stained sections to count the number of cell nuclei in the inner nuclear layer (Fig. 7 I). In a control retina we found a drop in the fovea and a slight increase of cell nuclei numbers either side of the fovea in the perifoveolar region. In the MacTel type 2 sample numbers were lower throughout the macula relative to the periphery, suggesting that cells - most likely Müller cells - were missing or reduced in number.
Photoreceptors and retinal pigment epithelium (RPE)
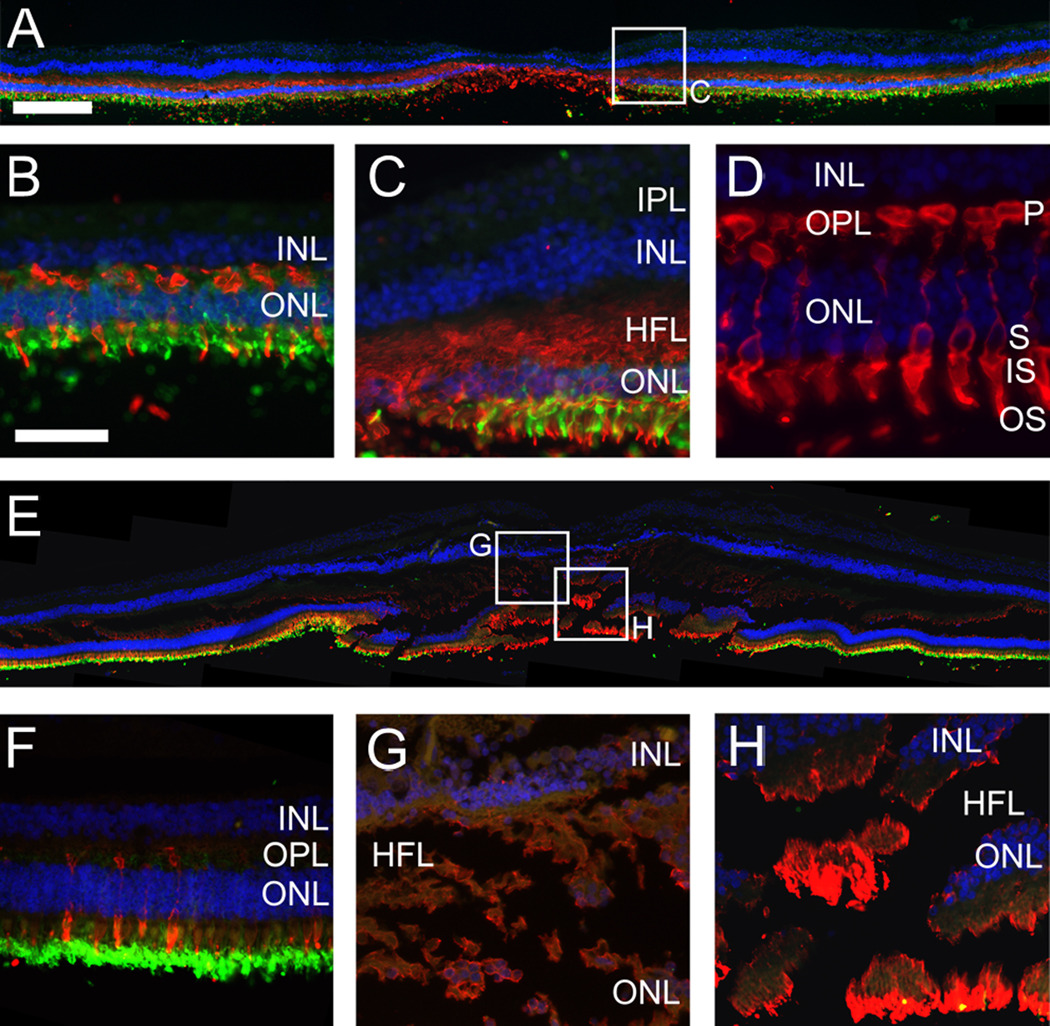
Since MacTel type 2 patients are known to suffer from reduced retinal sensitivity and visual acuity 16–18 we also studied photoreceptors in our MacTel type 2 specimen. As expected, in the control specimen rods (stained with anti-rhodopsin) were excluded from the fovea but clearly visible in the macula and throughout the periphery whereas cones were concentrated in the fovea (Fig. 8 A–D). The antibody used in this particular study (directed against ML-opsin) not only labels cone outer segments but the entire cells, including synaptic bodies and axonal connections in the OPL and Henle’s fiber layer (Fig. 8 C, D). In the MacTel type 2 eye the distribution of rods and cones was similar to the control eye. The presence of ML-opsin staining in Henle’s fiber layer was reduced but indicated the presence of at least some cone axons in the macula (Fig. 8 G, H). There was also strong ML-opsin present in the fovea (Fig. 8 H) but due to poor preservation of photoreceptors in all our samples it was not possible to ascertain whether there was a reduction of cone numbers in the MacTel type 2 fovea.
Figure 8.
Immunohistochemistry showing the distribution of ML-opsin (red) and rhodopsin (green) in the control (A–D) and the MacTel eye (E–H, section 143). In both samples rods (green) are reduced and cones (red) are increased in the fovea. In the control Henle’s fiber layer is stained by the ML-opsin antibody (C) and high magnification of the ML-opsin stain (D) confirms that this particular antibody stains the entire cone cell, including cone axons. ML-opsin stain in the MacTel Henle’s fiber layer (G, H) suggests the presence of cone axons but is weaker in comparison to the control (C). Nevertheless, strong ML-opsin stain is visible in the MacTel fovea (H). IPL; inner plexiform layer, INL; inner nuclear layer, HFL; Henle’s fiber layer, OPL; outer plexiform layer, ONL; outer nuclear layer. Photoreceptor structure: P; pedicle, S; soma, IS; inner segment, OS; outer segment. Temporal is to the left and nasal to the right. Scale bar is in A 200µm and in D 50µm.
The structural integrity and general appearance of the RPE (not shown) was checked in all sections studied from the MacTel type 2 specimen and, as observed in the previous two MacTel type 2 case studies 6;7, no obvious abnormalities were found.
DISCUSSION
Because the pathophysiology has not yet been identified for MacTel Type 2, diagnosis of the condition relies on gathering a pattern of patient signs and symptoms that may sometimes result in an equivocal diagnosis. Furthermore, lack of insight into the cause of the disease impedes the development of treatment strategies. Hence our study, though limited to one patient, is important in this field. We have extended the findings of the two previous clinicopathological reports of MacTel type 2 by performing immunohistochemical analysis on an eye derived from a clinically verified MacTel type 2 donor, thereby providing new information about the pathogenesis of this obscure condition. Our key finding was one of markedly reduced expression of Müller cell specific markers in the central macula, as compared to both the extra-macular regions of the same eye and the maculae of control eyes. By contrast, expression of other markers, such as rhodopsin, ML-opsin, collagen IV, GFAP and others was normal in the macular region of the affected eye. This suggests that the reduction of Müller cell markers does not represent general tissue degeneration or fixation artifacts within the macular region, but instead is a specific indication of Müller cell pathology. Furthermore, we have been careful to compare findings from macular and extra macular regions of the MacTel type 2 eye with controls from a healthy patient, a patient with type 2 diabetes and no retinopathy, a patient with diabetic retinopathy and a sample with a very long postmortem delay before fixation to try to ensure the specificity of changes to MacTel type2.
The apparent Müller cell loss we observed in the MacTel type 2 sample is consistent with the reduced numbers of cell nuclei we counted in the INL and the retinal thinning observed in living patients.19 In contrast, both previous MacTel type 2 histology case reports reported edematous thickening of the macula 6;7. Our MacTel type 2 sample was split and abnormally thickened, particularly in the macular region. This discrepancy between in vivo and histological observations might be explained by fixation or tissue processing artifacts. It is more likely that increases in retinal thickness in vivo are masked by the cellular loss in the MacTel type 2 macula.20
Müller cells interact very closely with retinal neuronal cells; for example, they recycle the toxic neurotransmitter glutamate to glutamine21 and they have neuroprotective functions via the release of antioxidants and neurotrophic factors.22 It is therefore plausible that Müller cell degeneration would be accompanied by loss of neurons in MacTel type 2 as was suggested by findings in patients examined with optical coherence tomography (OCT).3 This might also be linked to the progressive central macular thinning observed clinically in MacTel type 2 patients.19 Furthermore, cavities in the inner and outer retina described in OCT studies3;5;23 may also arise as a consequence of Müller cell death or dysfunction. For example, disturbed fluid transport in Müller cells24 and structural weaknesses might lead directly to cavities in the inner retina. Outer retinal cavities might be caused by Müller cell pathology indirectly since it has been shown in rodents that Müller cells provide trophic support for photoreceptors.25–27 Unfortunately, OCT recordings were not available from our MacTel type 2 donor and due to the marked laminar disarray of our specimen it was not possible to locate any cavities histologically in our specimen.
Gass drew attention to the “Müller cell cone”, a layer of Müller cells sitting above the layer of Henle immediately beneath the inner limiting membrane (ILM) in the base of the foveal depression, which he further postulated to be the major location for sequestration of macular pigment.12 Disease of the Müller cells in this case may explain the “ILM drape”, or cavities within the inner neural retina in this location that are commonly found in eyes with MacTel type 2 on optical coherence tomography,23;28;29 as well as the loss of macular pigment.1;4
In our MacTel type 2 sample macular pigment depletion was clearly visible macroscopically (Fig. 2) and correlated with the area of reduced Müller cell staining (Fig. 7). Recent evidence from a clinical study suggests that this represents a depletion, rather than a displacement of pigment from the macula.1 In healthy individuals macular pigment levels have previously been shown to be particularly high in the layer of Henle,30;31 which consists out of photoreceptor and Müller cell processes. Although, the precise role of Müller cells in lutein and zeaxanthin trafficking and storage is so far not understood, our data suggests that macular pigment depletion in MacTel type 2 may be linked to Müller cell pathology.
Müller cells do not comprise a cellular entity that can be visualized upon clinical examination, however the consequences of Müller cell loss and/or dysfunction might well be detectable in vivo. Since Müller cells are intimately related to the retinal vasculature, it is quite possible that their dysfunction would be associated with clinically visible telangiectasis. Müller cell processes are closely apposed to retinal blood vessels in the deeper plexus of retinal vasculature and are believed to contribute to induction of blood retina barrier integrity.32;33 Blood vessels in the RGC layer are thought to be supported more by retinal astrocytes.34 Thus, the observed limitation of vascular abnormalities to the deeper plexus of the retinal vasculature is consistent with a Müller cell dysfunction, supporting Gass’ suggestion that the primary abnormality may reside in the perifoveolar neuronal retina or Müller cells.35 Further research is warranted to study the effects of Müller cell disruption in animal models as we are still searching for the underlying pathogenesis of this enigmatic disease.
It is noticeable that our histological findings and the macroscopic appearance of the MacTel type 2 specimen correlated well with the angiogram, which was taken 12 years prior to the donor’s death. This suggests that the disease was slowly progressive in this patient, who had not developed late stage complications of MacTel type 2 such as neovascularization and retinal pigment invasion by the time of death.2 Abnormally dilated vessels in this patient were primarily found in the deeper plexus of the retinal vasculature, which is characteristic of the early stages of MacTel type 2. The presence of claudin-5 in these abnormal vessel segments implies the presence of at least some endothelial cells but should not be interpreted to reflect functional blood retina barrier.36 Green et al. noted normal zonula occludens in telangiectatic vessels but also occasional endothelial cell drop out,6 which could not be excluded in our specimen. Nevertheless, the dramatic reduction of collagen IV in telangiectatic vessels clearly indicates some form of vascular pathology which might be associated with pericyte dysfunction and subtly altered vascular permeability. Like Green et al., we also found subtle vascular changes in the retinal periphery such as small vacuoles in the vascular basal lamina (not shown). However, such changes may be common in eyes from elderly donors37 and are most likely not disease-specific.
MacTel type 2 is an uncommon disease and specimens from donors with confirmed disease are extremely rare. Consequently, as in all case studies, this analysis suffers from the limitation that our conclusions are based upon findings from a single donor at one point in time and further validation in additional specimens will be required. Nevertheless, our findings are consistent with the hypothesis that Müller cell dysfunction is a major contributor to the pathology in MacTel type 2 and might have implications for novel treatment strategies aimed specifically at Müller cells in the macula.
Acknowledgments
Financial Support: This study was supported by a grant from the Lowy Medical Research Institute, by a grant from Fight for Sight (UK), by an US NIH grant (R24 EY017404) and unrestricted grants to the University of Iowa and University of Utah.
Footnotes
Publisher's Disclaimer: This is a PDF file of an unedited manuscript that has been accepted for publication. As a service to our customers we are providing this early version of the manuscript. The manuscript will undergo copyediting, typesetting, and review of the resulting proof before it is published in its final citable form. Please note that during the production process errors may be discovered which could affect the content, and all legal disclaimers that apply to the journal pertain.
No authors have any financial/conflicting interests to disclose
REFERENCES
- 1.Charbel Issa P, van der Veen RL, Stijfs A, et al. Quantification of reduced macular pigment optical density in the central retina in macular telangiectasia type 2. Exp Eye Res. 2009;89:25–31. doi: 10.1016/j.exer.2009.02.006. [DOI] [PubMed] [Google Scholar]
- 2.Gass JD, Blodi BA. Idiopathic juxtafoveolar retinal telangiectasis: update of classification and follow-up study. Ophthalmology. 1993;100:1536–1546. [PubMed] [Google Scholar]
- 3.Gaudric A, Ducos de Lahitte G, Cohen SY, et al. Optical coherence tomography in group 2A idiopathic juxtafoveolar retinal telangiectasis. Arch Ophthalmol. 2006;124:1410–1419. doi: 10.1001/archopht.124.10.1410. [DOI] [PubMed] [Google Scholar]
- 4.Helb HM, Charbel Issa P, van der Veen RL, et al. Abnormal macular pigment distribution in type 2 idiopathic macular telangiectasia. Retina. 2008;28:808–816. doi: 10.1097/IAE.0b013e31816d81aa. [DOI] [PubMed] [Google Scholar]
- 5.Yannuzzi LA, Bardal AM, Freund KB, et al. Idiopathic macular telangiectasia. Arch Ophthalmol. 2006;124:450–460. doi: 10.1001/archopht.124.4.450. [DOI] [PubMed] [Google Scholar]
- 6.Green WR, Quigley HA, De la Cruz Z, Cohen B. Parafoveal retinal telangiectasis: light and electron microscopy studies. Trans Ophthalmol Soc U K. 1980;100:162–170. [PubMed] [Google Scholar]
- 7.Eliassi-Rad B, Green WR. Histopathologic study of presumed parafoveal telangiectasis. Retina. 1999;19:332–335. doi: 10.1097/00006982-199907000-00011. [DOI] [PubMed] [Google Scholar]
- 8.Charbel Issa P, Berendschot TT, Staurenghi G, et al. Confocal blue reflectance imaging in type 2 idiopathic macular telangiectasia. Invest Ophthalmol Vis Sci. 2008;49:1172–1177. doi: 10.1167/iovs.07-0636. [DOI] [PubMed] [Google Scholar]
- 9.Imai Y, Ibata I, Ito D, et al. A novel gene iba1 in the major histocompatibility complex class III region encoding an EF hand protein expressed in a monocytic lineage. Biochem Biophys Res Commun. 1996;224:855–862. doi: 10.1006/bbrc.1996.1112. [DOI] [PubMed] [Google Scholar]
- 10.Provis JM, Diaz CM, Penfold PL. Microglia in human retina: a heterogeneous population with distinct ontogenies. Perspect Dev Neurobiol. 1996;3:213–222. [PubMed] [Google Scholar]
- 11.Diaz-Araya CM, Provis JM, Penfold PL, Billson FA. Development of microglial topography in human retina. J Comp Neurol. 1995;363:53–68. doi: 10.1002/cne.903630106. [DOI] [PubMed] [Google Scholar]
- 12.Gass JD. Muller cell cone, an overlooked part of the anatomy of the fovea centralis: hypotheses concerning its role in the pathogenesis of macular hole and foveomacualr retinoschisis. Arch Ophthalmol. 1999;117:821–823. doi: 10.1001/archopht.117.6.821. [DOI] [PubMed] [Google Scholar]
- 13.Schnitzer J. Retinal astrocytes: their restriction to vascularized parts of the mammalian retina. Neurosci Lett. 1987;78:29–34. doi: 10.1016/0304-3940(87)90556-8. [DOI] [PubMed] [Google Scholar]
- 14.Mizutani M, Gerhardinger C, Lorenzi M. Muller cell changes in human diabetic retinopathy. Diabetes. 1998;47:445–449. doi: 10.2337/diabetes.47.3.445. [DOI] [PubMed] [Google Scholar]
- 15.Tuccari G, Trombetta C, Giardinelli MM, et al. Distribution of glial fibrillary acidic protein in normal and gliotic human retina. Basic Appl Histochem. 1986;30:425–432. [PubMed] [Google Scholar]
- 16.Charbel Issa P, Helb HM, Rohrschneider K, et al. Microperimetric assessment of patients with type 2 idiopathic macular telangiectasia. Invest Ophthalmol Vis Sci. 2007;48:3788–3795. doi: 10.1167/iovs.06-1272. [DOI] [PubMed] [Google Scholar]
- 17.Clemons TE, Gillies MC, Chew EY, et al. MacTel Research Group. The National Eye Institute Visual Function Questionnaire in the Macular Telangiectasia (MacTel) Project. Invest Ophthalmol Vis Sci. 2008;49:4340–4346. doi: 10.1167/iovs.08-1749. [DOI] [PMC free article] [PubMed] [Google Scholar]
- 18.Schmitz-Valckenberg S, Fan K, Nugent A, et al. Correlation of functional impairment and morphological alterations in patients with group 2A idiopathic juxtafoveal retinal telangiectasia. Arch Ophthalmol. 2008;126:330–335. doi: 10.1001/archopht.126.3.330. [DOI] [PubMed] [Google Scholar]
- 19.Charbel Issa P, Helb HM, Holz FG, Scholl HP MacTel Study Group. Correlation of macular function with retinal thickness in nonproliferative type 2 idiopathic macular telangiectasia. Am J Ophthalmol. 2008;145:169–175. doi: 10.1016/j.ajo.2007.08.028. [DOI] [PubMed] [Google Scholar]
- 20.Charbel Issa P, Finger RP, Holz FG, Scholl HP. Eighteen-month follow-up of intravitreal bevacizumab in type 2 idiopathic macular telangiectasia. Br J Ophthalmol. 2008;92:941–945. doi: 10.1136/bjo.2007.129627. [DOI] [PubMed] [Google Scholar]
- 21.Bringmann A, Pannicke T, Biedermann B, et al. Role of retinal glial cells in neurotransmitter uptake and metabolism. Neurochem Int. 2009;54:143–160. doi: 10.1016/j.neuint.2008.10.014. [DOI] [PubMed] [Google Scholar]
- 22.Bringmann A, Iandiev I, Pannicke T, et al. Cellular signaling and factors involved in Muller cell gliosis: neuroprotective and detrimental effects. Prog Retin Eye Res. 2009;28:423–451. doi: 10.1016/j.preteyeres.2009.07.001. [DOI] [PubMed] [Google Scholar]
- 23.Paunescu LA, Ko TH, Duker JS, et al. Idiopathic juxtafoveal retinal telangiectasis: new findings by ultrahigh-resolution optical coherence tomography. Ophthalmology. 2006;113:48–57. doi: 10.1016/j.ophtha.2005.08.016. [DOI] [PMC free article] [PubMed] [Google Scholar]
- 24.Reichenbach A, Wurm A, Pannicke T, et al. Muller cells as players in retinal degeneration and edema. Graefes Arch Clin Exp Ophthalmol. 2007;245:627–636. doi: 10.1007/s00417-006-0516-y. [DOI] [PubMed] [Google Scholar]
- 25.Wahlin KJ, Adler R, Zack DJ, Campochiaro PA. Neurotrophic signaling in normal and degenerating rodent retinas. Exp Eye Res. 2001;73:693–701. doi: 10.1006/exer.2001.1078. [DOI] [PubMed] [Google Scholar]
- 26.Harada T, Harada C, Kohsaka S, et al. Microglia-Muller glia cell interactions control neurotrophic factor production during light-induced retinal degeneration. J Neurosci. 2002;22:9228–9236. doi: 10.1523/JNEUROSCI.22-21-09228.2002. [DOI] [PMC free article] [PubMed] [Google Scholar]
- 27.Bringmann A, Reichenbach A. Role of Muller cells in retinal degenerations. Front Biosci. 2001;6:E77–E92. doi: 10.2741/bringman. [DOI] [PubMed] [Google Scholar]
- 28.Barthelmes D, Sutter FK, Gillies MC. Differential optical densities of intraretinal spaces. Invest Ophthalmol Vis Sci. 2008;49:3529–3534. doi: 10.1167/iovs.07-1320. [DOI] [PubMed] [Google Scholar]
- 29.Charbel Issa P, Scholl HP, Gaudric A, et al. Macular full-thickness and lamellar holes in association with type 2 idiopathic macular telangiectasia. Eye (Lond) 2009;23:435–441. doi: 10.1038/sj.eye.6703003. [DOI] [PubMed] [Google Scholar]
- 30.Bhosale P, Li B, Sharifzadeh M, et al. Purification and partial characterization of a lutein-binding protein from human retina. Biochemistry. 2009;48:4798–4807. doi: 10.1021/bi9004478. [DOI] [PubMed] [Google Scholar]
- 31.Snodderly DM, Brown PK, Delori FC, Auran JD. The macular pigment. I. Absorbance spectra, localization, and discrimination from other yellow pigments in primate retinas. Invest Ophthalmol Vis Sci. 1984;25:660–673. [PubMed] [Google Scholar]
- 32.Bringmann A, Pannicke T, Grosche J, et al. Muller cells in the healthy and diseased retina. Prog Retin Eye Res. 2006;25:397–424. doi: 10.1016/j.preteyeres.2006.05.003. [DOI] [PubMed] [Google Scholar]
- 33.Tout S, Chan-Ling T, Hollander H, Stone J. The role of Muller cells in the formation of the blood-retinal barrier. Neuroscience. 1993;55:291–301. doi: 10.1016/0306-4522(93)90473-s. [DOI] [PubMed] [Google Scholar]
- 34.Distler C, Weigel H, Hoffmann KP. Glia cells of the monkey retina. I. Astrocytes. J Comp Neurol. 1993;333:134–147. doi: 10.1002/cne.903330111. [DOI] [PubMed] [Google Scholar]
- 35.Gass JD. Histopathologic study of presumed parafoveal telangiectasis [letter] Retina. 2000;20:226–227. doi: 10.1097/00006982-200002000-00028. [DOI] [PubMed] [Google Scholar]
- 36.Barber AJ, Antonetti DA. Mapping the blood vessels with paracellular permeability in the retinas of diabetic rats. Invest Ophthalmol Vis Sci. 2003;44:5410–5416. doi: 10.1167/iovs.03-0244. [DOI] [PubMed] [Google Scholar]
- 37.Hogan MJ, Alvarado JA, Weddell JE. Histology of the Human Eye: An Atlas and Textbook. Philadelphia, PA: Saunders; 1971. pp. 508–519. [Google Scholar]


