Abstract
Magnetic resonance imaging contrast agents are currently designed by modifying their structural and physiochemical properties in order to improve relaxivity and to enhance image contrast. Here we show a general method for increasing relaxivity by confining contrast agents inside the nanoporous structure of silicon particles. Magnevist, gadofullerenes and gadonanotubes were loaded inside the pores of quasi-hemispherical and discoidal particles. For all combinations of nanoconstructs, a boost in longitudinal proton relaxivity r1 was observed: for Magnevist, r1~14 mM-1s-1/Gd3+ion (~8.15×10+7 mM-1s-1/construct); for gadofullerenes, r1~200 mM-1s-1/Gd3+ion (~7×10+9 mM-1s-1/construct); for gadonanotubes, r1~150 mM-1s-1/Gd3+ion (~2×10+9 mM-1s-1/construct). These relaxivity values are about 4 to 50 times larger than that of clinically-available gadolinium-based agents (~4 mM-1s-1 /Gd3+ion). The enhancement in contrast is attributed to the geometrical confinement of the agents, which influences the paramagnetic behavior of the Gd3+ions. Thus, nanoscale confinement offers a new and general strategy for enhancing the contrast of gadolinium-based contrast agents.
Magnetic resonance imaging (MRI) is one of the most powerful, non-invasive diagnostic imaging modalities in medicine and biomedical research for its superior resolution and for providing in-depth anatomical details in the early diagnosis of many diseases.1 In MRI, the nuclear spin of water protons, which are abundant in the body, is manipulated by external magnetic fields to produce images. In the magnetization of water protons, the longitudinal T1 and transverse T2 relaxation times, whose values are tissue dependent, are important in the generation of contrast.
Chemical contrast agents (CAs) are widely used to improve the sensitivity and diagnostic confidence in MRI.2-4 In 2007, of the 28 million MRIs performed in US, nearly 45% of them used CAs.5 These agents contain paramagnetic metal ions – mostly gadolinium ions Gd3+ – that exhibit time-dependent magnetic dipolar interaction with the surrounding water protons and improve the MRI sensitivity by decreasing the proton relaxation time T1.
Despite the progress in the design and synthesis of these agents, many are still limited by low relaxivity, low specificity and potential toxicity (Nephrogenic Systemic Fibrosis in patients with renal dysfunction). In particular, aqueous Gd3+ ions are toxic and therefore need to be sequestered using a variety of linear and macrocyclic chelates.2-4 Chelation minimizes the toxicity of the Gd3+ ions, as long as they are not released by demetallation in the circulation or by transmetallation with other ions such as Zn2+ present in the body. However, chelation can reduce the contrast enhancement (relaxivity) because it decreases the number of coordination sites available for water proton exchange (8-9 sites for aquated Gd3+ compared to 1-2 sites for Gd3+-chelate compounds).
In general, clinical CAs have r1 relaxivities of approximately 4 mM-1s-1 at 1.41T (see Supplementary Table SI16). Theoretical models 2,7 predict much larger values, up to and larger than 150 mM-1s-1 per Gd3+ ion, with optimized electronic, exchange and motional correlation properties. Moreover, most clinical CAs have low blood circulation time (a few minutes) and are not selective to tissues or cells, further limiting their applications. There is a need for MRI CAs with physiochemical properties that can enhance the detection limit, potentially, down to the single cell level.
New NanoConstructs for MRI Contrast Enhancement
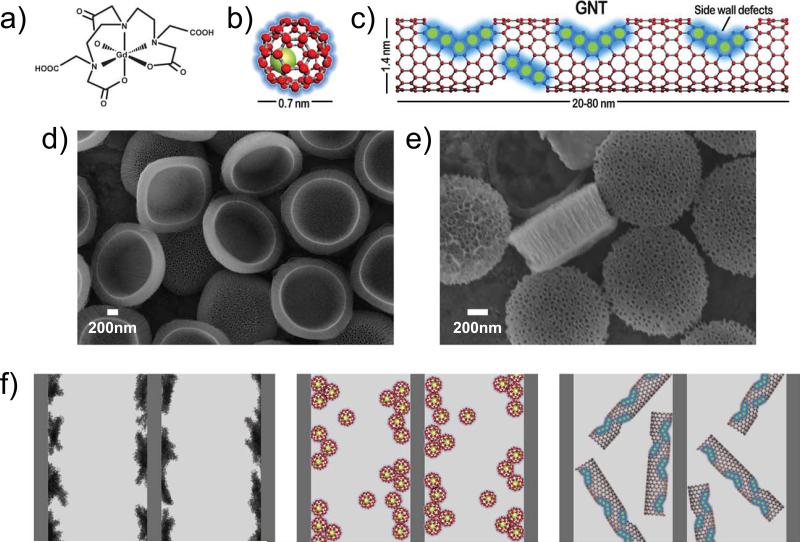
In this work, we have demonstrated enhanced efficiency of Gd-based CAs (Gd-CAs) by confining them within the nanoporous structure of intravascularly-injectable silicon MicroParticles (SiMPs).8 Enhancement in efficiency was shown for three different Gd-CAs: Magnevist (MAG), a clinically-used Gd3+ polyaminocarboxylate complex, and two carbon nanostructure-based lipophilic agents, gadofullerenes (GFs) and gadonanotubes (GNTs) (Figure 1a-c).
Figure 1. The new MRI nanoconstructs.
a-c, Schematic showing Magnevist (a), gadofullerenes (b) and debundled gadonanotubes (c). d, e Scanning electron micrographs of quasi-hemispherical (H–SiMP: 1.6 μm in diameter and 1.0 μm in thickness) (d) and discoidal (D–SiMP: 1.0 μm in diameter and 0.4 μm in thickness) particles (e). f, Cartoons showing Magnevist, gadofullerenes and gadonanotubes (left to right) entrapped within the porous structure of the SiMPs. The geometrical confinement of the Gd-based CAs within the nanopores enhances the T1 contrast by altering both the inner- and outer-sphere contributions.
The gadofullerenes of this study have a single Gd3+ ion encapsulated by a spherical fullerene cage of ~ 0.7 nm in diameter.9 The external fullerene cage, which prevents the leakage of the Gd3+ ions, can be chemically functionalized to provide solubility and biocompatibility.10 Even after functionalization, the GFs exist as aggregates in solution. The gadonanotubes are nanoscale carbon capsules (derived from full-length single-walled carbon nanotubes) with a length of 20-80 nm and a diameter of about 1.4 nm, which are internally loaded with Gd3+ ion clusters.11,12 Within the GNTs, the Gd3+ ions are present in the form of clusters (< 10 Gd3+ ions per cluster), and each GNT contains approximately 50 to 100 Gd3+ ions. The Gd3+ clusters are stable and the Gd3+ ions do not leak from the nanocapsules under physiological conditions.12 Because of the hydrophobic nature of their external carbon sheath, the GNTs exist in the form of bundles. In this work, a homogeneous dispersion of GNTs (debundled GNTs) was prepared using Na0/THF reduction.13
The SiMPs were microfabricated using a combination of photolithography and electrochemical etching that allows for the size, shape and porosity of the particles to be controlled.8,14 The shape can be hemispherical, quasi-hemispherical or discoidal with an effective diameter ranging from 600 nm to a few microns. The diameter of the pores can be tailored to be between 10 nm (small pores) and 100 nm (large pores). In this work, the Gd-CAs were loaded within the nanopores of quasi-hemispherical (H-SiMPs) particles, with a nominal diameter of 1.6 μm and thickness of about 1 μm, and discoidal (D-SiMPs) particles, with a nominal diameter of 1.0 μm and thickness of about 0.4 μm (Figure 1d-e). The pores had an average diameter ranging between 30-40 nm for both SiMPs, being slightly larger for the discoidal particles compared to the quasi-hemispherical particles.
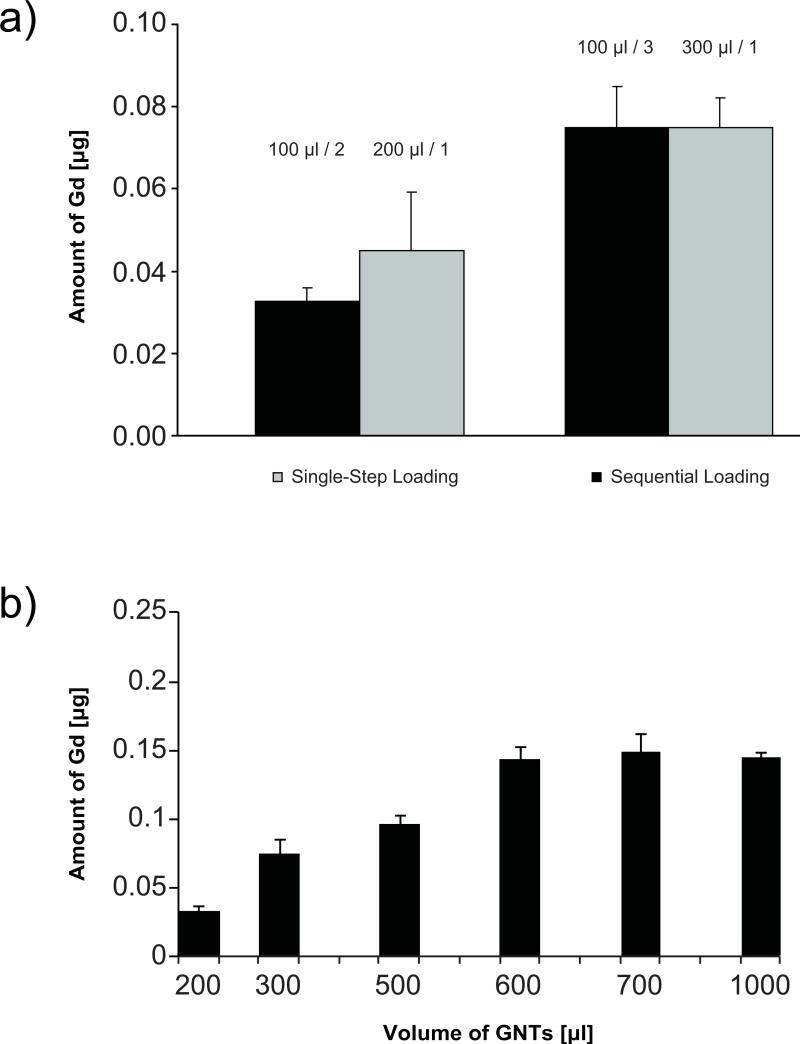
The Gd-CAs were loaded into the SiMPs by exposing dry SiMPs to a concentrated aqueous solution of the CAs, which are then drawn into the pores by capillary action.15 Two different loading procedures were used in this study: i) single-step and ii) sequential loading, where the SiMPs were exposed multiple times to the concentrated solution of Gd-CAs. As shown in Figure 2a for the representative case of H-SiMP/GNT, no significant difference was observed in loading efficiency between the two procedures. However, for the single-step procedure, Gd-CAs were also seen to adhere to the SiMP surface, whereas with the sequential loading, most (if not all) Gd-CAs were confined within the SiMP pores (FigureSI11,12). Therefore, the sequential loading was used in this work. Figure 2b shows the amount of Gd3+ ions within the H-SiMPs as a function of the GNT concentration within the aqueous stock solution. The silicon particles are saturated with a stock solution of 600 μl leading to about 0.15 μg of loaded Gd3+ ions. Similar results were derived for the D-SiMPs (FigureSI2). For analyzing the stability of the nanoconstructs, the release of the GNTs from saturated SiMPs was measured at 2h and 24h. The amount of Gd3+ ions released over time was found to be below the detection limit of ICP-OES.
Figure 2. Concentration of Gd3+ ions in the SiMP nanoconstruct as determined by ICP-OES analysis.
a, Graph comparing the single-step (grey bars) and sequential (black bars) loading procedures for two different volumes of the gadonanotube solution exposed to the SiMPs (200 μl and 300 μl). For the sequential loading, SiMPs were exposed multiple times to 100 μl stock solutions of gadonanotubes. No statistically significant differences were seen between the two procedures. b, Graph showing the amount of Gd3+ ions within H-SiMPs as a function of the volume of gadonanotube solution exposed.
MRI Characterization of the Nanoconstructs
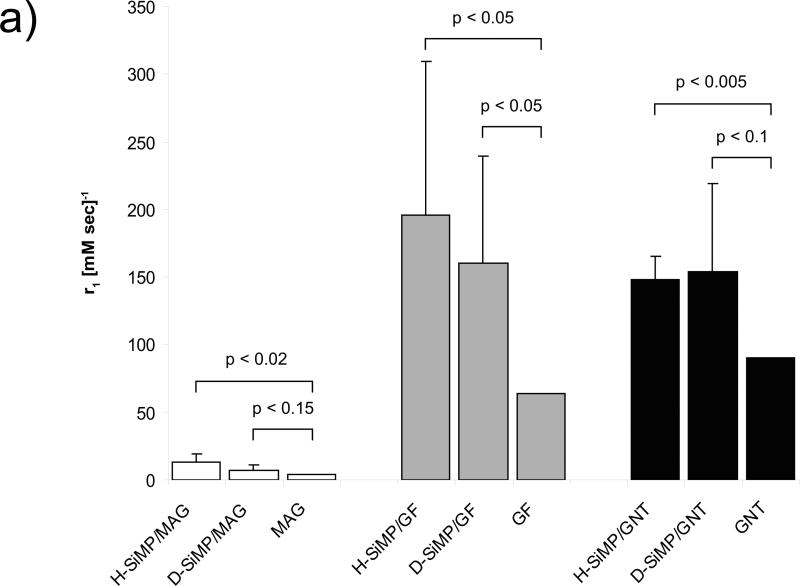
The relaxivity (ri) or the ability of a paramagnetic material to act as a MRI contrast agent, can be described as the change in the relaxation rate 1/Ti (s-1) of water protons per mM concentration of the CA and can be calculated using the expression ri = (1/Ti-1/Tid)/[CA], where Ti is the relaxation time in the presence of CAs, Tid is the relaxation time in the absence of CAs, and [CA] is the concentration of paramagnetic CAs (mM). The longitudinal relaxivity, r1, measured for the six different nanoconstructs is presented in Figure 3. As compared to the Gd-CA alone, a statistically significant increase in r1 was observed for all nanoconstructs: for MAG, r1 increased by about 4 times with the H-SiMP and 2 times with the D-SiMP; for GFs, r1 increased by about 3 times with the H-SiMP and 2.5 times with the D-SiMP; for GNTs, r1 increased by about 1.5 times for both SiMPs. Compared to aqueous Gd3+ ion (r1 ~8 mM-1s-1) and to the clinically-used Gd-based CAs (r1 ~4 mM-1s-1), the longitudinal relaxivity of the nanoconstructs is from about 18 to 40 times larger. The GF/SiMP nanoconstructs were characterized by large standard deviations since nearly 60% of the GF stock solution consisted of empty fullerenes, owing to difficulties in their separation.
Figure 3. The MRI characterization of the nanoconstruct by a bench-top relaxometer.
The longitudinal relaxivity, r1, of the six new MRI nanoconstructs is compared with the corresponding Gd-based CAs (1.41 T and 37°C). See Fig.SI3 for the tabular form of the data. Data are presented as mean ± SD (n ≥ 4). The Student's t test is used to estimate the p-values between two groups.
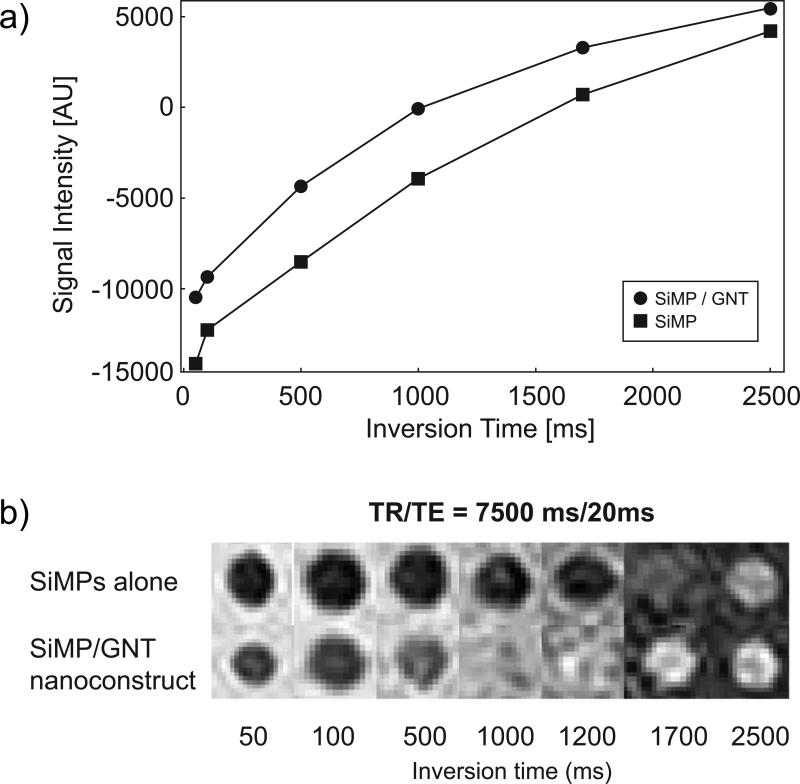
For the representative case of the H-SiMP/GNT nanoconstruct, the contrast enhancement properties were also examined using a clinical MRI scanner at 1.5T, and the results are presented in Figure 4. The H-SiMP/GNT construct showed a significantly lower inversion time (Tinv= ~1200 ms) compared to empty SiMPs (Tinv=~1700 ms) (Figure 4b), demonstrating that the contrast enhancement efficacy is due to the GNTs within the H-SiMP/GNT nanoconstruct.
Figure 4. The MRI characterization of the H-SiMP/GNT nanoconstruct in a clinical scanner.
a, The inversion recovery fit for SiMPs (black square) and SiMP/GNT (black dot) nanoconstructs were acquired using an inversion recovery pulse sequence and plotted as a function of their inversion time Tinv (time at which the signal is completely suppressed). b, Inversion recovery phantoms for SiMP and SiMP/GNT nanoconstruct, clearly showing faster recovery for the nanoconstruct. Data were obtained using a 1.5 T commercial clinical scanner with TR =7500 ms and TE = 20 ms.
Longitudinal Relaxivity and Geometrical Confinement
The classical theory for predicting the efficiency of MRI CAs is based on the work of Solomon, Bloembergen and Morgan2, which is especially applicable in the medium-to-high-field regime (> 0.1T) (Supplementary Information). In this approach, the longitudinal relaxivity r1 comprises two contributions: the inner-sphere relaxivity r1IS and the outer-sphere relaxivity r1OS. For r1IS, the most influential parameters are (i) the number, q, of fast-exchanging water molecules within the inner-sphere; (ii) the characteristic tumbling time, τR, of the agent together with its inner-sphere water molecules; (iii) the characteristic water proton residence lifetime, τm, of the inner-sphere water molecules; and (iv) the separation distance, rGdH, between the water protons and the metal ion. For r1OS, which arises from the translational diffusion of water molecules near the Gd3+ ions, the most influential parameter is the diffusion correlation time τD (Supplementary Information). In the case of Magnevist, the inner- and outer-sphere mechanisms contribute almost equally to the longitudinal relaxivity r1 (Supplementary Figure SI2). For gadofullerenes, in addition to the outer-sphere contribution, an inner-sphere-like mechanism, originating from the water proton exchange between the bulk and protonated OH sites on the fullerene cage, has been proposed.9 For gadonanotubes, as detailed below, the major contribution comes from the inner-sphere relaxivity.
Most research devoted to the design of new, high-efficiency CAs with optimized relaxivity has focused on controlling the above parameters.16 For example, paramagnetic liposomes obtained by loading Gd3+-ion-containing amphiphilic lipid into the bilayer membrane achieved an r1 of 11 mM-1s-1 at 25 MHz (see Gd-DOPC in Supplementary Table SI1),17 and Gd3+ion chelates covalently attached to PAMAM dendrimers demonstrated an r1 of 20 mM-1s-1 at 130 MHz.18 The bond between Gd3+ ions and the surrounding molecules have also been engineered to increase the rate of water exchange (reduce τm) and the characteristic tumbling time, τR. For example, Gd3+ ion complexes bound to humans serum albumin (GdL1-HSA complex in Supplementary Table SI1) have demonstrated r1 up to 130 mM-1s-1 at 20 MHz,19 and even larger values, up to 130 mM-1s-1 at 65 MHz, have been obtained for engineered proteins chelated with Gd3+ ions (Gd+3-Ca3.CD2 in Supplementary Table SI1).20 Also, non-covalent functionalization of carbon nanotubes with amphiphilic Gd3+ chelates have been studied, showing large r1's, up to 50 mM-1s-1 at 20 MHz.21 Finally, water-soluble GFs22 and GNTs11 are known to display relaxivities as large as r1~40 mM-1s-1 at 20 MHz for the GFs and ~170 mM-1s-1 for bundled GNTs. In this work, a general approach is shown for enhancing the r1 relaxivity of Gd-CAs, by confining the agent within a nanoporous matrix, whereby the characteristic parameters q, τR, τm and τD can be modified accordingly.
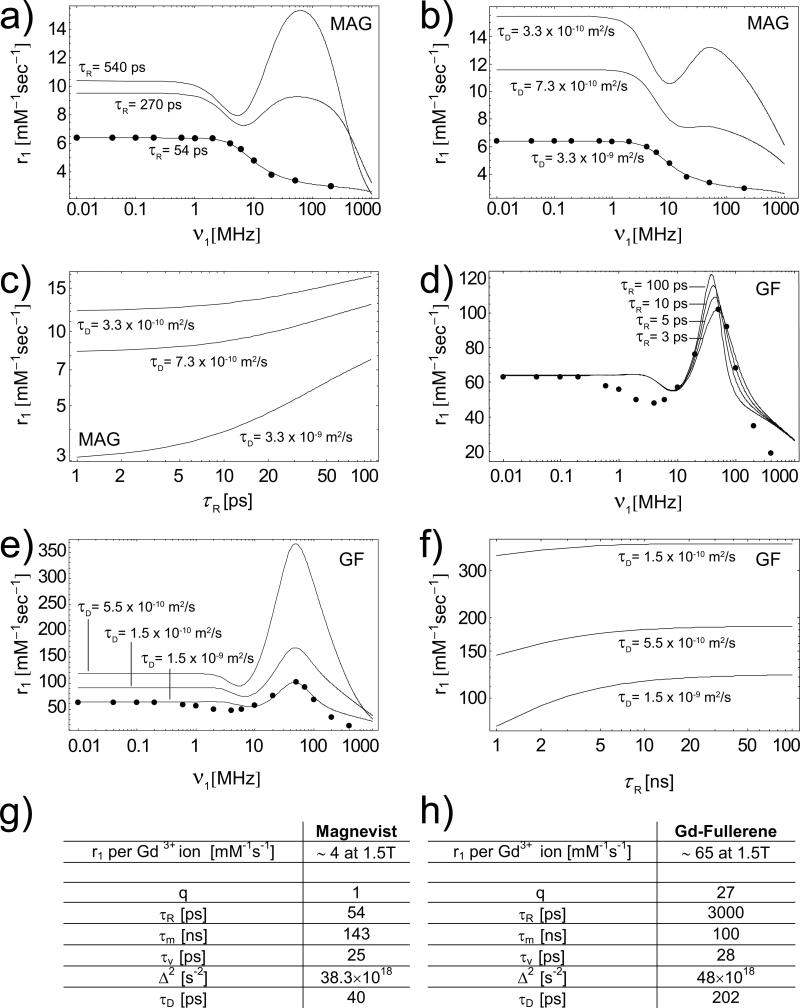
To interpret the observed boost in relaxivity, it is useful to analyze how the governing parameters listed above would affect the r1, beginning with the Gd-CAs alone. For MAG, the inner- and outer-sphere mechanisms contribute almost equally to the longitudinal relaxivity (Supplementary Information), generating r1 ~ 4 mM-1s-1 at 1.5 T. The effect of confining MAG within nanopores is twofold. First, confinement increases the characteristic tumbling time τR (inner-sphere), by reducing the ability of MAG to rotate freely. Second, it increases the correlation time τD (outer-sphere), by reducing the mobility of the outer-sphere water molecules. Figure 5a,b show that r1 grows with τR (= 54, 270 and 540 ps) and τD (= 40, 180 and 400 ps), reaching values close to 14 mM-1s-1 at 1.5T, as measured for the H-SiMP/MAG. The inner- and outer-sphere contributions would be again equally important, as demonstrated in Figure 5c.
Figure 5. Calculated longitudinal relaxivity for the SiMP/MAG and SiMP/GF nanoconstructs.
The experimental NMRD profile for Magnevist (dots)6 is compared with three curves (solid lines) derived from the SBM Theory for different values of the parameter τR (= 54, 270 and 540 ps) a); and τD (= 40, 180 and 400 ps) b). c, The calculated maximum longitudinal relaxivity r1 of the SiMP/MAG nanoconstructs as a function of the governing parameters τR and τD. All the other parameters as from the Table g). The experimental NMRD profile for GF (dots)23 is compared with four curves (solid lines) derived from the SBM Theory for different values of the parameterτR (= 3, 5, 10 and 100 ns) d); and τD (= 200, 550 and 2000 ps) e). f, The calculated maximum longitudinal relaxivity r1 of the SiMP/GF nanoconstructs as a function of the governing parameters τR and τD. All the other parameters as from the Table h). The magnetic properties in g) and h) are derived from the best fitting of the experimental NMRD profiles.
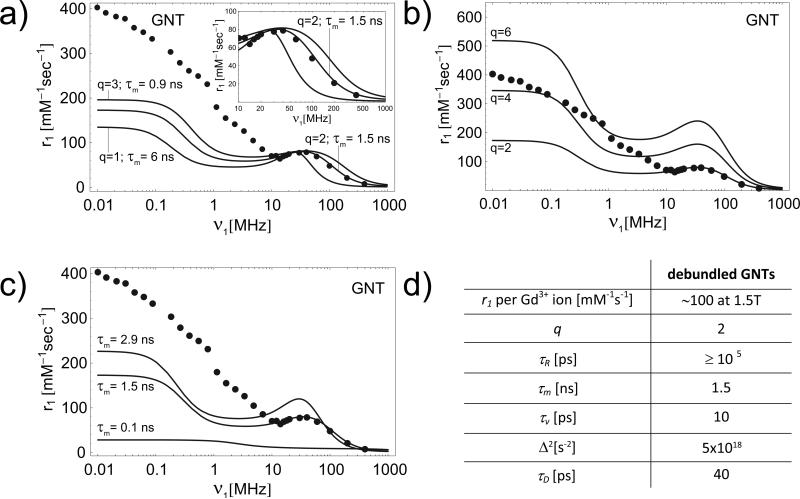
For GFs, the interpretation of the results is more challenging because of the unique and still not fully understood behavior of these agents.9 No theory yet can accurately predict the Nuclear Magnetic Relaxation Dispersion (NMRD) profile of GFs, and the SBM approach provides a satisfactory approximation only within the clinically relevant regime (10 – 100 MHz) and for very low fields (Figure 5d). The picture is complicated even further by observing that experimental studies on GFs suggested that their high relaxivity originates primarily from the formation of aggregates characterized by larger diffusion correlation times τD (outer-sphere) and slightly longer tumbling times τR (inner-sphere-like).9,22 The loading of GFs into nanopores could favor aggregation and possibly coordinate interactions among adjacent clusters. For GFs, an increase in τR and τD (reduction in D) would certainly result in an increase of r1 (Figure 5d,e).23 The increase in τD seems to be more effective particularly for GF with a large relaxivity (Figure 5e,f). The scattering observed in r1 for the SiMP/GF constructs has yet to be understood due to the presence of empty fullerenes in the stock solution and to the level of aggregation, both of which are parameters not easily controlled during the synthesis process. On the other hand, GNTs can be more effectively manipulated to obtain stock solutions with homogenous properties. Therefore, the following discussion is more focused on GNTs. The experimental NMRD profile (solid dots) for debundled GNTs (solubilized in water with a dextran coating, i.e. GadoDex, see Supplementary Information) is shown in Figure 6a together with three solid lines representing the best fit of the experimental data from the SBM Theory. The theoretical predictions can accurately reproduce the experimental NMRD profile only in the medium-to-high field regime (νI > 10 MHz), which is the clinically-relevant range. The best fit was obtained for q = 2, τR = 100 ns, τm = 1.5 ns, rGdH = 0.31 nm, with the values for other parameters as shown in Figure 6d. The accuracy of the fitting is clearly shown in the inset of Figure 6a. The characteristic τR value used is relatively long when compared to other Gd-based CAs studied so far (see Supplementary Table SI1). However, it should be noted that for a spherical CA of radius a = 5 nm tumbling in aqueous solution, the characteristic τR is about 100 ns, and larger values can be estimated for a cylindrical nanoparticle (GNTs, 20-80 nm long and 1.4 nm in diameter) tumbling within a SiMP nanopore (Supplementary Information). For other fitting parameters (except for q, τR and τm as discussed above), their values fall within the ranges normally observed for Gd-based CAs (Supplementary Table SI1).2 In addition, the simulated NMRD profiles have been observed to be quite insensitive to variations in τv and Δ2 (Supplementary Figures SI4 and SI5). Also, for the GNTs, it has been estimated that the inner-sphere contribution to r1 relaxivity dominates the outer-sphere contribution (r1OS / r1IS < 1) (Supplementary Figure SI6), in agreement with recent findings that show this is generally the case with slowly rotating CAs with large relaxivity.24
Figure 6. NMRD profiles for the GNT and the SiMP/GNT construct.
Graph showing the comparison of experimental (dotted line)9 NMRD profile and best fitting curves (solid lines) derived from the SBM theory for different values of q and τm a); for q = 2, 4 and 6 and τm = 1.5 ns; and for τm = 0.1, 1.5 and 2.9 ns and q =2 c). All other parameters as derived from the best fitting of the experimental NMRD as shown in d).
The nanoconstruct obtained by loading debundled GNTs into the SiMPs demonstrated a r1 relaxivity of ~150 mM-1s-1 at 1.41T, which is significantly larger than the ~90 mM-1s-1 observed for the debundled GNTs before loading. Starting from the fitting parameters obtained for the debundled GNTs alone, the theoretical NMRD profiles for different values of q, namely, q = 2, 4 and 6 (fixed τm = 1.5 ns), and for different values of τm, namely, τm = 0.1, 1.5 and 2.9 ns (fixed q = 2), are plotted in Figures 6b and c, respectively. Given the large value of τR for GNTs, its contribution to r1 is minor compared to the other two parameters. Increasing τm at constant q leads to significant narrowing of the relaxivity peak and also to the shifting of the peak to lower field strengths (Figure 6c). In addition, it was observed that, in the medium-to-high-field regime (νI > 10 MHz), a greater increase in r1 can be achieved by increasing q than by increasing τm (Figures 6b and c).
The relaxation time measurements clearly demonstrate that the SiMPs themselves do not contribute to the relaxivity of the nanoconstruct. Thus, the increase in relaxivity observed for the nanoconstruct can be attributed solely to the geometrical confinement of the debundled GNTs and their final organization within the pores. The confinement of debundled GNTs within the SiMPs nanopores could increase their tumbling time, τR, to an even greater extent because of the contact with the pore walls and the increase in effective viscosity of the aqueous solution trapped within the pores. Although the surfactant wrapping would prevent the aggregation of debundled GNTs within the pores, the debundled GNTs, packed in close proximity to one another within the nanoconstruct would resemble a uniform nanotube bundle, and indeed, the r1 relaxivity of the nanoconstruct (~ 150 mM-1s-1 per Gd3+ ion) is similar to the value reported for bundled GNTs (r1 ~ 170 mM-1s-1)11. This type of pseudo-aggregation of debundled GNTs inside SiMPs could result in water molecules getting trapped in the interstices of the GNT bundles. A similar effect has been found for GFs which aggregate in aqueous solution forming interstices with confined water molecules.22,23 It had been shown that disruption of the aggregates leads to a considerable decrease of relaxation enhancement. The water molecules trapped between debundled GNTs inside SiMPs could enhance the overall relaxivity like second sphere water molecules in the case of some more common Gd3+ complexes.25,26
Conclusions
By confining Gd-CAs inside the nanoporous structure of microfabricated silicon particles, the T1 contrast of these agents can be improved. Geometrical confinement can alter the original parameters q, τm, τR and τD, and potentially others, by reducing the ability of the CAs to tumble, by decreasing the mobility of the water molecules and by favoring clustering and mutual interactions among the loaded CAs. Because the size, shape and surface properties of the SiMPs can be rationally designed27,28 and tailored14 to enhance the accumulation at biological target sites29, they represent a good particle-based system for efficient intravascular delivery. Furthermore, SiMPs can be engineered to control degradation30 and improve their overall half-life in blood without affecting the MRI performance of the CAs inside. The nanoconstructs may potentially be used for single-cell imaging techniques, where high relaxivity (r1 > 100 mM-1s-1) and large local concentrations of Gd3+ ([Gd3+] > 107/cell) are needed.31 Finally these nanoconstructs might also be loaded with multiple agents, such as other nanoparticles and/or small molecules and drugs32-35, to generate multifunctional systems that have both imaging and therapeutic capabilities.
Supplementary Material
Acknowledgments
This work was supported by TATRC-USAMRAA through the pre-center grant W81XWH-09-2-0139 of the Alliance for Nano Health. This work was also partially supported through the grants DODW81XWH-09-1-0212 and NIH U54CA143837 at UTHSC-H; by the Robert A. Welch Foundation (Grant C-0627), the NIH U54CA143837 grant and the Nanoscale Science and Engineering Initiative under the NSF EEC-0647452 at Rice University; by the Swiss National Science Foundation and EU COST Action D38 “Metal Based Systems for Molecular Imaging Applications” at EPFL; and through the NIH Grant R43CA128277-02 at TDA. The authors would like to thank Lesa A. Tran for assistance with SEM imaging; Dr. Jodie Conyers for allowing the use of the bench-top relaxometer; Matthew Landry for all the graphical work.
Materials and Methods
Fabrication, modification and characterization of the SiMPs
H-SiMPs (1.6 μm diameter) were fabricated as in 8, 14. D-SiMPs (1.0 μm diameter, 400 nm thickness) were fabricated by newly developed protocols. Briefly, heavily doped p++ type (100) silicon wafers with resistivity of 0.005 ohm-cm (Silicon Quest, Inc, Santa Clara, CA) were used as the silicon source. A 400nm porosity layer was formed by applying a 7mA/cm current for 125” in a 1:3 HF(49%):ethanol solution. The electrical current was then increased to 76mA/cm and applied for 8” forming a high porosity release layer. A 40 nm SiO2 layer was deposited by Low Pressure Chemical Vapor Deposition at 400°C. Standard photolithography was used to pattern a 1.0 μm circular pattern with 1.0 μm pitch over the SiO2 capped porous layer using a contact aligner (K.Suss MA6 mask aligner) and NR9-500P photoresist (Futurrex Franklin, NJ, USA). The pattern was transferred into the porous double layer by dry etch in CF4 plasma (Plasmatherm 790, 25sccm CF4, 100 mTorr, 200W RF). The capping SiO2 layer was removed in 49% HF, and the particles were released from the substrate by sonication in isopropanol. The particles were treated with H2O2 at 100°C to oxidize the surface.
Volumetric particle size, size distribution and count were obtained using a Multisizer 4 Coulter® Particle Counter (Beckman Coulter, Fullerton, CA, USA). The SiMP zeta potential was analyzed in phosphate buffer (PB, pH 7.3) using a ZetaPALS (Brookhaven Instruments Corporation, Holtsville, NY, USA). Particles structure and integrity were verified by SEM.
Fabrication and modification of GFs and GNTs
Polyhydroxylated Gadofullerenes [Gd@C60(OH)x; x ~27] were prepared9, 22 and dissolved in HPLC grade water. The resulting solution was passed through a 0.2 μ filter and centrifuged at 3200 rpm for 10 minutes. The resulting supernatant solution was used for loading and MRI characterization.
Individual US-tubes loaded with Gd3+ ions were prepared as described previously.11, 13, 36 As produced, individual gadonanotubes (GNTs) were then dispersed in a biocompatible, non-ionic, pluronic® (Polyethylene oxide-polypropylene oxide block copolymer, BASF corporation, NJ) polymer (1.0 % W/V). The dispersion was centrifuged at 3200 rpm for 10 minutes and the supernatant was dialyzed against running water to remove any excess surfactant. The resulting aqueous dispersion was used for the SiMP loading experiments.
Loading of the SiMPs with Gd-CAs
SiMPs were lyophilized to dryness for 6 hours in non-stick plastic tubes using Labconco® FreeZone™ Freeze Dryer system. Two protocols were tested: (1) single-step and (2) sequential loading. For (1), dry Si particles were mixed with 300 μL of Gd-CAs solution. The resulting suspension was sonicated (30 W bath sonicator) for 5 minutes and centrifuged for 10 min at 3200 rpm. The supernatant was discarded and the sediment washed twice with deionized water to remove any excess of Gd-CAs adhering to the outer surface of the Si particles. For (2), the Si particles were introduced initially to 100 μl of Gd-CAs stock solutions, followed by sonication and centrifugation. After the supernatant was discarded, another 100 μl of the stock solution was added followed by sonication and centrifugation. The process was repeated with addition of 100 μl of stock solution followed by loading and washing twice with DI water. In order to estimate the efficiency of loading, the particles were dissolved in 1N NaOH overnight. The resulting solution was treated with ~26 % HClO3 and heated to dryness. The resulting precipitate was dissolved in 2 % HNO3. Si and Gd3+ ions released from the particles during the degradation process were measured using a Perkin-Elmer Elan 9000 inductively coupled plasma-optical emission spectrometer (ICP-OES) respectively.
Release of GNTs from SiMPs
The SiMPs were exposed to a GNT stock solution of 600 μl. The nanoconstructs were then dispersed in HPLC water and left at room temperature. At 2 h and 24 h, the SiMPs were filter-spun using 0.45 μm filter columns at 3200 rpm for 5 min. The washings were assessed for the concentration of Gd3+-ions using ICP-OES.
Relaxometry studies
The 1/T1 NMRD profiles of debundled GNTs were obtained at 310.0 K on a Stelar Spinmaster Fast Field-Cycling relaxometer; Bruker Minispecs (30, 40 and 60 MHz); and Bruker spectrometers (100, 200 and 400 MHz). T1 relaxation times of GNTs in nanoporous silicon particles were measured in a Spin track bench top relaxometer (Process NMR associates, CT) operating at 60 MHz and 37 °C with a 5 mm probe. T1 relaxation times were measured using inversion recovery sequence and HPLC grade water was used as diamagnetic control.
Phantom studies in clinical scanner were performed in a 1.5 T commercial scanner (Achieva, Philips Medical Systems, Best, The Netherlands) equipped with a 32-channel radiofrequency system. A 32- or 16-element phased-array surface coil was used for MR signal reception. An inversion recovery sequence was used for image acquisition with TR = 7500 ms and TE = 20 ms.
Footnotes
Competing financial interests
The authors declare no competing financial interests.
Additional Information
Supplementary information accompanies this paper at www.nature.com/naturenanotechnology. Reprints and permission information is available online at http://npg.nature.com/reprintsandpermissions/. Correspondence and requests for materials should be addressed to PD.
References
- 1.Mansfield P. Snapshot magnetic resonance imaging. Angew. Chem., Int. Ed. 2004;43:5456–5464. doi: 10.1002/anie.200460078. [DOI] [PubMed] [Google Scholar]
- 2.Caravan P, Ellison JJ, McMurry TJ, Lauffer RB. Gadolinium(III) chelates as MRI contrast agents: structure, dynamics, and applications. Chem. Rev. 1999;99:2293–2352. doi: 10.1021/cr980440x. [DOI] [PubMed] [Google Scholar]
- 3.Lauffer RB. Paramagnetic metal complexes as water proton relaxation agents for NMR imaging: theory and design. Chem. Rev. 1987;87:901–927. [Google Scholar]
- 4.Merbach AE, Toth E. The Chemistry of Contrast Agents in Medical Magnetic Resonance Imaging. John Wiley & Sons; Chichester: 2001. [Google Scholar]
- 5. Available at http://www.imvinfo.com/
- 6.Laurent S, Vander Elst L, Muller RN. Comparative study of the physicochemical properties of six clinical low molecular weight gadolinium contrast agents. Contrast Media Mol. Imaging. 2006;1:128–137. doi: 10.1002/cmmi.100. [DOI] [PubMed] [Google Scholar]
- 7.Toth E, Helm L, Merbach AE. The Chemistry of Contrast Agents in Medical Magnetic Resonance Imaging. John Wiley & Sons; Chichester: 2001. Relaxivity of gadolinium(III) complexes: theory and mechanism. pp. 45–119. [Google Scholar]
- 8.Tasciotti E, et al. Mesoporous silicon particles as a multistage delivery system for imaging and therapeutic applications. Nature Nanotech. 2008;3:151–157. doi: 10.1038/nnano.2008.34. [DOI] [PubMed] [Google Scholar]
- 9.Toth E, et al. Water-soluble gadofullerenes: toward high-Relaxivity, pH-responsive MRI contrast agents. J. Am. Chem. Soc. 2005;127:799–805. doi: 10.1021/ja044688h. [DOI] [PubMed] [Google Scholar]
- 10.Sayes CM, et al. The differential cytotoxicity of water-soluble fullerenes. Nano Lett. 2004;4:1881–1887. [Google Scholar]
- 11.Sitharaman B, et al. Superparamagnetic gadonanotubes are high-performance MRI contrast agents. Chem. Commun. 2005;31:3915–3917. doi: 10.1039/b504435a. [DOI] [PubMed] [Google Scholar]
- 12.Hartman KB, et al. Gadonanotubes as ultrasensitive pH-smart probes for magnetic resonance imaging. Nano Lett. 2008;8:415–419. doi: 10.1021/nl0720408. [DOI] [PubMed] [Google Scholar]
- 13.Ashcroft JM, et al. Functionalization of individual ultra-short single-walled carbon nanotubes. Nanotechnology. 2006;17:5033–5037. [Google Scholar]
- 14.Chiappini C, et al. Tailored porous silicon microparticles: fabrication and properties. Chem. Phys. Chem. 2010;11:1029–1035. doi: 10.1002/cphc.200900914. [DOI] [PMC free article] [PubMed] [Google Scholar]
- 15.Li Z, Drazer G. Fluid enhancement of particle transport in nanochannels. Phys. Fluids. 2006;18:117102–117108. [Google Scholar]
- 16.Mulder WJM, et al. Nanoparticulate assemblies of amphiphiles and diagnostically active materials for multimodality imaging. Acc. Chem. Res. 2009;42:904–914. doi: 10.1021/ar800223c. [DOI] [PMC free article] [PubMed] [Google Scholar]
- 17.Strijkers GJ, et al. Relaxivity of liposomal paramagnetic MRI contrast agents. Magn. Reson. Mater. Phys., Biol. Med. 2005;18:186–192. doi: 10.1007/s10334-005-0111-y. [DOI] [PubMed] [Google Scholar]
- 18.Talanov VS, et al. Dendrimer-based nanoprobe for dual modality magnetic resonance and fluorescence imaging. Nano Lett. 2006;6:1459–1463. doi: 10.1021/nl060765q. [DOI] [PubMed] [Google Scholar]
- 19.Avedano S, et al. Maximizing the relaxivity of HSA-bound gadolinium complexes by simultaneous optimization of rotation and water exchange. Chem. Commun. 2007;45:4726–4728. doi: 10.1039/b714438e. [DOI] [PubMed] [Google Scholar]
- 20.Yang JJ, et al. Rational design of protein-based MRI contrast agents. J. Am. Chem. Soc. 2008;130:9260–9267. doi: 10.1021/ja800736h. [DOI] [PMC free article] [PubMed] [Google Scholar]
- 21.Richard C, et al. Noncovalent functionalization of carbon nanotubes with amphiphilic Gd3+ chelates: toward powerful T1 and T2 MRI contrast agents. Nano Lett. 2008;8:232–236. doi: 10.1021/nl072509z. [DOI] [PubMed] [Google Scholar]
- 22.Laus S, et al. Understanding paramagnetic relaxation phenomena for water-soluble gadofullerenes. J. Phys. Chem. C. 2007;111:5633–5639. [Google Scholar]
- 23.Laus S, et al. Destroying gadofullerene aggregates by salt addition in aqueous solution of Gd@C60(OH)x and Gd@C60[C(COOH2)]. J. Am. Chem. Soc. 2005;127:9368–9369. doi: 10.1021/ja052388+. [DOI] [PMC free article] [PubMed] [Google Scholar]
- 24.Kruk D, Kowalewski J. General treatment of paramagnetic relaxation enhancement associated with translational diffusion. J. Chem. Phys. 2009;130:174104–174112. doi: 10.1063/1.3119635. [DOI] [PubMed] [Google Scholar]
- 25.Botta M. Second coordination sphere water molecules and relaxivity of gadolinium (III) complexes: implications for MRI contrast agents. Eur. J. Inorg. Chem. 2000;2000:399–407. [Google Scholar]
- 26.Lebduskova P, et al. Phosphinic derivative of DTPA conjugated to a G5 PAMAM dendrimer: an 17O and 1H relaxation study of its Gd(III) complex. Dalton Trans. 2006;28:3399–3406. doi: 10.1039/b517847a. [DOI] [PubMed] [Google Scholar]
- 27.Decuzzi P, Ferrari M. The adhesive strength of non-spherical particles mediated by specific interactions. Biomaterials. 2006;27:5307–5314. doi: 10.1016/j.biomaterials.2006.05.024. [DOI] [PubMed] [Google Scholar]
- 28.Decuzzi P, Pasqualini R, Arap W, Ferrari M. Intravascular delivery of particulate systems: does geometry really matter? Pharm. Res. 2009;26:235–243. doi: 10.1007/s11095-008-9697-x. [DOI] [PubMed] [Google Scholar]
- 29.Decuzzi P, et al. Size and shape effects in the biodistribution of intravascularly injected particles. J. Control. Release. 2009;141:320–327. doi: 10.1016/j.jconrel.2009.10.014. [DOI] [PubMed] [Google Scholar]
- 30.Godin B, et al. Multistage mesoporous silicon-based nanocarriers: biocompatibility and controlled degradation in physiological fluids. CRS Newsletter. 2008;25:9–11. [PMC free article] [PubMed] [Google Scholar]
- 31.Nunn AD, Linder KE, Tweedle MF. Can receptors be imaged with MRI agents? Q. J. Nucl. Med. 1997;41:155–162. [PubMed] [Google Scholar]
- 32.Tanaka T, et al. Sustained small interfering RNA delivery by mesoporous silicon particles. Cancer Research. 2010;70:3687–96. doi: 10.1158/0008-5472.CAN-09-3931. [DOI] [PMC free article] [PubMed] [Google Scholar]
- 33.Anglin EJ, Cheng L, Freeman WR, Sailor MJ. Porous silicon in drug delivery devices and materials. Adv. Drug Deliv. Rev. 2008;60:1266–1277. doi: 10.1016/j.addr.2008.03.017. [DOI] [PMC free article] [PubMed] [Google Scholar]
- 34.Park JH, et al. Biodegradable luminescent porous silicon nanoparticles for in vivo applications. Nature Mat. 2009;8:331–336. doi: 10.1038/nmat2398. [DOI] [PMC free article] [PubMed] [Google Scholar]
- 35.Slowing II, Vivero-Escoto JL, Wu CW, Lin VS. Mesoporous silica nanoparticles as controlled release drug delivery and gene transfection carriers. Adv. Drug Deliv, Rev. 2008;60:1278–88. doi: 10.1016/j.addr.2008.03.012. [DOI] [PubMed] [Google Scholar]
- 36.Gu Z, Peng H, Hauge RH, Smalley RE, Margrave JL. Cutting single-wall carbon nanotubes through fluorination. Nano Lett. 2002;2:1009–1013. [Google Scholar]
Associated Data
This section collects any data citations, data availability statements, or supplementary materials included in this article.


