Abstract
The study is aimed at exploring the utility of thermoanalytical methods in the solid-state characterization of various crystalline forms of nevirapine. The different forms obtained by recrystallization of nevirapine from various solvents were identified using differential scanning calorimetry and thermogravimetric analysis (TGA). The appearance of desolvation peak accompanied by weight loss in TGA indicated the formation of solvates: hemi-ethanolate (Form I), hemi-acetonitrilate (Form II), hemi-chloroformate (Form III), hemi-THF solvate (Form IV), mixed hemi-ethanolate hemi-hydrate (Form V), and hemi-toluenate (Form VI). The higher desolvation temperatures of all the solvates except toluenate than their respective boiling point indicate tighter binding of solvent. Emphasis has been laid on the determination of heat capacity and heat of solution utilizing microreaction calorimeter to further distinguish the various forms. The enthalpy of solution (ΔHsol), an indirect measure of the lattice energy of a solid, was well correlated with the crystallinity of all the solid forms obtained. The magnitude of ΔHsol was found to be −14.14 kJ/mol for Form I and −2.83 kJ/mol for Form V in phosphate buffer of pH 2, exhibiting maximum ease of molecular release from the lattice in Form I. The heat capacity for solvation (ΔCp) was found to be positive, providing information about the state of solvent molecules in the host lattice. The solubility and dissolution rate of the forms were also found to be in agreement with their enthalpy of solution. Form (I), being the most exothermic, was found to be the most soluble of all the forms.
Key words: calorimetry, enthalpy of solution, heat capacity, recrystallization, solvates
INTRODUCTION
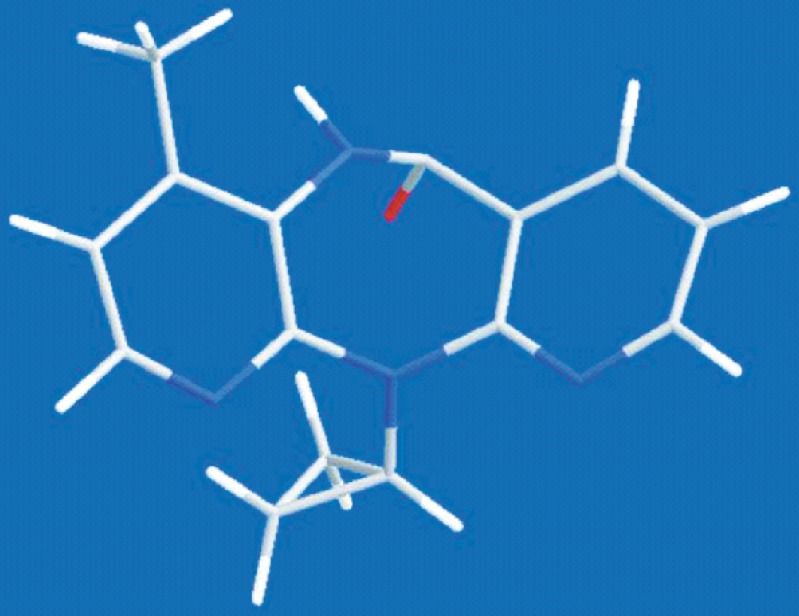
The tendency of pharmaceutical solids to exist in two or more crystalline forms with different molecular arrangement can be attributed to the complexity of their chemical structure (1). Based on internal structure, the pharmaceutical crystal may be one of a group of polymorphs or a molecular adduct when its lattice consists of multicomponents and includes solvates and hydrates (2). The term polymorph describes multiple crystal forms with the same molecular formula but having different free energies so that their physicochemical and biopharmaceutical properties are necessarily different (3). Solvates or pseudopolymorphs are different crystalline forms of the same compound with association of solvent within the crystal lattice in a stoichiometric or non-stoichiometric ratio and are quite different from the polymorphs of the same drug molecule (4). This solid-state transformation of pharmaceutical solids to polymorphs or solvates has significant effect on solubility and stability, which in turn are key contributors toward bioavailability (5,6). Thus, thorough investigation of new solid states of a drug compound is recognized as an essential and very important part of preformulation studies (7). The screening for various crystal modifications has been increasingly emphasized in the pharmaceutical industry not only because of patent establishment and litigation (8,9) but also because it provides valuable knowledge necessary for further development of the drug formulation (10–12). A battery of techniques is always desirable for screening of various crystal forms of an active pharmaceutical ingredient (API) (13–18). Although X-ray powder diffractometry remains the most common technique for identifying and characterizing the various crystalline forms, thermoanalytical methods have emerged as a complementary technique to monitor crystallinity and polymorphism due to its speed and minimal sample preparation (19,20). Driven by the importance of the solid-state properties of API, we performed a comprehensive study on the various crystalline forms of nevirapine (11-cyclopropyl-5,11-dihydro-4-methyl-6H-dipyrido[3,2-b:2′,3′-e][1,4]diazepin-6-one; Fig. 1). It is a well-known antiretroviral agent belonging to non-nucleoside reverse transcriptase inhibitor and is used in the treatment of AIDS. The drug belongs to class II of the Biopharmaceutics Classification System with a pKa of 2.8 and is practically insoluble in water (solubility ∼0.1 mg/ml), and consequently, dissolution of the drug has been considered to be the rate-limiting step for absorption (21–24). The amide function (–CONH) in the drug makes it a potential candidate for crystal polymorphism or pseudopolymorphism upon interaction with various solvents, thereby displaying unique physicochemical properties (25). The alternate solid forms may have improved solubility and dissolution properties. Nevirapine has been reported in three polymorphic forms (26,27) and as some solvates or hydrates (24,28,29). However, not much information is available on the thermal properties. The study is focused on the utilization of thermoanalytical methods such as enthalpy of solution and heat capacity besides differential scanning calorimetry (DSC) and thermogravimetric analysis (TGA) for characterizing the generated alternate solid forms.
Fig. 1.
Wireframe representation of nevirapine crystal
MATERIALS AND METHODS
Materials
Nevirapine was obtained as a gift sample from Ranbaxy Laboratories Pvt. Ltd. (Poanta Sahib, India). Phosphate buffer, pH 2.0, was prepared using AR grade potassium dihydrogen phosphate monohydrate and phosphoric acid, while phosphate buffer, pH 7.0, was prepared using mono- and disodium salts of phosphoric acid according to given procedures (30). The solutions were freshly prepared and the pH values were measured using a pH meter (pH Tutor Bench meter, Eutech Instruments, India). Solvents used for crystallization like absolute alcohol, acetonitrile, chloroform, tetrahydrofuran, and toluene (Sigma Aldrich) were of high purity and analytical grade.
Preparation of Solvates
Recrystallization of the drugs was conducted by dissolving nevirapine in minimum amount of solvents or solvent mixtures at temperature of a few degrees below the boiling point of the solvent. The saturated solution was then filtered while hot using a 0.45-μm membrane filter (Millipore) and was left to recrystallize by spontaneous cooling and evaporation at room temperature (28°C). Recrystallized product obtained in a period of 1–7 days was isolated by suction filtration and dried at ambient temperature in a dessicator with CaCl2 dessicant prior to solid-state analysis. Based upon the solvents used for recrystallization, the solvates were designated as Form I (ethanolate), Form II (acetonitrilate solvate), Form III (chloroformate), Form IV (THF solvate), and Form VI (toluenate). Form V (mixed ethanol–water solvate) was obtained from ethanol using water as antisolvent.
Thermal Methods of Analysis
DSC thermograms were obtained on DSC, Q20, TA Instruments-Waters LLC, USA. The calorimeter was calibrated for temperature and heat flow accuracy using the melting of pure indium (mp 156.6°C and ∆H of 25.45 J g−1). A mass between 5 and 8 mg was taken into the aluminum pan, covered with lid, and sealed. DSC curves were obtained under a nitrogen purge of 50 mL min−1 at a heating rate of 2°C min−1 with the temperature range from 50°C to 350°C.
Loss of solvent from the crystals was characterized by TGA obtained by TA Instruments-Waters LLC. TGA traces were recorded at heating rates of 2°C min−1 under a nitrogen purge of 50 mL min−1. Samples with masses between 3 and 10 mg were analyzed using a platinum pan. Mass loss (%) was calculated based on the mass of the original sample.
Karl Fischer Aquametry
Karl Fischer titrimeter (Veego/Matic-D, India) was used for the determination of moisture content in order to find the number of bonded water molecules.
X-Ray Powder Diffraction Analysis
The powder diffraction patterns were recorded on an X-ray diffractometer (XPERT-PRO, PANalytical, Netherlands) with Cu as tube anode. The diffractograms were recorded under the following conditions: voltage 40 kV, current 35 mA, slit 0.1 mm, scanning speed 2° per minute.
Fourier Transform Infrared Spectrometry
Fourier transform infrared spectrometry (FTIR) spectra were obtained on an FT-IR spectrometer, Mode spectrum RXI (Perkin Elmer, England) over the range 400–4,000 cm−1. Dry KBr (50 mg) was finely ground in an agate mortar and sample of the drug or the solvate (1–2 mg) was subsequently added and mixed gently. A manual press was used to form the pellet.
Microcalorimetric Study
Heat capacity and enthalpy of solution were determined by a microreaction calorimeter (a power compensation system) obtained from Thermal Hazards Technology, UK.
Heat Capacity Measurement
The heat capacity for nevirapine and all the solvates was conducted at 25°C (24–26°C). About 100–150 mg of the sample was weighed (Sartorius model CP225D) directly into a glass vial. The empty vial was placed as the reference. A measurement with empty vial was conducted first to ensure that any difference between the heat capacity of the vials has been accounted for. The instrument was equilibrated at 24°C. A temperature step of 2°C is then applied to the system and the heat required was measured. The experiment is then repeated in the reverse direction to verify the measurement. The heat capacity was calculated by the software provided within the instrument.
Enthalpy of Solution
The enthalpy of solution was determined in two different solvents, viz, the phosphate buffer (pH 2) and methanol at 25°C. Two experimental vials (reference and sample) filled with equal volume of the desired solvent were placed in a calorimetric block. A solid sample of about 2–10 mg, accurately weighed (Sartorius model CP225D), was loaded into a cylindrical glass tube (solid sample insert) covered with parafilm on one side and was submerged into the sample vial. After baseline stabilization at 25°C (±0.0005°C), the sample was released into the sample vial by means of a plunger. The heat output was recorded and integrated to calculate the enthalpy of solution. The precision of any individual measurement was better than 0.02 kJ mol−1 for three consecutive experiments and agreed with the standard value within ±0.03 kJ mol−1.
Enthalpy of Mixing
The enthalpy of mixing of solvents of the solvates with medium (phosphate buffer, pH 2, and methanol) was determined using a microreaction calorimeter. An amount of 1.5 mL of buffer was placed in each of the calorimetric vials with a stir bar in the reaction cell. The vials were sealed and placed in the instrument at 25°C with the stirring set to 200 rpm. A 100-μL syringe was loaded with the respective solvent of the solvate and placed in the instrument for 25 min for equilibration. The experiment was conducted using the titration mode of addition of an injection of 2 μL of solvent. An initial period of 100 s was allowed for baseline measurement with an injection interval of 600 s.
Aqueous Solubility Measurement
MSW-275 (Macro Scientific Works, New Delhi) shaker was used for measuring the aqueous solubility of solvates of nevirapine. Solubility studies were performed by adding 10 mg of nevirapine or its solvates in flasks containing 10 mL of phosphate buffer, pH 7, and were shaken at 37°C. The aliquots were withdrawn at 6, 12, 24, and 48 h, filtered through a 0.45-μm membrane filter, and analyzed spectrophotometrically at 237 nm (Perkin Elmer). The equilibration time was established as 24 h. The standard plot of nevirapine was prepared by dissolving a weighed amount of the drug in phosphate buffer, pH 7, suitably diluted, and absorbance taken at wavelength 237 nm on a spectrophotometer. E1%1 cm was calculated.
Solid phases remaining after 24 h were collected and analyzed by DSC and X-ray powder diffraction (XRPD).
Scanning Electron Microscopy
A Jeol JSM-6100 scanning electron microscope was used to obtain photomicrographs of nevirapine and its solvates. Samples were mounted on a metal stub with an adhesive and coated under vacuum with gold.
Dissolution Study
The powder dissolution studies were performed in 900 mL of phosphate buffer of pH 7 using USP Apparatus 2 (paddle method) in triplicate. The paddle rotation speed was 50 rpm, and a temperature of 37 ± 0.5°C was used in each study. The commercial sample or the solvate (50 mg) was introduced. The aliquots of 5 mL were withdrawn at 15, 30, 60, 90, and 120 min and then every 120 min until the absorbance of the solution became constant. The samples were filtered using a 0.45-mm Whatman filter and replaced with an equal volume of fresh medium to maintain a constant total volume. Samples were assayed by UV spectrophotometry at 237 nm.
RESULTS AND DISCUSSION
Thermal Properties of Solvates
The DSC in conjunction with TGA gives first-hand information to differentiate pseudopolymorph from a true polymorph. Desolvation/dehydration of the solid is accompanied by an endothermic peak indicating that the particular form is a solvate/hydrate. The position and energy of this endothermic peak depends upon the stability of the solvate (31). Percent mass loss in the TGA determines quantitatively the loss of solvent depending upon the stoichiometry of the solvate formed (32).
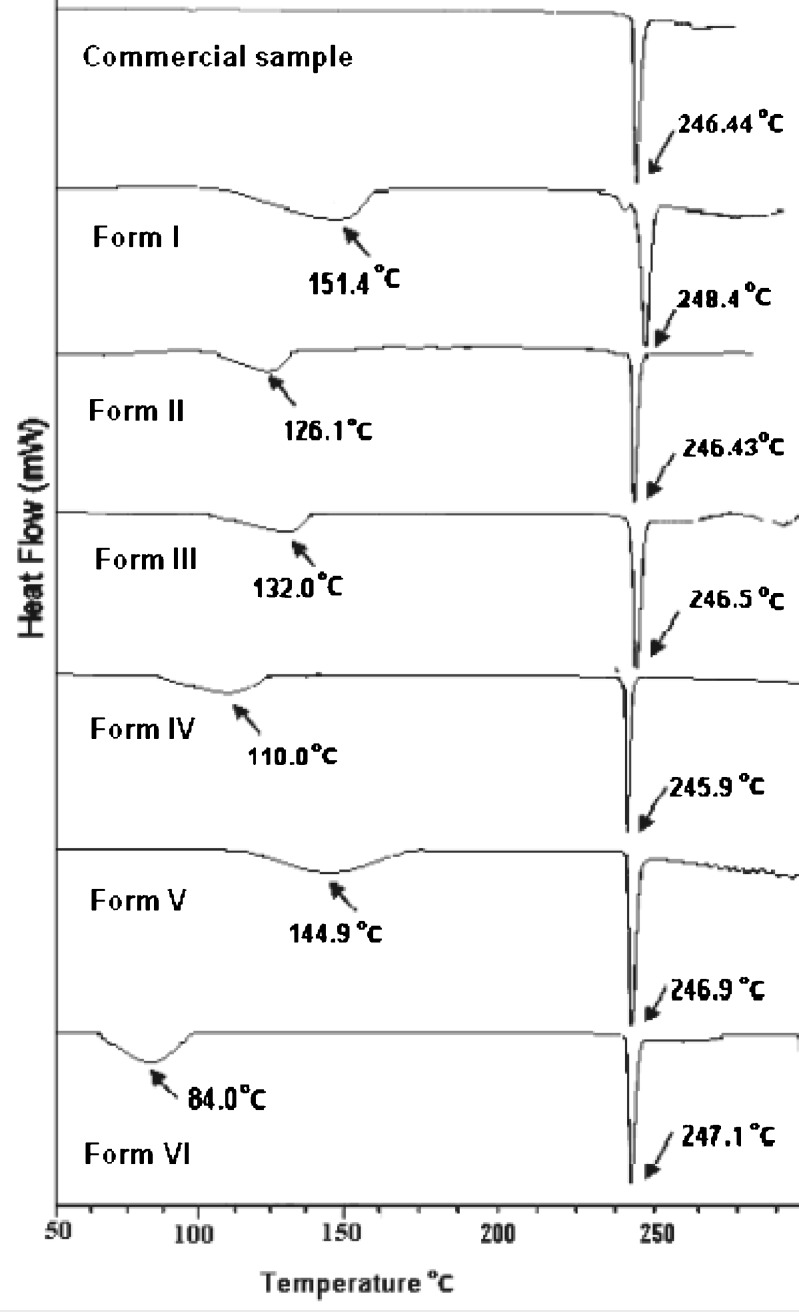
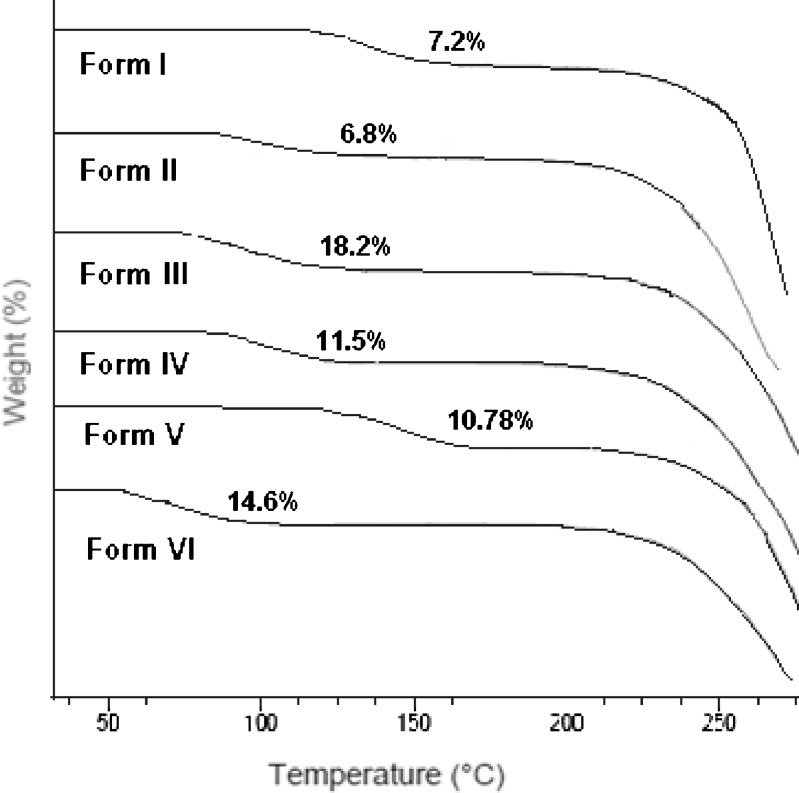
The DSC of the commercial sample (Fig. 2) shows a single sharp melting endotherm at 246.4°C, indicating that it is neither a hydrate nor a solvate, while all other forms show two endothermic events corresponding to desolvation and melting, respectively. The DSC thermogram of Form I obtained from absolute alcohol first showed an endothermic event over a wide range starting at 124.25°C and is accompanied by a mass loss of 7.2% in TGA (Fig. 3 and Table I). This is equivalent to the loss of 0.5 mol of ethanol per mole of the host compound. This is in contrast to the results reported by Pereira et al. (24) where no desolvation has been observed after recrystallization from 95% ethanol using water as antisolvent. The boiling point of the solvent (78.4°C) is much lower than the desolvation temperature, suggesting that the solvent molecule is entrapped into the interstitial spaces or it is tightly bound. The desolvation is succeeded by a very small endothermic peak prior to the melting and is attributed to solid–solid transition to a new polymorphic form which melts at 248.4°C, a temperature higher than the melting endotherm of commercial sample (33).
Fig. 2.
DSC thermograms of nevirapine and its solvated forms
Fig. 3.
TGA of solvated forms of nevirapine
Table I.
Thermodynamic Parameters Obtained from Differential Scanning Calorimetry and Thermogravimetric Analysis of Nevirapine and its Solvates
| Boiling point of the solvent (°C) | Desolvation temperature (°C) | Enthalpy of desolvation, Δdesolv H (kJ mol−1) | Melting point (°C) | Enthalpy of melting (J g−1) | Percentage mass loss on desolvation | Enthalpy of vaporization of pure solvent at 25°C (kJ mol−1) (48) | Enthalpy of desolvation per mole of solvent (kJ mol−1) | |||
|---|---|---|---|---|---|---|---|---|---|---|
| DSC | Calculated from Eq. 4 | Experimental | Calculated | |||||||
| Anhydrous nevirapine sample (NEV) | – | – | – | 246.44 | 142.6 | – | ||||
| Ethanolate (Form I) NEV+ (0.5) C2H5OH | 78.4 | 151.45 | 21.08 | 20.21 | 248.47 | 117.4 | 7.28 | 7.96 | 38.56 | 46.6 |
| Acetonitrilate (Form II)NEV+ (0.5) CH3CN | 82.0 | 126.10 | 18.90 | 22.64 | 246.43 | 141.9 | 6.85 | 7.16 | 33.22 | 39.8 |
| Chloroformate (Form III) NEV+ (0.5)CHCl3 | 62.0 | 132.09 | 16.34 | 13.65 | 246.51 | 133.7 | 18.27 | 18.31 | 31.4 | 32.67 |
| THF solvate (Form IV)NEV+ (0.5) THF | 66.0 | 110.01 | 19.15 | 7.37 | 245.93 | 137.4 | 11.56 | 11.92 | 32.0 | 39.50 |
| Mixed solvate of ethanol and water (Form V) NEV+ C2H5OH(0.5)+ H2O(0.5) | 78.4 + 100.0 | 144.98 | 23.67 | 27.6 | 246.90 | 147.9 | 10.78 | 10.73 | 20 + 19 | 56.7 |
| Toluene solvate (Form VI) NEV+ (0.5)Toluene | 111.0 | 84.00 | 15.54 | 22.29 | 247.16 | 138.0 | 14.65 | 14.75 | 38.06 | 31.28 |
Form II obtained from acetonitrile also shows a broad desolvation peak starting at 104.29°C; the corresponding TGA indicates a mass loss of 6.8% (calculated 7.2%), which suggest it to be 1:0.5 acetonitrile solvate. The other forms (Forms III and IV) show the desolvation at 110.73°C and 86.92°C accompanied by mass loss of 18.2% and 11.5%, respectively, in the TGA curves. The calculations show that Forms III and IV are chloroform and THF solvates, respectively, both with 1:0.5 stoichiometry. Form V obtained from ethanol using water as antisolvent gives a broad desolvation peak starting at 124.39°C with a mass loss of 10.78%. To confirm the quantity of water entrapped in the crystal form, Karl Fisher Aquametry was used, which showed 3.02% of water. This, along with the TGA results, points to mixed ethanol solvate hydrate (1:0.5:0.5 stoichiometry) as compared to the reported hemihydrate (34) or quarter hydrate (28) when crystallized from aqueous and water ethanol solution, respectively. The difference can be attributed to the different experimental conditions as water has been used only as antisolvent in the present study. It can be seen from Table I that the desolvation temperature in all these forms is much higher than the boiling point of the corresponding solvent.
The DSC thermogram of Form VI obtained from toluene shows a desolvation peak starting at 72.6°C, which is lower than the boiling point of toluene (111°C). The mass loss of 14.6% (calculated 14.7%) indicates it to be a toluene solvate with 1:0.5 stoichiometry. The binding energy (35–37) for the solvents in all the solvates have been calculated from the equation:
 |
1 |
where ΔHS (J mol−1) is the enthalpy of desolvation (or binding energy) per mole of the bound solvent, ΔHSexp (J g−1) is the enthalpy of desolvation per gram of the solvate, ΔmS% is the percentage mass loss, and MS is the molecular mass of the solvent.
The calculated values are given in Table I and compared with their corresponding enthalpy of vaporization. It can be seen that except for toluene solvate in all other cases, the solvent molecules are strongly bound in the host lattice compared to their interactions in the liquid state.
One interesting feature is that the melting peak of all the forms (Table I) which follows the desolvation endotherm appears at 246.5 ± 0.5°C, indicating that after desolvation, all the forms may convert to the same state. However, in Form I, prior to melting, there is the appearance of small endotherm suggesting a solid–solid transition, giving rise to a new polymorphic form which undergoes melting at 248.5°C. This form has lower heat of fusion but higher melting temperature, indicating enantiotropic transition of the desolvated state. No such form has been reported in the literature. However, two groups of workers have reported the existence of three polymorphs of nevirapine with mp of 247°C and 246°C for Form II and Form III, respectively (26,27). Melting temperature is not reported for Form I.
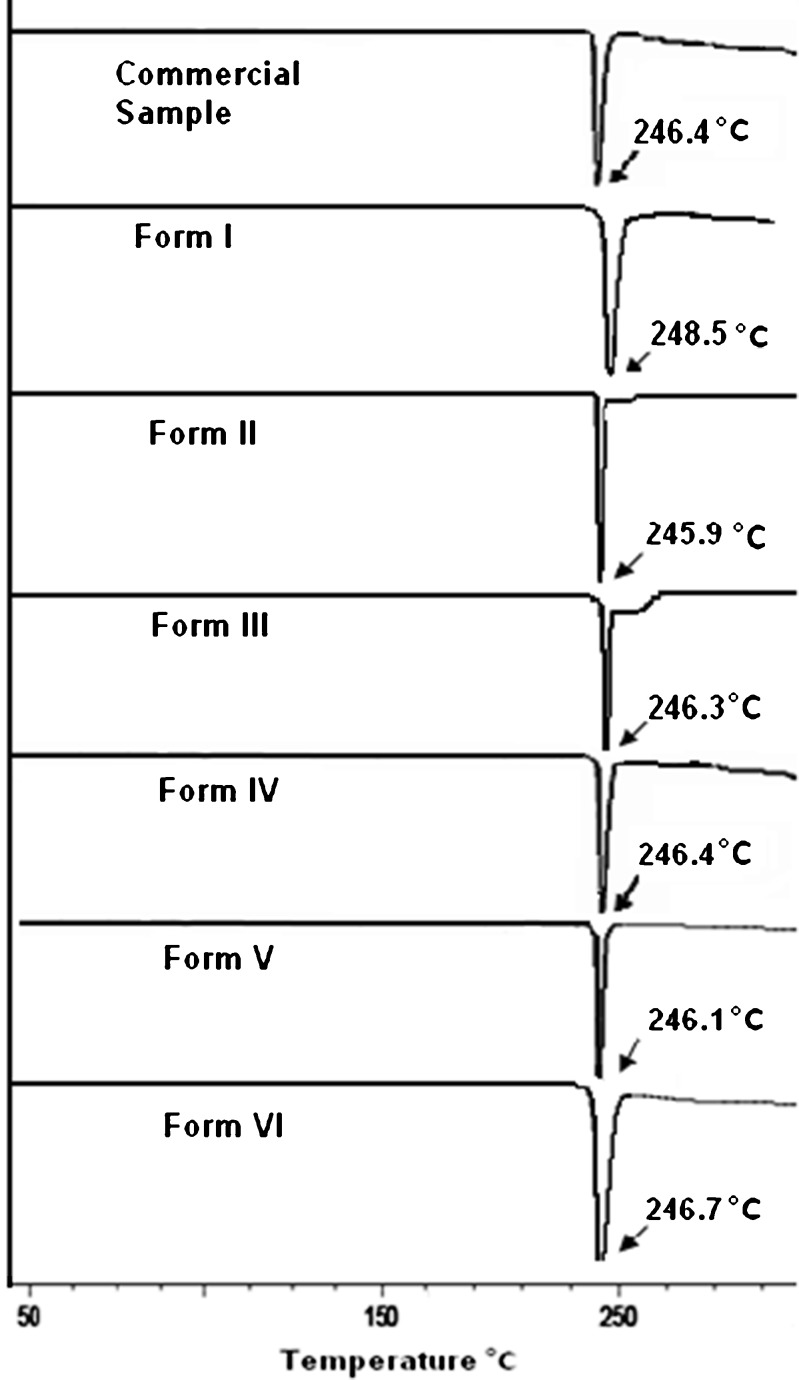
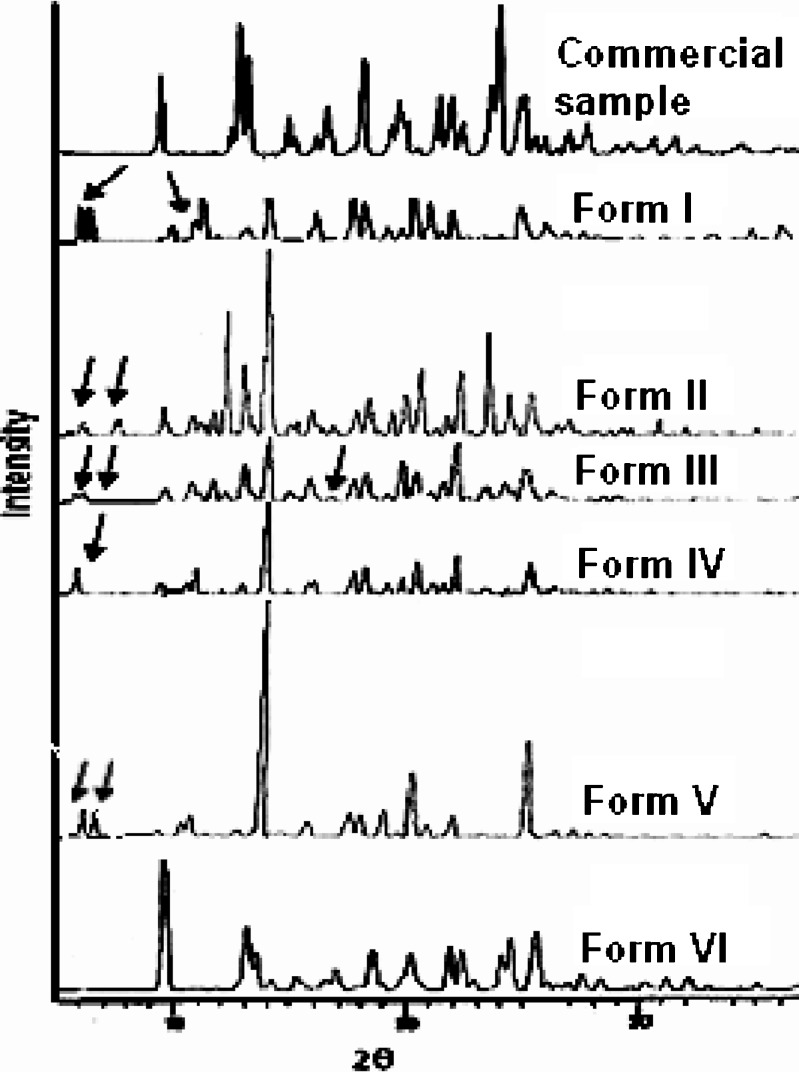
To characterize the desolvated forms, these solvates were heated below 245°C for an hour and cooled in desiccators. The DSC scans of these desolvated forms (Fig. 4) showed the presence of a single melting endotherm corresponding to 248.5°C, 245.9°C, 246.3°C, 246.3°C, 246.1°C and 246.7°C for Form I to VI respectively and the desolvation peak was absolutely absent (Fig. 4).
Fig. 4.
DSC thermograms of solvated forms of nevirapine after desolvation
X-Ray Powder Diffraction
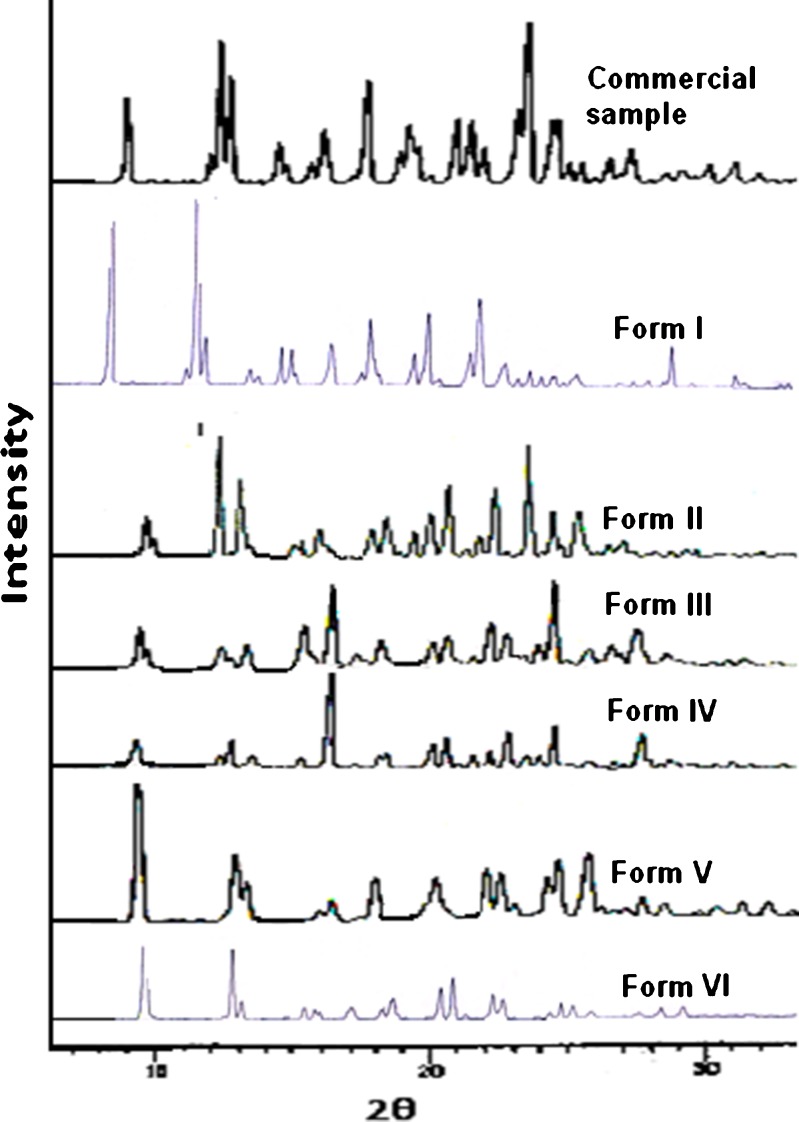
Figure 5 shows clear differences in the XRPD pattern of all the forms compared with the commercial sample. The 2θ value of the peak corresponding to 100% relative intensity has shifted from 25.6° in the commercial sample to approximately 14° in all the forms, except for Form VI where it appears at 9.4°. The peak corresponding to 100% relative intensity suggests a similar mode of inclusion of solvent molecule in the crystal lattice of nevirapine. However, in Form VI, this peak appears at 9.4°, suggesting a different mode of inclusion in this form. This is in agreement with the DSC results showing that toluene in this form has lower binding strength.
Fig. 5.
XRPD pattern of nevirapine and its solvated forms
A few additional peaks also appear in all the other solvates. In Form I, Form II, Form III, and Form V, two additional peaks appear at 5.2° and 5.5°, 5.6° and 7.2°, 5.2° and 5.8°, and 5.2° and 5.8°, whereas a single peak appears at 5.5° for Form IV. There is no peak in the commercial sample between 11° and 12° as well as in toluene solvate. But two peaks are observed at 10.5° and 11.3° in Form I, 10.7° and 11.8° in Form II, and at 10.8° and 11.8° in Form III. A new peak at 17.5° in Form III makes it different from the other forms. The area under the peak corresponding to 100% (∼14°) decreases in the order: Form V (17,931.9) > Form II (4,896.2) > Form VI (4,120.5) > commercial sample (4,056.8) > Form IV (2,921.5) > Form III (2,736.4) > Form I (1,678.4).
The XRPD pattern of Form I after desolvation by heating below 245°C also shows the disappearance of two characteristic peaks of this form at 5.2° and 5.5°. Besides this, some more difference in the diffraction patterns was also observed. This is because Form I after dehydration might have lost its original crystal structure. This form can be categorized as polymorphic solvate (33) and also supports the DSC results. The XRPD patterns of desolvated forms of all the other solvates are similar except for the disappearance of characteristic peaks of the solvate. Figure 6 shows the XRPD pattern of Forms I–VI after desolvation.
Fig. 6.
XRPD pattern of solvated forms of nevirapine after desolvation
Fourier Transform Infrared Spectrometry
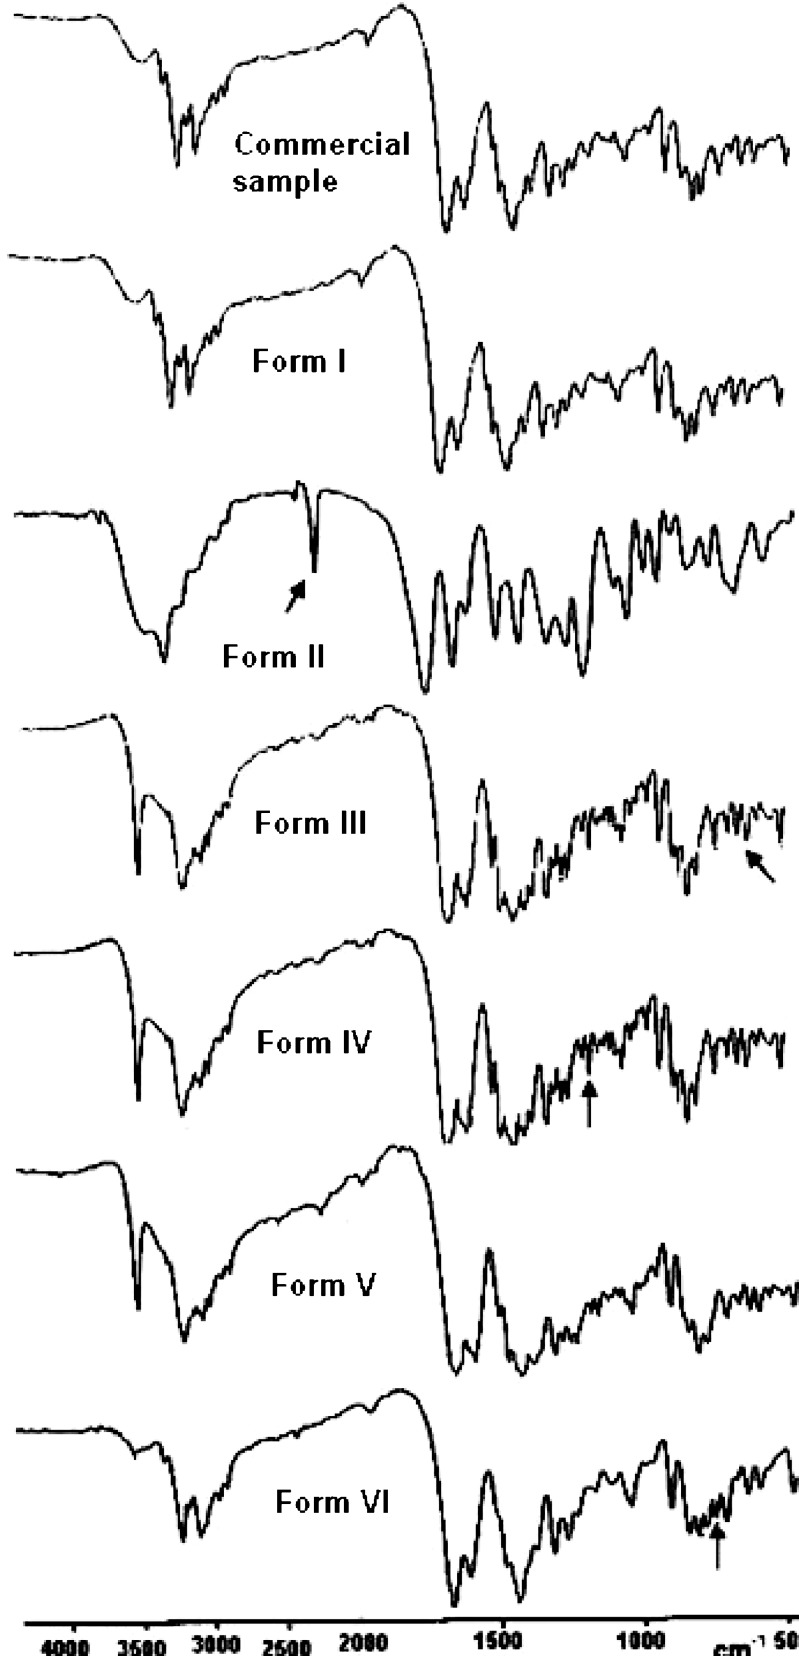
Differences in the FTIR spectra of nevirapine and all the forms indicate differences in their structure and therefore provide information regarding the intermolecular interactions within these solvates (Fig. 7). The solvates show absorption peaks attributable to the different solvents incorporated into the crystal lattice. The peak at 2,250.6 cm−1 in Form II is assigned to the nitrile stretching. Form III shows a peak at 547.7 cm−1, which may be assigned to the –C–Cl stretching, whereas Form IV shows the appearance of a peak at 1,143.8 cm−1 in the region of –C–O stretch. The peak at 730.4 cm−1 in Form VI is due to the presence of a monosubstituted benzene in the crystal lattice. Besides this, the –N–H stretch which appears at 3,449.4 cm−1 in the commercial sample shifts to a higher frequency (3,500 cm−1) in all the solvates. In Form I obtained from absolute alcohol, small differences in the carbonyl stretch and the –N–H bend were observed, whereas an entirely different pattern was observed for Form II. Strong distinctions for Form II are observed in the –C–H as well as the carbonyl region. The peak at 3,187.8 cm−1 shifts to 3,320 cm−1 and a new peak appears at 1,748.8 cm−1, suggesting Form II to be different from the commercial sample. In Form III, the –C–H stretch shifts to 3,193.1 cm−1 and the –C=O bend shifts to 1,379 cm−1 from 1,353.6 cm−1 in the commercial sample. In Form IV, the shifts in the –C–H stretch as well as –N–H bend were observed. The peak at 3,187.8 cm−1 shifts to 3,193.0 cm−1, whereas the peak at 1,587.2 cm−1 shifts to 1,582.5 cm−1. Form V also shows shifts in the –C–H and –C=O stretches. Besides this, small shifts in the –C–H stretch and carbonyl region were also observed.
Fig. 7.
FTIR spectra of nevirapine and its solvated forms
Microcalorimetric Study
Microreaction calorimetric studies were used to differentiate the solvates by determining their heat capacity as well as enthalpy of solutions.
Heat Capacity
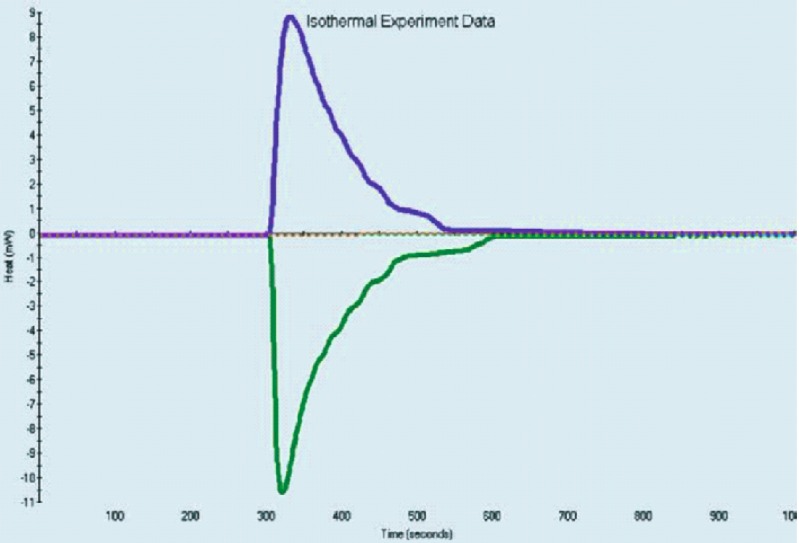
The comparison of molar heat capacities of solvates with the anhydrous drug gives information about the solvent molecule within the condensed phase solvates. The heat capacity of nevirapine and its various solvates was determined at 25°C, and the representative graph of heat capacity of hemi-ethanolate (Form I) of nevirapine is shown in Fig. 8. The molar heat capacity of the solvation (ΔCp) is calculated by Eq. 2 and is given in Table II. This value of ΔCp is further used in Eq. 4 to calculate the enthalpy of desolvation.
 |
2 |
where Cp(solvate) is the molar heat capacity of solvate, Cp(drug) is the molar heat capacity of nevirapine, and Cp(solvent) is the molar heat capacity of solvent in the liquid state.
Fig. 8.
Representative graph of heat capacity of Form I of nevirapine
Table II.
Molar Heat Capacities of the Solvate Formation 
| Heat capacity at 25°C (J g−1 K−1) | Molar heat capacity at 25°C (J/(mol K) | Molar heat capacity of solvent (J/(mol K) (24) | ΔC p at 25°C (J/(mol K) | |
|---|---|---|---|---|
| Anhydrous nevirapine sample (NEV) | 1.55 ± 0.014 | 412.76 ± 0.11 | – | – |
| Ethanolate (Form I) NEV+ (0.5) C2H5OH | 1.66 ± 0.024 | 480.29 ± 0.05 | 112.24 | 11.41 |
| Acetonitrilate (Form II)NEV + (0.5) CH3CN | 1.74 ± 0.003 | 499.07 ± 0.04 | 91.70 | 40.46 |
| Chloroformate (Form III) NEV+ (0.5)CHCl3 | 1.60 ± 0.027 | 520.61 ± 0.02 | 114.25 | 50.73 |
| THF solvate (Form IV)NEV+ (0.5) THF | 2.04 ± 0.004 | 616.79 ± 0.12 | 123.00 | 142.53 |
| Mixed solvate of ethanol and water (Form V) NEV+ C2H5OH(0.5)+ H2O(0.5) | 2.05 ± 0.019 | 611.59 ± 0.12 | 187.48 | 105.09 |
| Toluene solvate (Form VI) NEV+ (0.5)Toluene | 1.63 ± 0.007 | 509.16 ± 0.05 | 155.96 | 18.42 |
It can be seen that ΔCp for all the solvates is positive. Its magnitude is very high for Form IV (THF solvate) and Form V (mixed ethanol–water solvate). THF is known to show high heat capacity in clathrates due to free rotation, hindered rotation, and its presence in highly disoriented states (38). This suggests that in solvates with large ΔCp, the solvent molecules are present in lattice channels. It is also possible that the measured heat capacity for the solvates is actually Cs (solvate in equilibrium with the solvate vapor) and not Cp. It is well known that Cs is always greater than Cp (39).
Enthalpy of Solution
Enthalpy of solution was used to differentiate the various solvates by comparing the molar enthalpies of solution (Table III). This approach works on the basis that the enthalpy of solution is closely associated with the lattice energy. If a compound exists in two or more forms with different lattice energy, the enthalpy of solution in a common solvent will differ (40). Molar enthalpy of solution (ΔsolH) was determined in phosphate buffer, pH 2, as well as methanol (Fig. 9).
Table III.
Enthalpies of Solution in Phosphate Buffer (pH 2) and Methanol at 25°C, Solubility, Enthalpies of Solvation of Nevirapine and its Solvates
| Solubility in phosphate buffer, pH 7 (mg/mL, Ssol, pH 7) | Molar enthalpy of solution (kJ mol−1) | Molar enthalpy of mixing of solvent of the solvate (kJ mol−1) | Enthalpy of solvation Δsolv H (kJ mol−1) | Molar enthalpy of solution in its own solvent (kJ mol−1) | ||||
|---|---|---|---|---|---|---|---|---|
| Phosphate buffer (pH 2, Δsol H) | Methanol Δsol H (methanol) | Phosphate buffer (pH 2) Δmix H (buffer) | Methanol Δmix H (methanol) | Solvates (Δsol H 2) | Nevirapine (Δsol H 1) | |||
| Anhydrous nevirapine sample (NEV) | 0.133 ± 0.09 | −5.91 | 5.80 | – | – | – | – | – |
| Ethanolate (Form I) NEV+ (0.5) C2H5OH | 0.229 ± 0.06 | −14.14 | −2.58 | −0.108 | −0.008 | −2.37 | 8.44 | 6.07 |
| Acetonitrilate (Form II)NEV+ (0.5) CH3CN | 0.135 ± 0.04 | −3.14 | 8.62 | 0.289 | −0.012 | −10.12 | 35.26 | 25.14 |
| Chloroformate (Form III) NEV+ (0.5) CHCl3 | 0.201 ± 0.07 | −12.83 | −1.18 | 0.314 | −0.201 | −3.40 | 5.60 | 2.20 |
| THF solvate (Form IV)NEV+ (0.5) THF | 0.197 ± 0.04 | −11.31 | 0.50 | −0.219 | 0.109 | −3.49 | 2.05 | −1.44 |
| Mixed solvate of ethanol and water (Form V) NEV+ C2H5OH(0.5) + H2O(0.5) | 0.130 ± 0.06 | −2.83 | 8.88 | −0.108 | −0.008 | −20.70 | 15.31 | −5.39 |
| Toluene solvate (Form VI) NEV+(0.5) Toluene | 0.153 ± 0.06 | −5.32 | 6.32 | 0.197 | 0.344 | −4.35 | 20.02 | 15.67 |
Fig. 9.
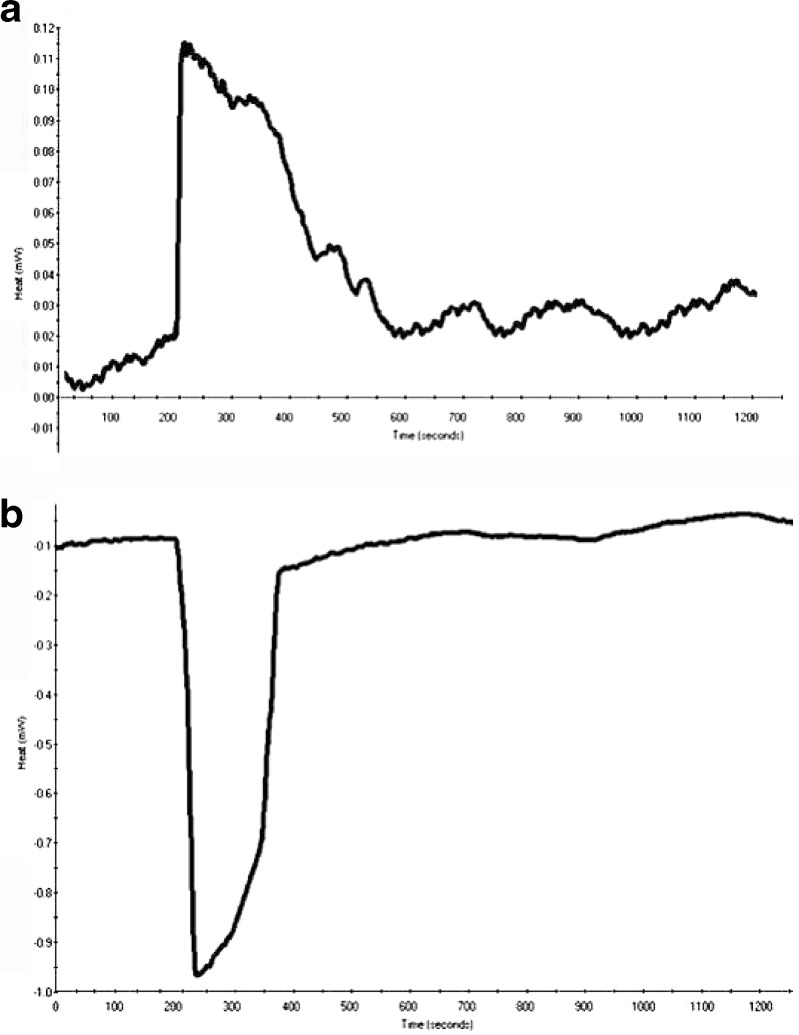
Representative graph of enthalpy of solution of Form I of nevirapine in a phosphate buffer, pH 2, and b methanol
As all the forms are solvates, there is every possibility that solvent entrapped in the crystal lattice will be released after the particular solvate will go into the solution. The contribution of the heat of mixing of released solvent in buffer/methanol toward total enthalpy of solution is negligible as its mole fraction is only 0.003 in comparison to the solvent used for measuring the enthalpy of solution. The literature survey for enthalpy of mixing of ethanol acetonitrile, chloroform, tetrahydrofuran, and toluene with water has shown negligible enthalpy of mixing. Anyhow, to further support our results, the enthalpy of mixing of various solvents which are released during the determination of enthalpy of solution with buffer was also determined in a separate experiment. The molar enthalpy of mixing (ΔmixH) was calculated and is given in Table III. It can be seen that enthalpy of mixing in phosphate buffer, pH 2, is endothermic for acetonitrile, chloroform, and toluene, whereas it is exothermic for ethanol and tetrahydrofuran. This trend is in agreement with the literature where the enthalpy of mixing of ethanol (41), acetonitrile (42), and tetrahydrofuran (43) with water has been reported. The numerical value of ΔmixH of solvent in buffer is very small and can be neglected. Similarly, the ΔmixH of solvent in methanol is exothermic for chloroform and acetonitrile, whereas endothermic for tetrahydrofuran and toluene in agreement with the literature values of acetonitrile (44), chloroform (45), tetrahydrofuran (46), and toluene (47) and the absolute value is also very small.
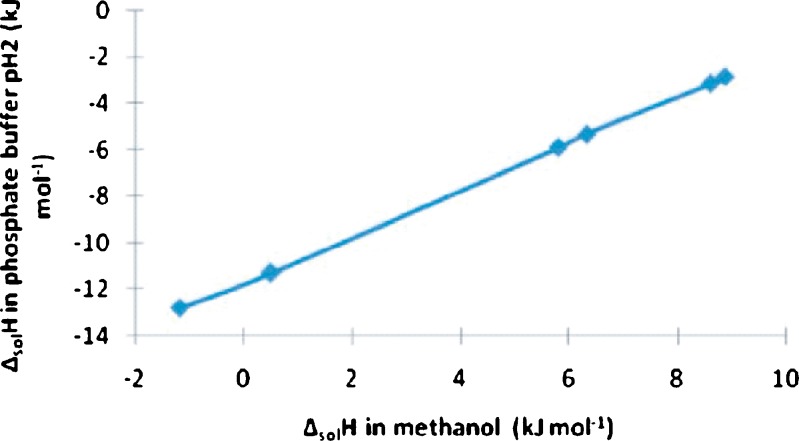
All the forms showed exothermic behavior in phosphate buffer (pH 2), but in methanol, all the forms except Forms I and III behaved endothermically (Table III). The difference in the enthalpy of solution is due to the difference in the lattice energy of the solids. The enthalpies of solution for all the forms are in the same order in both the solvents. The plot between the enthalpies of solution in the two solvents is given in Fig. 10. It is a straight line, confirming perfect correlation between two sets of data.
Fig. 10.
Plot between enthalpy of solution of various forms of nevirapine in phosphate buffer, pH 2, and in methanol
Form V obtained from ethanol using water as antisolvent was least exothermic (−2.83 kJ mol−1) in buffer and exhibited the highest endothermicity (8.88 kJ mol−1) in methanol, suggesting it to have the highest lattice energy. The magnitude of molar enthalpy of solution of Form I obtained from ethanol is found to be highest (−14.14 kJ mol−1) in phosphate buffer (pH 2), exhibiting maximum ease of molecular release from the lattice. This is further confirmed when the ethanolate behaved exothermically (−2.58 kJ mol−1) in methanol. The exothermic behavior of enthalpy of solution in buffer is probably due to the protonation of the drug at pH 2. The pKa of nevirapine is 2.8, and at experimental pH, ∼86% of the drug will be in protonated form, leading to the evolution of heat resulting in exothermic process. Besides this, the ion–dipole interaction between the drug and water molecules is also responsible for the exothermic behavior. The difference in molar enthalpy of solution among all the solvates is in order of enthalpy of fusion of these forms. As discussed above, the decrease in exothermic ΔsolH in buffer and increase in endothermic/exothermic in methanol follows the order: Form I, Form III, Form IV, Form VI, Form II, Form V. The corresponding heat of fusion increases in the same order (Table III). This is because both properties in principle indicate molecular interaction in the crystal phase. In order to determine the enthalpy associated with the solvation process, the enthalpy of solution of a particular solvate was determined in its own solvent. The enthalpy of solvation was calculated by Eq. 3 and the values are given in Table III.
 |
3 |
where ΔsolH2 is the enthalpy of solution of the drug and ΔsolH1 is the enthalpy of solution of the solvate in solvent of solvation.
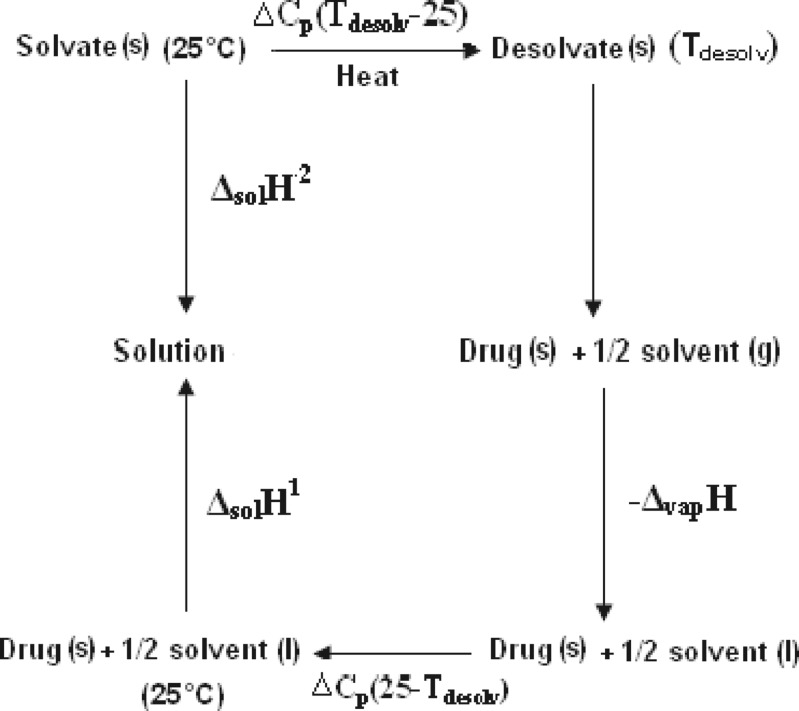
In the thermodynamic cycle given in Fig. 11, the enthalpies of solution of the drug and the solvate, the enthalpy of vaporization of the solvent, and the heat capacities of the drug, solvate, and the solvent are known. Further assuming that heat capacities remain constant during the temperature range of 25°C to Tdesolv, the enthalpy of desolvation is given by Eq. 4:
 |
4 |
Fig. 11.
Thermodynamic cycle depicting desolvation process
The measured values of enthalpy of desolvation from DSC and those calculated from Eq. 3 are compared in Table I. The agreement seems to be reasonable in spite of several assumptions, and the measured heat capacity for the solvates may be Cs and not Cp.
Solubility Study
Solubility of different solvates (Ssol, pH 7) was determined and then compared statistically using Tukey’s test. Solubility data in phosphate buffer, pH 7, at 37°C are given in Table III. The average solubility determined for nevirapine crystals was 0.133 ± 0.09 mg/mL. The solubility study suggests that the most crystalline form (Form V) was least soluble (0.130 ± 0.06 mg/mL), while the least crystalline form obtained from ethanol was most soluble, with a 1.7 times increase in solubility in comparison with the commercial sample. The DSC and XRPD analyses of the solids obtained from the solubility experiment demonstrate the residues to be in their original forms, except toluenate (Form VI), which indicates that the solvates are stable.
Morphology of Solvates
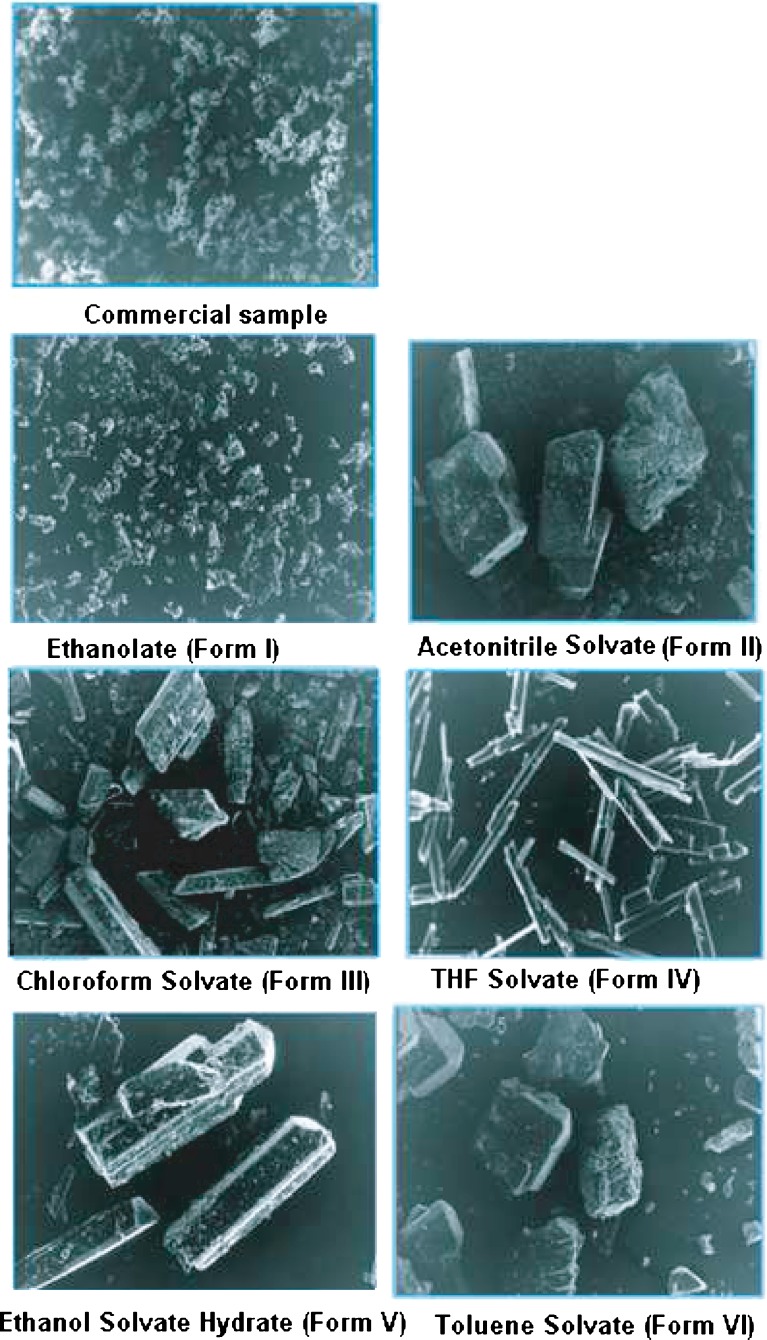
The difference in morphology was confirmed by studying the shape and appearance by scanning electron microscopy (Fig. 12). The commercial sample and ethanolate (Form I) showed the absence of any crystal habit. Similarly, Form III was not clearly defined. The ethanol solvate hydrate (Form V) showed elongated crystals with the appearance of both small- and large-sized fractions in the photomicrographs. This may be attributed to the different rate of evaporation of solvents because of the added antisolvent during the crystallization process. The crystals of Form II (acetonitrile solvate) and Form VI (toluene solvate) showed lamellar crystal habit. As far as crystal shapes are concerned, both these forms did not show any general and characteristic change in shape, although other properties are different. Form IV obtained from THF showed pointed needles.
Fig. 12.
Scanning electron micrographs of nevirapine and its solvated forms
Dissolution Study
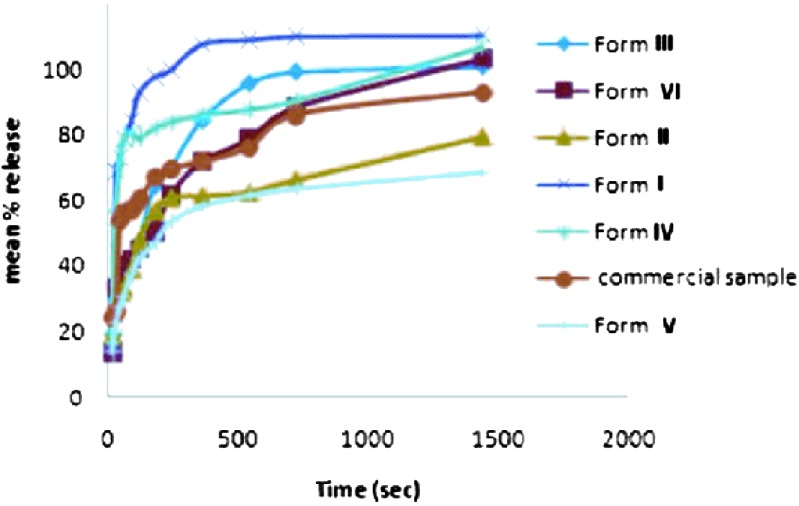
The powder dissolution curves of different solvates showed major differences in the rates of dissolution and are in agreement with the order of crystallinity, heat of solution, and solubility results. The dissolution profiles of all the forms are compared in Fig. 13. The dissolution rate of the least crystalline Form I was highest in buffered aqueous solution.
Fig. 13.
Dissolution profile of nevirapine and its solvated forms at 37°C
CONCLUSIONS
The characterization of crystalline solvated forms of nevirapine has shown that the entrapment of the solvent molecules in the cavities formed by the host drug can lead to the formation of six solvates with different physicochemical properties. The thermal analysis by DSC and solution calorimetry provides complete information to characterize the solvates formed. Desolvation of Form I probably gives rise to a new polymorphic form which is under further investigation. All the forms were exothermic in phosphate buffer pH 2, and the magnitude follows the order: Form V < Form II < Form VI < commercial sample < Form IV < Form III < Form I, exhibiting maximum ease of molecular release from lattice for Form I. This Form I with low crystallinity exhibited higher solubility and dissolution rate. Thus, the present work shows that the determination of enthalpy of solution is a useful approach for evaluating the relative crystallinity as well as the solubility of the various crystalline forms of a pharmaceutical solid.
Acknowledgments
The financial support provided by DST, New Delhi, is gratefully acknowledged.
References
- 1.Borka L. Review on crystal polymorphism of substances in the European pharmacoepiea. Pharm Acta Helv. 1991;66:16–22. [PubMed] [Google Scholar]
- 2.Haleblian JK. Characterization of habits and crystalline modifications of solids and their pharmaceutical applications. J Pharm Sci. 1975;64:1269–88. doi: 10.1002/jps.2600640805. [DOI] [PubMed] [Google Scholar]
- 3.Byrn S, Pfeiffer R, Ganey M, Hoiberg C, Poole JW, Poochikian G. Pharmaceutical solids: strategic approach to regulatory considerations. Pharm Res. 1995;12:945–54. doi: 10.1023/A:1016241927429. [DOI] [PubMed] [Google Scholar]
- 4.Hilfiker R, Blatter F, Raumer MV. Relevance of solid-state properties for pharmaceutical products. In: Hilfiker R, editor. Polymorphism in the pharmaceutical industry. Weinheim: Wiley-VCH; 2006. pp. 1–19. [Google Scholar]
- 5.Sheth AR, Grant DJW. Relationship between the structure and properties of pharmaceutical crystals. Kona. 2005;23:39–47. [Google Scholar]
- 6.De Armas HN, Peeters OM, Den Mooter GV, Blaton N. Polymorphism of alprazolam (Xanax®): a review of its crystalline phases and identification, crystallographic characterization and crystal structure of a new polymorph (form III) J Pharm Sci. 2007;96:1114–30. doi: 10.1002/jps.20930. [DOI] [PubMed] [Google Scholar]
- 7.Singh D, Marshall PV, Shields L, York P. Solid-state characterization of chlordiazepoxide polymorphs. J Pharm Sci. 2000;87:655–62. doi: 10.1021/js960385c. [DOI] [PubMed] [Google Scholar]
- 8.Hilfiker R, editor. Polymorphism in pharmaceutical industry. Weinheim: Wiley-VCH. p. 414.
- 9.Bernstein J, editor. Polymorphism in molecular crystals. Oxford: Oxford University Press. p. 410.
- 10.Rustichellia C, Gamberini G, Feriolia V, Gamberinia MC, Ficarrab R, Tommasinic S. Solid state study of polymorphic drug: carbamazepine. J Pharm Biomed Anal. 2000;23:41–54. doi: 10.1016/S0731-7085(00)00262-4. [DOI] [PubMed] [Google Scholar]
- 11.Van Tonder C, Mahlatji MD, Malan SF, Liebenberg W, Caira MR, Song M, et al. Preparation and physicochemical characterization of 5 niclosamide solvates and 1 hemisolvate. AAPS Pharm Sci Tech. 2004;5:Article 12. doi: 10.1007/BF02830580. [DOI] [PMC free article] [PubMed] [Google Scholar]
- 12.Chadha R, Arora P, Kaur R, Saini A, Singla ML, Jain DVS. Characterization of solvatomorphs of methotrexate using thermoanalytical and other techniques. Acta Pharm. 2009;59:245–7. doi: 10.2478/v10007-009-0024-9. [DOI] [PubMed] [Google Scholar]
- 13.McGregor C, Saunders MH, Buckton MH, Saklatvala RD. The use of high-speed differential scanning calorimetry (Hyper-DSC™) to study the thermal properties of carbamazepine polymorphs. Thermochim Acta. 2004;417:231–7. doi: 10.1016/j.tca.2003.09.031. [DOI] [Google Scholar]
- 14.Byrn SR, Pfeiffer RR, Stephenson G, Grant DJW, Gleason WB. Solid state pharmaceutical chemistry. Chem Mater. 1994;6:1148–58. doi: 10.1021/cm00044a013. [DOI] [Google Scholar]
- 15.Brittain HG. Spectral methods for the characterization of polymorphs and solvates. J Pharm Sci. 1997;86:405–12. doi: 10.1021/js960238e. [DOI] [PubMed] [Google Scholar]
- 16.Bugay DE. Characterization of the solid-state: spectroscopic techniques. Adv Drug Deliv Rev. 2001;48:43–65. doi: 10.1016/S0169-409X(01)00101-6. [DOI] [PubMed] [Google Scholar]
- 17.Giron D. Thermal analysis, microcalorimetry and combined techniques for the study of pharmaceuticals. J Therm Anal Calorim. 1999;56:1285–304. doi: 10.1023/A:1010194020563. [DOI] [Google Scholar]
- 18.Giron D. Applications of thermal analysis and coupled techniques in pharmaceutical industry. J Therm Anal Calorim. 2002;68:335–57. doi: 10.1023/A:1016015113795. [DOI] [Google Scholar]
- 19.Urakami K. Characterization of pharmaceutical polymorphs by isothermal calorimetry. Curr Pharm Biotechnol. 2005;6:193–203. doi: 10.2174/1389201054022904. [DOI] [PubMed] [Google Scholar]
- 20.Yadav MR, Shaikh AR, Ganesan V, Giridhar R, Chadha R. Studies on the crystal forms of pefloxacin: preparation, characterization and dissolution profile. J Pharm Sci. 2008;97:2637–2648. doi: 10.1002/jps.21178. [DOI] [PubMed] [Google Scholar]
- 21.Budavari S, editor. The Merck index, an encyclopedia of chemicals, drugs, and biological. Rahway: Merck; 1996. p. 1114.
- 22.Kasim NA, Whitehouse M, Ramachandran C, Bermejo M, Lennernas H, Hussain AS, et al. Molecular properties of WHO essential drugs and provisional biopharmaceutical classification. Mol Pharm. 2004;1:85–96. doi: 10.1021/mp034006h. [DOI] [PubMed] [Google Scholar]
- 23.Lamson MJ, Sabo JP, MacGregor TR, Pav JW, Rowland L, Hawi A, et al. Single dose pharmacokinetics and bioavailability of nevirapine in healthy volunteers. Biopharm Drug Dispos. 1999;20:285–91. doi: 10.1002/(SICI)1099-081X(199909)20:6<285::AID-BDD187>3.0.CO;2-V. [DOI] [PubMed] [Google Scholar]
- 24.Pereira BG, Fonte-Boa FD, Resende JALC, Pinheiro CB, Fernandes NG, Yoshida MI, Vianna-Soares CD. Pseudopolymorphs and intrinsic dissolution of nevirapine. Cryst Growth Des. 2007;7:2016–23. doi: 10.1021/cg0704495. [DOI] [Google Scholar]
- 25.Babra RS, Christopher PP, Adivaraha J, Adam JM, Nair RH. General principles of pharmaceutical solid polymorphism: a supramolecular perspective. Adv Drug Deliv Rev. 2004;56:241–74. doi: 10.1016/j.addr.2003.10.005. [DOI] [PubMed] [Google Scholar]
- 26.Reguri BR, Chakka R. Crystalline forms of nevirapine. United States Patent 0183738 A1 (2006). Accessed 17 August 2006.
- 27.Reguri BR, Chakka R. Novel crystalline forms of 11-cyclopropyl-5,11-dihydro-4-methyl-6H-dipyrido[3,2-b:2′,3′-e][1,4]diazepin-6-one (Nevirapine). United States Patent 0059653A1 (2005). Accessed 17 March 2005.
- 28.Sarkar M, Perumal OP, Panchagnula R. Solid-state characterization of nevirapine. Int J Pharm Sci. 2008;70:619–30. doi: 10.4103/0250-474X.45401. [DOI] [PMC free article] [PubMed] [Google Scholar]
- 29.Caira MR, Stieger N, Liebenberg W, De Villiers MM, Samsodien H. Solvent inclusion by the anti-HIV drug nevirapine: X-ray structures and thermal decomposition of representative solvates. Cryst Growth Des. 2008;8:17–23. doi: 10.1021/cg070522r. [DOI] [Google Scholar]
- 30.Christian GD. Analytical chemistry. 4. New York: Wiley; 1986. [Google Scholar]
- 31.Giron D. Thermal analysis and calorimetric methods in the characterization of polymorphs and solvates. Thermochim Acta. 1995;248:1–59. doi: 10.1016/0040-6031(94)01953-E. [DOI] [Google Scholar]
- 32.Giron D, Goldbronn C, Mutz M, Pfeffer S, Piechon P, Schwab P. Solid state characterization of pharmaceutical hydrates. J Therm Anal. 2002;68:453–65. doi: 10.1023/A:1016031517430. [DOI] [Google Scholar]
- 33.Kristl A, Srcic S, Vrecer F, Sustar B, Vojnovic D. Polymorphism and pseudopolymorphism: influencing the dissolution properties of the guanine derivative acyclovir. Int J Pharm. 1996;139:231–5. doi: 10.1016/0378-5173(96)04601-7. [DOI] [Google Scholar]
- 34.Khankuri RK, Grant DJW. Pharmaceutical hydrates. Thermochim Acta. 1995;248:61–79. doi: 10.1016/0040-6031(94)01952-D. [DOI] [Google Scholar]
- 35.Othman A, Evans JSO, Evans IR, Harris RK. Structural study of polymorphs and solvates of finasteride. J Pharm Sci. 2007;96:1380–97. doi: 10.1002/jps.20940. [DOI] [PubMed] [Google Scholar]
- 36.Caira MR, Bettinetti G, Sorrenti M, Catenacci L. Relationships between structural and thermal properties of anhydrous and solvated crystalline forms of Brodimoprim. J Pharm Sci. 2007;96:996–1007. doi: 10.1002/jps.20934. [DOI] [PubMed] [Google Scholar]
- 37.Caira MR, Bettinetti G, Sorrenti M. Structural relationships, thermal properties and physicochemical characterization of anhydrous and solvated crystalline forms of tetroxoprim. J Pharm Sci. 2002;91:467–81. doi: 10.1002/jps.10034. [DOI] [PubMed] [Google Scholar]
- 38.White MA, Mac Lean MI. Rotational freedom of guest molecule in tetrahydrofuran clathrate as determined by heat capacity measurements. J Phys Chem. 1985;89:1380–3. doi: 10.1021/j100254a014. [DOI] [Google Scholar]
- 39.Glasser L, Jenkins HDB. The thermodynamic solvate difference rule: solvation parameters and their use in interpretation of the role of bound solvent in condensed phase solvates. Inorg Chem. 2007;46:9768–78. doi: 10.1021/ic701105p. [DOI] [PubMed] [Google Scholar]
- 40.Gu CH, Grant DJW. Estimating the relative stability of polymorphs and hydrates from heats of solution and solubility data. J Pharm Sci. 2001;90:1277–87. doi: 10.1002/jps.1080. [DOI] [PubMed] [Google Scholar]
- 41.Brower KR, Peslak J, Jr, Elrod J. A correlation of molecular flexibility with volume and heat of mixing of organic solutes with water and glycol-water mixture. J Phys Chem. 1969;78:207–11. doi: 10.1021/j100721a033. [DOI] [Google Scholar]
- 42.Wakisaka A, Abdoul-Carime H, Yamamoto Y, Kiyozumi Y. Non-ideality of binary mixtures: water.methanol and water.acetonitrile from the viewpoint of clustering structure. J Chem Soc. 1998;94:369–374. [Google Scholar]
- 43.Kiyohara O, Benson G. Excess enthalpies and volumes of water + tetrahydrofuran mixtures at 298.15 M−1. Can J Chem. 1977;55:1354–1359. doi: 10.1139/v77-187. [DOI] [Google Scholar]
- 44.Nagata I, Tamura K. Excess enthalpies of binary and ternary mixtures of acetonitrile with methanol, ethanol and benzene. Fluid Phase Equilib. 1985;24:289–306. doi: 10.1016/0378-3812(85)85010-X. [DOI] [Google Scholar]
- 45.Singh PP, Sharma BR, Sidhu KS. Thermodynamics of chloroform and methanol mixtures. Can J Chem. 1979;57:387–93. doi: 10.1139/v79-065. [DOI] [Google Scholar]
- 46.Parveen S, Singh S, Shukla D, Gupta M, Shukla JP. Molecular interaction study of binary mixtures of THF with methanol and o-cresol—an optical and ultrasonic study. Acta Phys Pol A. 2009;116:1011–1017. [Google Scholar]
- 47.Coxam JY. Excess enthalpies of (toluene+methanol or heptane or ethylcyclohexane) and of (heptanes+methylcyclohexane) at the temperatures 255.4 K and 310.9 K and the pressure 13.8 MPa. J Chem Thermodynamics. 1995;27:1133–9. doi: 10.1006/jcht.1995.0117. [DOI] [Google Scholar]
- 48.Reddick JA, Bunger WB, Sankano TK. Organic solvents: physical properties and methods of purification. In: Weissberger A, editor. Techniques of chemistry, vol II, 4th ed. Terre Haute: Wiley Interscience; 1986. p. 73–730.


