

Abstract
Chemical coupling of polyethylene glycol (PEG) to proteins or particles (PEGylation), prolongs their circulation half-life by greater than 50-fold, reduces their immunogenicity, and also promotes their accumulation in tumors due to enhanced permeability and retention effect. Herein, phase separation method was used to prepare bovine serum albumin (BSA) nanoparticles. PEGylation of BSA nanoparticles was performed by SPA activated mPEG through their free amino groups. Effect of process variables on PEGylation efficiency of BSA nanoparticles was investigated and optimized through response surface methodology with the amount of free amino groups as response. Optimum conditions was found to be 32.5 g/l of PEG concentration, PEG-nanoparticle incubation time of 10 min, incubation temperature of 27°C, and pH of 7 for 5 mg of BSA nanoparticles in 1 mL phosphate buffer. Analysis of data showed that PEG concentration had the most noticeable effect on the amount of PEGylated amino groups, but pH had the least. Mean diameter and zeta potential of PEGylated nanoparticles under these conditions were 217 nm and −14 mV, respectively. In conclusion, PEGylated nanoparticles demonstrated reduction of the negative surface charge compared to the non modified particles with the zeta potential of −31.7 mV. Drug release from PEGylated nanoparticles was almost slower than non-PEGylated ones, probably due to existence of a PEG layer around PEGylated particles which makes an extra resistance in opposition to drug diffusion.
KEY WORDS: 5-fluorouracil, BSA nanoparticle, PEGylation optimization, response surface method (RSM)
INTRODUCTION
The field of drug delivery is fast expanding, and its potentials have already been proven by the many products in the market. Colloidal drug delivery systems (CDDS) such as nano-structures have been developed in order to improve the efficiency and the specificity of drug action. Their small size permits them to be injected intravenously to reach target tissues. Among them, nanoparticulate systems based on proteins have gained much interest because of their inherent properties of biodegradability, lack of toxicity, and nonantigenicity (1,2). Protein nanoparticles may be used as a matrix in which a wide variety of drugs can be physically entrapped (3–5). In contrast to other nanoparticulate systems, they offer the benefit of carrying functional groups such as amino and carboxylic groups that can be used for surface modification (6–8). However, it is known that they can be rapidly removed from the blood circulation by the action of the immune system. CDDS are removed via the complement system and via the cells of the mononuclear phagocyte system, after their recognition by opsonins and/or receptors present at the cell surface. This recognition is dependent on the physicochemical characteristics of the CDDS (9–12).
There are quite a few important reasons for making long-circulating drug carriers. One of them is to maintain a required level of pharmaceutical agent in the blood for extended time intervals. Then, long-circulating drug-loaded nanoparticles can slowly accumulate in pathological sites with affected and leaky vasculature and facilitate drug delivery in those areas. This phenomenon known as enhanced permeability and retention effect has also been termed as passive targeting or accumulation via an impaired filtration mechanism (13–15). In addition, the prolonged circulation can help to achieve a better targeting for targeted drug carriers by providing more time for their interaction with the target (16).
Chemical modification of pharmaceutical nanocarriers with certain synthetic polymers, such as polyethylene glycol (PEG), is the most frequent way to impart the in vivo longevity to drug carriers, as was first suggested for liposomes (17–21). This polymer is nontoxic, non-immunogenic, non-antigenic, highly soluble in water, and FDA approved (22). Hydrophilic polymers have been shown to protect individual molecules and solid particulates from interaction with different solutes. The term “steric stabilization” has been introduced to describe the phenomenon of polymer-mediated protection (23). On the biological level, coating nanoparticles with PEG (PEGylation) sterically hinders interaction of blood components with their surface and reduces the binding of plasma protein with PEGylated nanoparticles (24–29). This prevents drug carrier’s interaction with opsonins and slows down their fast capture by Reticuloendothelial System (30).
In the present study, bovine serum albumin (BSA) was used for the preparation of nanoparticles because of its well-defined primary structure combined with the advantage of enabling surface modification. Nanoparticles prepared from BSA are versatile carrier systems for drug delivery and can be prepared by an established desolvation process (31,32). BSA offers several target sites for covalent modification such as the free amino groups. Since there is no comprehensive study in the literature concerning the influence of process variables on the protein nanoparticles PEGylation, the effect of process variables on the PEGylation efficiency was investigated and optimum condition for preparing PEGylated nanoparticles was determined using response surface methodology considering the amount of free amino groups as response. Then, 5-fluorouracil (5-FU) was used as a model drug for the investigation of PEGylation effect on drug release profile assessed by a continuous flow method.
MATERIALS AND METHODS
Materials
BSA (fraction V, minimum 98%), glutaraldehyde 8% solution, 2,4,6-trinitrobenzene sulfonic acid (TNBS) 5% aqueous solution, and 5-fluorouracil were purchased from Sigma (Steinheim, Germany). mPEG-Succinimidyl Propionate (mPEG-SPA) with the molecular weight of 5 KDa was obtained from Sunbio (Orinda, USA) and Polysulfone filtration membrane (100 KDa) from Sartorius (Goettingen, Germany). All other reagents were purchased from Merck (Darmstadt, Germany); they were of analytical grade and used as received.
Methods
Preparation of BSA Nanoparticles
BSA nanoparticles were prepared by a desolvation method as described elsewhere (31,32). Briefly, 0.2 g BSA in 2.0 mL aqueous solution, titrated to desired pH, was converted to nanoparticles by continuous addition of desolvating agent, ethanol, at the rate of 1.0 mL/min and under stirring (550 rpm) at room temperature. Subsequently, 8% glutaraldehyde aqueous solution was added to induce particle cross-linking. The cross-linking process was performed under stirring of the suspension over night. 5-FU-loaded BSA nanoparticles were produced by an optimized desolvation process reported in our previous study (32).
Separation of Nanoparticles
Possible microparticles were precipitated by centrifugation (15,000×g, 2 min) and then discarded. Nanoparticles were separated by 2 cycles of centrifugation (25,000×g, 20 min) and redispersion of the pellet to the original volume in 10 mM NaCl pH 9. Each redispersion step was carried out using ultrasonication (dr.hielscher, UP 400S, Germany) for 5 min. Then, BSA nanoparticles solution was freeze-dried to yield nanoparticle powder.
Free Amino Group Quantification of Nanoparticles
Determination of amino groups was performed using the reaction of TNBS with free amino groups (33–35). In principle, 250 μl aqueous 0.01% TNBS solution was added to the 500 μl of 0.5 mg/mL nanoparticle in 0.1 M sodium bicarbonate buffer (pH 8.5). The reaction mixture was shaken at 500 rpm for 2 h at 37°C. In order to separate the nanoparticles, the sample was centrifuged (35,000×g, 30 min). The supernatant was assayed spectrophotometrically at 345 nm for unreacted TNBS. Free amino group content of particles was calculated relative to a TNBS reference that was treated in the same manner as described above, using water instead of the particle solution.
PEGylation Optimization of Nanoparticles
PEG concentration, incubation time, reaction temperature, and pH have been considered as the most important factors for further investigation by response surface method using central composite design (CCD; four factors and five levels; Table I), considering the amount of free amino groups as response. Each trial was performed twice. Concentration of nanoparticle solution was constant in all experiments at 5 g/L (36,37).
Table I.
Selected Levels and Factors for Central Composite Design of BSA Nanoparticles PEGylation
| Variables | Coded Value | |||||
|---|---|---|---|---|---|---|
| −α (−2) | −1 | 0 | +1 | +α (+2) | ||
| X 1 | CPEG (g/l) | 2.5 | 10 | 17.5 | 25 | 32.5 |
| X 2 | t (min) | 10 | 40 | 70 | 100 | 130 |
| X 3 | T (°C) | 3 | 9 | 15 | 21 | 27 |
| X 4 | Ph | 7 | 7.5 | 8 | 8.5 | 9 |
The values of levels of all factors were chosen according to a previous research (36) and several preliminary experiments. Measuring free amino groups by TNBS revealed that the molar ratio of free amino group per bare BSA nanoparticle is 7.86. So based on the concentration of nanoparticles (5 g/L) and assuming molar ratio range of 1–10 for PEG per amino group, the lowest and highest levels of PEG concentration was calculated to be 2.5 and 32.5 g/L, respectively.
mPEG-SPA with the molecular weight of 5,000 Da was used for conjugation to nanoparticles. Due to high sensitivity of activated PEG to moisture, dried acetone was used as PEG solvent (37). Ethanolamine solution (98%), 10 μL, was added to samples to terminate the reaction. PEG conjugated BSA nanoparticles were purified by centrifugation at 35,000×g for 17 min followed by redispersion in 0.1 sodium bicarbonate buffer (pH 8.5). Dispersed solution was diluted to a final nanoparticle concentration of 0.5 mg/mL with 0.1 M sodium bicarbonate (pH 8.5). Free amino group content of modified BSA nanoparticles was measured by TNBS method as described before. By comparison of the resulted amount of free amino groups after PEGylation with the original amount, efficiency of the PEGlation process was calculated as the percentage of PEGylated amino groups.
Determination of Particle Size and Zeta Potential
Average size and zeta potential of bare nanoparticles and PEGylated nanoparticles in optimum condition was measured by photon correlation spectroscopy using a Malvern zetasizer 3000HS (Malvern Instrument Ltd, UK). The samples were measured at a temperature of 25°C and a scattering angle of 90°.
In Vitro Drug Release Profile
In two separate experiments, PEGylated and bare 5-FU-loaded nanoparticles were injected to an ultrafiltration system (Fig. 1) consisted of two membranes (5 cm diameter and 100 KDa cutoff) with 1 mm distance and was immersed in 100 mL phosphate-buffered saline pH 7.4. This setup was placed in an incubator (N-Biotech, NB-205, Belgium) at 37°C and agitated at 100 rpm by a magnetic stirrer. The release medium was withdrawn at the rate of 0.1 mL/min by an HPLC pump and assessed continuously for 5-FU concentration with a UV-Vis detector (M730D, Younglin Instrument, Korea) for 1,400 min. The detector was set at 265 nm with a sensitivity of 1.00 absorbance unit full scale and a sampling rate of 4 Hz. For maintaining sink conditions, fresh buffer was added at the same rate with a syringe pump (World Precision Instruments, SP200i, USA). Drug release experiments from both bare and PEGylated nanoparticles were conducted in duplicate, and the averages of release profiles were considered for the study of PEGylation effect on the drug release.
Fig. 1.

Schematic representation of the ultrafiltration setup used for assessing drug release profile
RESULTS AND DISCUSSION
Nanoparticles PEGylation Optimization
According to literature, PEG concentration, incubation time, temperature, and pH were selected as the independent input variables and free amino group content as the dependent output variable. Based on the free amino group content of bare nanoparticles, the lowest and highest levels of PEG concentration were determined. In addition, free amino group content of bare nanoparticles was considered as a reference in finding PEGylation process efficiency.
A central composite design was employed to analyze the interactive effect of these parameters and to arrive at an optimum condition. A 24-factorial central composite experimental design, with eight axial points and seven replications at the center points leading to a total number of 31 experiments was employed for the optimization of the parameters (38). The variables were coded according to the following equation:
 |
1 |
Where Xi is the coded value, xi is the actual value of the ith test variable,  is the value of xi at the center point of the investigated area, and ∆xi is the step size. The range of the variables is given in Table I. The experimental design protocols (developed by Minitab 15 Software) (39) and corresponding results are presented in Table II.
Table II.
PEGylation Optimization of BSA Nanoparticles Using Central Composite Design
| Trial | Coded Factors | Experimental Results | ||||
|---|---|---|---|---|---|---|
| X 1 | X 2 | X 3 | X 4 | Molar Ratio of PEGylated Amino Groups per bare BSA Nanoparticles | PEGylation Efficiency (%) | |
| 1 | −1 | −1 | −1 | −1 | 2.77025 | 35 |
| 2 | 1 | −1 | −1 | −1 | 4.2959 | 54 |
| 3 | −1 | 1 | −1 | −1 | 4.62282 | 59 |
| 4 | 1 | 1 | −1 | −1 | 4.96897 | 63 |
| 5 | −1 | −1 | 1 | −1 | 6.469 | 82 |
| 6 | 1 | −1 | 1 | −1 | 7.7767 | 97 |
| 7 | −1 | 1 | 1 | −1 | 5.6292 | 71 |
| 8 | 1 | 1 | 1 | −1 | 7.43605 | 94 |
| 9 | −1 | −1 | −1 | 1 | 2.6741 | 34 |
| 10 | 1 | −1 | −1 | 1 | 5.7254 | 73 |
| 11 | −1 | 1 | −1 | 1 | 5.5587 | 71 |
| 12 | 1 | 1 | −1 | 1 | 7.50743 | 95 |
| 13 | −1 | −1 | 1 | 1 | 3.45615 | 44 |
| 14 | 1 | −1 | 1 | 1 | 7.59077 | 96 |
| 15 | −1 | 1 | 1 | 1 | 6.84077 | 87 |
| 16 | 1 | 1 | 1 | 1 | 7.83436 | 98 |
| 17 | −2 | 0 | 0 | 0 | 3.09718 | 39 |
| 18 | 2 | 0 | 0 | 0 | 7.64846 | 95 |
| 19 | 0 | −2 | 0 | 0 | 4.63564 | 59 |
| 20 | 0 | 2 | 0 | 0 | 7.78308 | 97 |
| 21 | 0 | 0 | −2 | 0 | 5.8664 | 74 |
| 22 | 0 | 0 | 2 | 0 | 7.53948 | 95 |
| 23 | 0 | 0 | 0 | −2 | 5.7446 | 73 |
| 24 | 0 | 0 | 0 | 2 | 6.6613 | 85 |
| 25 | 0 | 0 | 0 | 0 | 7.10359 | 90 |
| 26 | 0 | 0 | 0 | 0 | 7.10361 | 90 |
| 27 | 0 | 0 | 0 | 0 | 7.1036 | 90 |
| 28 | 0 | 0 | 0 | 0 | 7.10359 | 90 |
| 29 | 0 | 0 | 0 | 0 | 7.10358 | 90 |
| 30 | 0 | 0 | 0 | 0 | 7.10362 | 90 |
| 31 | 0 | 0 | 0 | 0 | 7.10359 | 90 |
The experimental results of the CCD were fitted with a second-order polynomial equation. The values of regression coefficients were calculated and the fitted equation (in terms of coded values) for prediction of PEGylation efficiency was as follows:
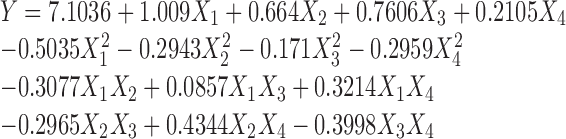 |
2 |
Where Y is molar ratio of PEGylated amino groups per bare BSA nanoparticles and X1, X2, X3, and X4 are coded values for PEG concentration, time, temperature, and pH, respectively.
The coefficients of the regression model (Eq. 2) that appear as one constant, four linear, four quadratic, and six interaction terms are listed in Table III. The significance of each coefficient, determined by p values, is also given. The p values imply that the first order main effects of PEG concentration, time, and temperature and second-order main effects of PEG concentration, time, and pH were significant. Of the interaction terms, time–pH was found to be the most significant term.
Table III.
Analysis of the Central Composite Design Results for PEGylated Nanoparticles
| Term | Regression Coefficient | T value | p Value |
|---|---|---|---|
| Intercept | 7.1036 | 33.821 | 0.000 |
| X 1 | 1.009 | 8.896 | 0.000 |
| X 2 | 0.664 | 5.853 | 0.000 |
| X 3 | 0.7606 | 6.706 | 0.000 |
| X 4 | 0.2105 | 1.856 | 0.082 |
| X 1*X 1 | −0.5035 | −4.845 | 0.000 |
| X 2*X 2 | −0.2943 | −2.832 | 0.012 |
| X 3*X 3 | −0.171 | −1.645 | 0.119 |
| X 4*X 4 | −0.2959 | −2.848 | 0.012 |
| X 1*X 2 | −0.3077 | −2.515 | 0.042 |
| X 1*X 3 | 0.0857 | 0.617 | 0.546 |
| X 1*X 4 | 0.3214 | 2.313 | 0.034 |
| X 2*X 3 | −0.2965 | −2.134 | 0.049 |
| X 2*X 4 | 0.4344 | 3.127 | 0.007 |
| X 3*X 4 | −0.3998 | −2.878 | 0.011 |
It is required to test the significance and adequacy of the model through analyses of variance. Fisher variance ratio, the F value, is a statistically valid measure of how well the factors describe the variation in the data about its mean. The greater the F value is from unity, the more certain it is that the factors adequately explain the variation in the data around its mean, and the estimated factor effects are real. The analysis of variance of the regression model demonstrates that the model is highly significant, as is evident from the Fisher’s F test (Fmodel = 16.36). The goodness of fit with this quadratic model was confirmed by the determination coefficient (R2). In this case, the value of the determination coefficient (R2 = 0.935) indicates that 93.5% of the variability in the response could be explained by the model.
The optimum (coded variables), obtained by Minitab software (version 15) for achieving maximum PEGylation, accrued at X1 = 32.5, X2 = 10, X3 = 27, X4 = 7. It was predicted that in the optimum condition all of the free amino groups would be PEGylated. To confirm the model accuracy in predicting optimum condition, additional experiments in triplicate were performed at the optimum condition. These experiments yielded an average PEGylation efficiency of 100%. The good agreement between the predicted and experimental results verified the validity of the model and the existence of the optimal point.
Two-dimensional contour plots are the graphical representations of the regression equation and are plotted to understand the interaction of the variables and to locate the optimum level of each variable for maximum response. Each contour represents the different combinations of two test variables at one time while keeping the other two variables at their respective zero level. Two typical counter plots are presented in Fig. 2.
Fig. 2.

Contour plots of variables in BSA nanoparticles PEGylation, a for the interaction between t (X 2) and T (X 3), and b for the interaction between t (X 2) and pH (X 4) at zero level of the other two variables
Particle Size and Zeta Potential of PEGylated and Bare Nanoparticles
Mean diameter and zeta potential of bare nanoparticles were 210 nm and −31.7 mV, respectively. In contrast, mean diameter and zeta potential of PEGylated nanoparticles under optimum condition were 217 nm and −14 mV, respectively. As results reveal, PEG-BSA nanoparticles demonstrated reduction of the negative surface charge compared to the non-modified nanoparticles, but mean diameter of bare and PEGylated particles are approximately the same. The zeta potential Reduction after PEGylation is due to the surface coating of nanoparticles by PEG molecules.
In Vitro Drug Release
5-FU release from bare and PEGylated nanoparticles was accomplished as described before. The averages of 5-FU release profiles are presented in Fig. 3. In this figure, y-axis is the 5-FU concentration in the output flow, which is obtained from the conversion of voltage to concentration unit by a standard curve. According to this figure, comparison of profiles shows that drug release from PEGylated nanoparticles is to some extent slower than that of bare nanoparticles. Probably this phenomenon is due to the presence of a PEG layer around PEGylated nanoparticles that may produce an additional resistance against drug transport from particle surface.
Fig. 3.

Drug release profiles from bare and PEGylated nanoparticles
CONCLUSION
Preparation process for PEGylated BSA nanoparticles was studied by response surface method using central composite design. Optimum production condition of PEGylated BSA nanoparticles for 5 g/L of particles was as follows: 32.5 g/L mPEG-SPA 5,000 Da, 10 min incubation time, 27°C incubation temperature and pH 7. This leads to production of PEGylated nanoparticles with mean size of 217 nm and zeta potential of −14 mV, which showed reduction of the negative surface charge compared to the bare particles. Therefore, to some extent, PEG coating masked the negative charge of nanoparticles. Drug release profiles demonstrated that drug release from PEGylated nanoparticles is slower than bare nanoparticles, probably due to the presence of a PEG layer around PEGylated particles.
ACKNOWLEDGMENTS
We appreciate partial support of this research by the Iranian National Science Foundation.
REFERENCES
- 1.Muller BG, Leuenberger H, Kissel T. Albumin nanospheres as carriers for passive drug targeting: an optimized manufacturing technique. Pharm Res. 1996;13:32–37. doi: 10.1023/A:1016064930502. [DOI] [PubMed] [Google Scholar]
- 2.Patil GV. Biopolymer albumin for diagnosis and in drug delivery. Drug Dev Res. 2003;58:219–247. doi: 10.1002/ddr.10157. [DOI] [Google Scholar]
- 3.Merodio M, Arnedo A, Renedo MJ, Irache JM. Ganciclovir-loaded albumin nanoparticles: characterization and in vitro release. Eur J Pharm Sci. 2001;12:251–259. doi: 10.1016/S0928-0987(00)00169-X. [DOI] [PubMed] [Google Scholar]
- 4.Merodio M, Irache JM, Valamanesh F, Mirshahi M. Ocular disposition and tolerance of ganciclovir-loaded albumin nanoparticles after intravitreal injection in rats. Biomaterials. 2002;23:1587–1594. doi: 10.1016/S0142-9612(01)00284-8. [DOI] [PubMed] [Google Scholar]
- 5.Lin W, Garnett MC, Davis SS, Schacht E, Ferruti P, Illum L. Preparation and characterization of rose Bengal-loaded surface-modified albumin nanoparticles. J Control Release. 2001;71:117–126. doi: 10.1016/S0168-3659(01)00209-7. [DOI] [PubMed] [Google Scholar]
- 6.Wartlick H, Michaelis K, Balthasar S, Strebhardt K, Kreuter J, Langer K. Highly specific HER2-mediated cellular uptake of antibody-modified nanoparticles in tumour cells. J Drug Target. 2004;12:461–471. doi: 10.1080/10611860400010697. [DOI] [PubMed] [Google Scholar]
- 7.Dreis S, Rothweiler F, Michaelis M, Cinatl J, Jr, Kreuter J, Langer K. Preparation, characterization and maintenance of drug efficacy of doxorubicin-loaded human serum albumin (HAS) nanoparticles. Int J Pharm. 2007;341:207–214. doi: 10.1016/j.ijpharm.2007.03.036. [DOI] [PubMed] [Google Scholar]
- 8.Weber C, Reiss S, Langer K. Preparation of surface modified protein nanoparticles by introduction of sulfhydryl groups. Int J Pharm. 2000;211:67–78. doi: 10.1016/S0378-5173(00)00590-1. [DOI] [PubMed] [Google Scholar]
- 9.Vonarbourg A, Passirani C, Saulnier P, Benoit JP. Parameters influencing the stealthiness of colloidal drug delivery systems. Biomaterials. 2006;27:4356–4373. doi: 10.1016/j.biomaterials.2006.03.039. [DOI] [PubMed] [Google Scholar]
- 10.Dumitriu S. Polymeric biomaterials. New York: Marcel Dekker; 2001. [Google Scholar]
- 11.Stolnik S, Illum L, Davis S. Long-circulating microparticle drug carriers. Adv Drug Deliv Rev. 1995;16:195–214. doi: 10.1016/0169-409X(95)00025-3. [DOI] [Google Scholar]
- 12.Pasut G, Veronse FM. Polymer-drug conjugation, recent achievements and general strategies. Prog Polym Sci. 2007;32:933–961. doi: 10.1016/j.progpolymsci.2007.05.008. [DOI] [Google Scholar]
- 13.Maeda H, Wu J, Sawa T, Matsumura Y, Hori K. Tumor vascular permeability and EPR effect in macromolecular therapeutics, a review. J Control Release. 2000;65:271–284. doi: 10.1016/S0168-3659(99)00248-5. [DOI] [PubMed] [Google Scholar]
- 14.Maeda H. The enhanced permeability and retention (EPR) effect in tumor vasculature: the key role of tumor-selective macromolecular drug targeting. Adv Enzyme Regul. 2001;41:189–207. doi: 10.1016/S0065-2571(00)00013-3. [DOI] [PubMed] [Google Scholar]
- 15.Gabizon A. Liposome circulation time and targeting: implication for cancer chemotherapy. Adv Drug Deliv Rev. 1995;16:285–294. doi: 10.1016/0169-409X(95)00030-B. [DOI] [Google Scholar]
- 16.Torchilin VP. Multifunctional nanocarriersm. Adv Drug Deliv Rev. 2006;58:1532–1555. doi: 10.1016/j.addr.2006.09.009. [DOI] [PubMed] [Google Scholar]
- 17.Klibanov AL, Maruyama K, Torichilin VP, Huang L. Amphipatic polyethyleneglycols effectively prolong the circulation time of liposomes. FEBS Lett. 1990;268:235–238. doi: 10.1016/0014-5793(90)81016-H. [DOI] [PubMed] [Google Scholar]
- 18.Maruyama K, Yuda T, Okamoto A, Ishikura C, Kojima S, Iwatsuru M. Effect of molecular weight in amphipathic polyethyleneglyco on prolonging the circulation time of large unilamellar liposomes. Chem Pharm Bull. 1991;39:1620–1622. doi: 10.1248/cpb.39.1620. [DOI] [PubMed] [Google Scholar]
- 19.Senior J, Delgado C, Fisher D, Tilcock C, Gregoriadis G. Influence of surface hydrophilicity of liposomes on their interaction with plasma protein and clearance from the circulation: studies with poly (ethylene glycol)-coated vesicles. Biochim Biophys. 1991;1066:77–82. doi: 10.1016/0005-2736(91)90337-8. [DOI] [PubMed] [Google Scholar]
- 20.Allen TM, Hanse C, Martin F, Redemann C, Young YA. Liposomes containing synthetic lipid derivatives of poly (ethylene glycol) show prolonged circulation half-lives in vivo. Biochem Biophys. 1991;1066:29–36. doi: 10.1016/0005-2736(91)90246-5. [DOI] [PubMed] [Google Scholar]
- 21.Papadjopoulos D, Allen TM, Gabizon A, Mayhew E, Matthay K, Huang SK, Lee KD, Woodle MC, Lasic DD, Redemon C. Sterically stabilized liposomes: improvements in pharmacokinetics and antitumor therapeutic efficiency. Proc Natl Acad Sci U S A. 1991;88:11460–11464. doi: 10.1073/pnas.88.24.11460. [DOI] [PMC free article] [PubMed] [Google Scholar]
- 22.Veronese FM, Pasut G. PEGylation, successful approach to drug delivery. Drug Discov Today. 2005;10(21):1451–1458. doi: 10.1016/S1359-6446(05)03575-0. [DOI] [PubMed] [Google Scholar]
- 23.Naper DH. Polymeric stabilization of colloidal dispersion. New York: Academic; 1983. [Google Scholar]
- 24.Senior J, Delgado C, Fisher D, Tilcock C, Gregoriadis G. Influence of surface hydrophilicity of liposomes on their interaction with plasma protein and clearance from the circulation: studies with poly (ethylene glycol)-coated vesicles. Biochem Biophys. 1991;1062:77–82. doi: 10.1016/0005-2736(91)90337-8. [DOI] [PubMed] [Google Scholar]
- 25.Woodle MC. Surface-modified liposomes: assessment and characterization for increased stability and prolonged blood circulation. Chem Phys Lipids. 1993;64:249–262. doi: 10.1016/0009-3084(93)90069-F. [DOI] [PubMed] [Google Scholar]
- 26.Allen TM. The use of glycolipids and hydrophilic polymers in avoiding rapid uptake of liposomes by the mononuclear phagocyte system. Adv Drug Deliv Rev. 1994;13:285–309. doi: 10.1016/0169-409X(94)90016-7. [DOI] [Google Scholar]
- 27.Chonn A, Semple SC, Cullis PR. Separation of large unilamellar liposomes from blood components by a spain column procedure: toward identifying plasma proteins which mediate liposome clearance in vivo. Biochem Biophys. 1991;1070:215–222. doi: 10.1016/0005-2736(91)90167-7. [DOI] [PubMed] [Google Scholar]
- 28.Chonn A, Semple SC, Cullis PR. Association of blood proteins with large unilamellar liposomes in vivo: relation to circulation lifetimes. J Biol Chem. 1992;267:18759–18765. [PubMed] [Google Scholar]
- 29.Lasic DD, Martin FG, Gabizon A, Huang SK, Papahadjopoulos D. Sterically stabilized liposomes: a hypothesis on the molecular origin of the extended circulation times. Biochem Biophys. 1991;1070:187–192. doi: 10.1016/0005-2736(91)90162-2. [DOI] [PubMed] [Google Scholar]
- 30.Senior JH. Fate and behavior of liposomes in vivo: a review of controlling factors. CRC Crit Rev Ther Drug Carr Syst. 1987;3:123–193. [PubMed] [Google Scholar]
- 31.Langer K, Balthasar S, Vogel V, Dinauer N, Von Briesen H, Schubert D. Optimization of the preparation process for human serum albumin (HSA) nanoparticles. Int J Pharm. 2003;257:169–180. doi: 10.1016/S0378-5173(03)00134-0. [DOI] [PubMed] [Google Scholar]
- 32.Maghsoudi A, Shojaosadati SA, Vasheghani Farahani E. 5-fluorouracil-loaded BSA nanoparticles: formulation optimization and in vitro release study. AAPS PharmSciTech. 2008;9:1092–1096. doi: 10.1208/s12249-008-9146-5. [DOI] [PMC free article] [PubMed] [Google Scholar]
- 33.Habeeb AFSA. Determination of free amino groups of protein by trinitrobenzenesulfonic acid. Anal Biochem. 1966;14:328–338. doi: 10.1016/0003-2697(66)90275-2. [DOI] [PubMed] [Google Scholar]
- 34.Edwards F, Andry MC, Levy MC. Determination of free amino groups content of serum albumin microcapsules using trinitrobenzenesulfonic acid: effect of variations in polycondensation. Int J Pharm. 1993;96:85–90. doi: 10.1016/0378-5173(93)90215-2. [DOI] [Google Scholar]
- 35.Edwards F, Andry MC, Levy MC. Determination of free amino groups content of serum albumin microcapsules: effect of variations in reaction time and in terephthaloyl chloride concentration. Int J Pharm. 1994;103:253–257. doi: 10.1016/0378-5173(94)90175-9. [DOI] [Google Scholar]
- 36.Harris JM. Advanced PEGylation: polyethylene glycol and derivatives for advanced PEGylation, Nektar Transforming Therapeutic Catalog. 2006.
- 37.Niemeyer CM. Bioconjugation protocols. New Jersey: Humana; 2004. [Google Scholar]
- 38.Montgomery DC. Design and analysis of experiments. New York: Wiley; 2005. [Google Scholar]
- 39.Minitab Inc. Minitab software version 15. http//minitab.com. (Accessed 10/03/09).