Abstract
Essential oils are used in foods, cosmetics, and pharmaceuticals. Despite the recent marketing of novel essential-oil-containing patches, there is no information on their production, constituents, or physical properties. The objectives of this study were to produce essential-oil patches and characterize their physical properties. The essential oil of Lavandula angustifolia (lavender) was included at concentrations of 2.5% to 10% in patches manufactured from the exudate gum karaya, propylene glycol, glycerol, emulsifier, and optionally, potato starch as filler. Inclusion of essential oil reduced patch strength, stiffness, and elasticity relative to patches without essential oil. Inclusion of starch in the essential-oil patches strengthened them, but reduced their elasticity. Patches' adhesion to substrate was examined by both peeling and probe-tack tests: the higher the inclusion of essential oils within the patch, the larger the decrease in its adhesion to substrate. Addition of starch to essential-oil-containing patches increased their adhesion relative to their essential-oil-only counterparts. Scanning electron micrographs of the patches provided evidence of entrapped starch granules. Although inclusion of essential oil reduced both the mechanical properties and adhesion of the patches, a high proportion of essential oil can still be included without losing patch integrity or eliminating its adhesiveness to the skin.
KEY WORDS: adhesion, degree of elasticity, drug-in-adhesive, essential oil, filler, patch
INTRODUCTION
Essential oils are plant extracts obtained by steam distillation of plant material from numerous botanical sources (1). In recent decades, the pharmaceutical and therapeutic potential of essential oils and their individual volatiles has garnered scientific interest. Monoterpenes (a class of terpenes consisting of two isoprene units with the molecular formula C10H16, which may be acyclic or contain rings), components of essential oils, have been shown to exhibit chemopreventive (2) as well as chemotherapeutic (3) activities in mammary tumor models. More than a few essential oils elicit hepatoprotective activity (the ability to prevent damage to the liver), due to their phenolic and/or monoterpene content, including black cumin (Nigella sativa), owing to thymoquinone (4), orange essential oil, as a result of d-limonene—the major component of the oil extracted from the citrus rind during the citrus-juicing process (5), and sweet fennel (Foeniculum vulgare) due to both d-limonene and β-myrcene (an olefinic natural organic compound, classified as a hydrocarbon and a monoterpene (6)). In addition, d-limonene exhibited chemopreventive effects in a preclinical hepatocellular carcinoma model (7–9).
Herbalists regard lavender as the most useful and versatile essential oil for therapeutic purposes. Lavender is the essential oil most commonly associated with the healing of skin burns and therefore, patches that include it can be considered for such topical treatments. This essential oil has antiseptic and analgesic properties, enabling it to both ease the pain of the burn and prevent infection (10). It also has cytophylactic properties which promote rapid healing and help reduce scarring (11). Finally, the scent of lavender is said to have a calming effect on the body and it can be used to reduce anxiety and stress and to promote sleep (12). It is important to note that all of these advantages are retained when the essential oil is entrapped within a tailor-made hydrocolloid patch.
Lavender extract has been tested for its potential antithrombotic activity: Lavandula hybrida Reverchon cv. Grosso demonstrated a broad-spectrum antiplatelet effect (i.e., mimicking a class of pharmaceuticals that decrease platelet aggregation and inhibit thrombus formation, and are effective in the arterial circulation where anticoagulants have little effect), and was able to inhibit platelet aggregation induced by ADP, arachidonic acid, collagen and the stable thromboxane receptor agonist U46619 with no prohemorrhagic properties (13). Linalyl acetate, the acetate ester of linalool (36% of lavender oil and a naturally occurring phytochemical found in many flowers and spice plants), appeared to be the main active antiplatelet agent. Peppermint oil, in which menthol is the major constituent, is a naturally occurring carminative (i.e., an agent that prevents or relieves flatulence) which relaxes gastrointestinal muscle and is used for the treatment of irritable bowel syndrome (14,15). Mint tea, which has a high content of menthol among other ingredients, is an herbal remedy for the treatment of digestive disorders (16).
Essential oils follow three main pathways to gain entry into the body: ingestion, inhalation and absorption through the skin. Until the second half of the twentieth century, the skin was thought to be more or less impermeable (17). However, as it turns out, essential oil in base oil applied to the skin may be absorbed into the bloodstream (18). Probably the most innovative practical step in the science of transdermal delivery in recent years has been the introduction of medicinal skin patches (19). Some examples of transdermal therapeutic systems are transdermal scopolamine, nitroglycerin, estradiol, clonidine, fentanyl, nicotine, and testosterone (19). Recently, unique essential-oil-containing body patches have been put on the market (http://www.naturopatch.com/). In accordance with the manufacturer's claims, such patches, which contain unique blends of essential oils, provide therapeutic/aromatherapeutic benefits to the user (http://www.naturopatch.com/). Whether the essential oil included in the patch is designed to penetrate the skin and reach the bloodstream or is “activated” by body temperature to give off its aromatherapeutic benefits, the properties of such essential-oil patches should be investigated. To the best of our knowledge, the physical properties of hydrocolloid-essential oil patches have either never been studied, or the data have not been reported in the literature. Therefore, the objectives of this study were to try to include low to very high proportions of a single essential oil within a hydrocolloid patch and study the influence of the entrapped oil and of the optional addition of filler on the patch’s physical properties, i.e., strength, elasticity, and adhesiveness. An understanding of these properties may be crucial for the design and success of such novel patches from commercial, practical and technological points of view.
MATERIALS AND METHODS
Patch Preparation
Gum karaya-essential oil patches with or without starch were produced by mixing two phases: the first was composed of 13.6% to 23.6% (w/w) distilled water, 21.1% (w/w) glycerol (Sigma Chemical Co., St. Louis, MO), 2.5% to 10% (w/w) Lavandula angustifolia essential oil (“Light of the Desert”, kibbutz Urim, Israel), 1% (w/w) Tween 80 (Sigma) as an emulsifier and, optionally, 10% (w/w) potato starch (Merck, Darmstadt, Germany) as a filler. The second phase consisted of 27.7% (w/w) propylene glycol (Merck) which was used to suspend 20.0% (w/w) bark-free, HPS-grade (hand-picked selected, summer crop, 200 μm) gum karaya powder (Sigma). Gum purity was verified by analysis of its infrared spectrum which proved to be characteristic with respect to many commercial samples from various sources. The two phases were prepared separately, stirred for 5 min at ambient temperature and kept at −20°C for half an hour in order to slow the gelation reaction, which is otherwise immediate. They were then mixed together and quickly poured into a small Petri dish (height 5 mm, diameter 40 mm) or into a rectangular mold with dimensions of 11 × 10 × 0.5 cm (length × width × thickness) to form the final patch upon solidification. All patch types were prepared in two separate batches.
Compression Test
Mechanical tests were performed using a universal testing machine (UTM; Instron model 5544, Instron Corporation, Canton, MA). Cylindrical samples with dimensions of 8 × 5 mm (diameter × height) were uniaxially compressed to ∼90% between flat plates at a deformation rate of 10 mm/min to study their stress–strain relationships. Average stresses at 25%, 50%, and 75% strain were calculated. The UTM was connected to a computer by an analog-to-digital conversion interface card. The crosshead movements were controlled through the computer with “Merlin” software, supported by Instron. The UTM collects data as volts vs. time and then converts them to stress vs. strain. The corrected stress, σ(t), was calculated as follows:
 |
1 |
where H0 is the initial specimen length, ∆H(t) is the absolute deformation, F(t) is the force at time t and A0 is the cross-sectional area of the original specimen (20).
The engineering strain εE was calculated as:
 |
2 |
where ∆H is the total deformation divided by the initial specimen length. All reported results are means of four to eight replicates.
Elasticity Test
Cylindrical samples with dimensions of 8 × 5 mm (diameter × height) were subjected to compression–decompression cycles at predetermined deformations of 10%, 20%, or 50% using the UTM. Talc granules (MW: 379, particle size: <5 μm) were applied to both sides of the patch to prevent their adherence to the moving plate, which results in “negative” areas in the stress–strain curves (21). Crosshead speed was the same in both directions (0.1, 10, or 100 mm/min). The “degree of elasticity” has been defined as the ratio between recoverable and total compressive deformation (22–25), or as a percentage. It is calculated (22) by the ratio between recoverable and total work, i.e.,
 |
3 |
For the compression-decompression cycles, the areas under the stress–strain curves were calculated using the trapezoidal method (26): n number of trapezoids were circumscribed under a curve, and then their areas were summed. The area under the decompression curve was presented as percent of total work. All reported results are means of four to eight replicates taken from two separate batches.
Skin Model Preparation
A skin model was prepared in accordance with US Patent #4,877,454 (24) to serve as a substrate in the probe-tack test. Porcine skin gelatin 225 bloom (7 g) (Sigma) was dissolved in 58.1 g of water at 50°C with stirring. Then 0.035 g of propylparaben as a preservative (Sigma), 3.15 ml of sodium hydroxide solution (4%, w/w) (Frutarom, Haifa, Israel) and 0.35 g of glycerol were added. Ceraphyl GA (3 g) was added (Van-Dyk, Belleville, NJ) as the lipid component in the skin model, resulting in a white emulsion. Before pouring the emulsion into a roughened mold, in accordance with Charkoudian's patent, 2.77 ml of formaldehyde solution (3%, w/w) was added. The mixture was allowed to set and dry under ambient conditions (27,28). After 24 h, the resultant skin model was carefully removed from the mold. The average thickness of the skin model was measured with a thickness meter.
Topographical Characterization of the Skin Model
Roughness of the skin model was measured using a portable surface-roughness tester (Surftest-301, Mitutoyo Corp., Tokyo, Japan). Three measurements of Ra, recognized as representing an average roughness in practice, were made. Ra was calculated as:
 |
4 |
where l = evaluation length, and  = total area of the peaks and valleys. Rz (average of the vertical distances from the highest peaks to the lowest valleys within five equal sampling lengths) was also determined, to characterize the aforementioned surfaces. The Ra and Rz measurements were taken in both the “x” and “y” dimensions of the plane surface of the skin model. Results are given as arithmetic mean ± standard deviation (SD) for an evaluation length of 7.5 mm at a speed of 0.5 mm/s.
Probe-Tack Test
Probe-tack tests were carried out using a novel design of the conventional probe-tack tester, specifically adapted for use with tacky hydrogels. A full description of the apparatus is given elsewhere (29). This specialized device is capable of detecting first contact between the probe and a pressure-sensitive adhesive (PSA) and of determining this contact as the initial dwell time.
The probe test was performed in a custom-made apparatus connected to the UTM. The tip of a cleaned probe—20 mm diameter of adherend (skin model), is brought into contact with the adhesive (patch) at a controlled rate of 100 mm/min for 2 s. Then the bond formed between the skin and patch is detached at the same rate. Prior to the probe-tack test, the skin model was immersed in distilled water for 5 s to reach a relative humidity of ∼25%, which is typical of the stratum corneum (27). Tack was measured as the maximum force required to separate the patch from the skin model. Three replicates were carried out per sample.
Peeling Test
The adhesion properties of the patches were studied by 90° peeling test. The patches were peeled from a skin model sample as previously described (30,31). The skin model was immersed in distilled water for 5 s to reach a relative humidity of ∼25%. The patch was attached to the skin model surface, and peeling tests were carried out with the UTM. During the test, a graph showing the peeling force (g force/cm) as a function of peeling length (cm) was obtained. Rectangular samples with dimensions of 11 × 3.3 × 0.5 cm (length × width × thickness) were used. Six replicates were carried out per sample.
Color Measurement
Colorimetric values of L* (lightness–darkness parameter), a* (green–red parameter), and b* (blue–yellow parameter) were recorded using an X-Rite Spectrophotometer (Grand Rapids, MI). L* = 0 indicates black and L* = 100 indicates white; the a* value ranges between −60 for green to +60 for red and the b* value ranges from −60 for blue to +60 for yellow. The color difference  between two patches was calculated as:
 |
5 |
Patch pH Measurement
The pH of the patches was determined by pH meter (Model C830, Consort, Belgium) and pH electrode (Model 8163BN, Thermo, Orion, UK). Three replicates were carried out per sample.
Statistical Analysis
Statistical analyses were conducted using JMP software (SAS Institute 2007, Cary, NC), including ANOVA and Tukey–Kramer Honestly Significant Difference test for comparisons of means, with p ≤ 0.05 considered significant.
RESULTS AND DISCUSSION
We chose patches based on gum karaya and including L. angustifolia essential oil for this study for the following reasons: aside from their generally recognized as safe classification, gum karaya pastes have significant peel bond strength and at high concentrations produce viscous solutions that have the required adhesive properties for dental adhesives and colostomay bags (32,33). Gum karaya adhesive properties also keep the patch in a semi-solid state (34).
Compression Test
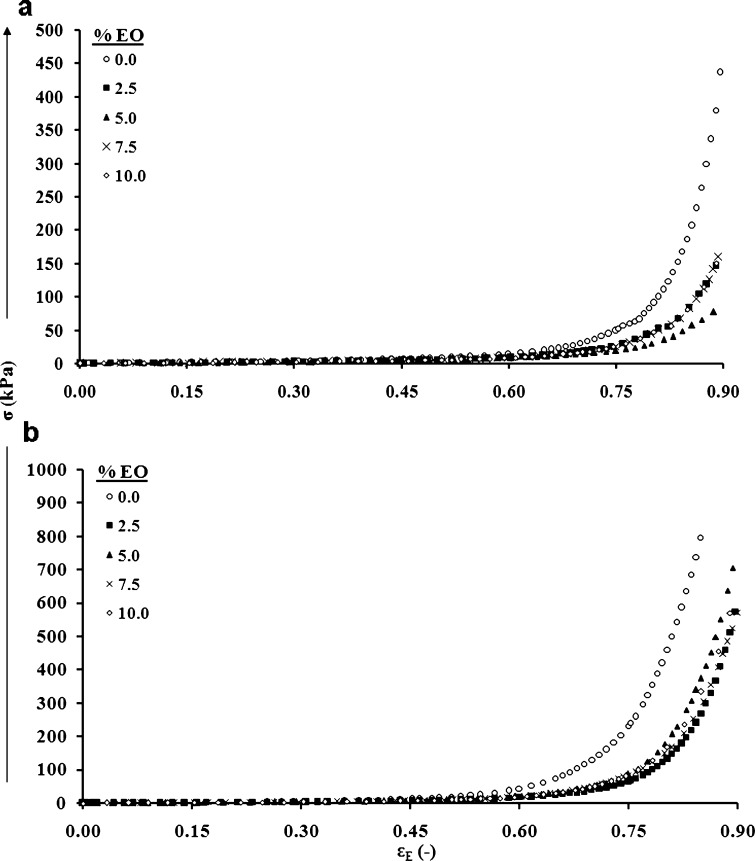
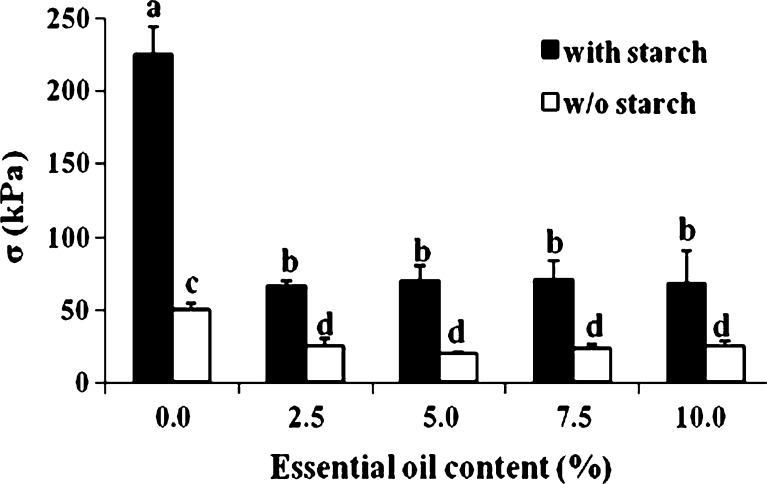
The produced gum karaya-essential oil patches were studied for their mechanical properties by compression test. These properties are important since as a rule, patches are designed to be compressed against the skin in order to achieve suitable contact followed by adhesion. The patches were compressed up to ∼90% deformation, and typical stress–strain relationships are demonstrated in Fig. 1. No visible signs of failure were observed during or after completion of the compression. Figure 1a and Table I show that differences in the mechanical properties of patches containing various amounts of essential oil are better detected at the initial point of the curves' separation, i.e., at ∼25% to 30% deformation; from that point on the observed stress at a particular strain value differs. Table I presents stress at strain values of 25%, 50%, and 75% deformation. At a strain of 25% with inclusion of essential oil at 2.5% to 10.0%, there was some decrease in the stress values in parallel to the increase in essential oil, although this decrease was not significant. However, at higher strains, i.e., 50% and 75%, with inclusion of different percentages of essential oil in the patches, a significant difference in stress values was observed, but only between patches with no essential oil inclusion and those including essential oil. In other words, at 50% and 75% strain, inclusion of 2.5% essential oil was sufficient to generate a significant difference in the stress values. The inclusion of tiny droplets of essential oil within the patch may decrease its integrity and lower its strength. This behavior is not surprising and is reminiscent of reports on the inclusion of other particle types within gels (35). Figure 1b presents typical stress–strain relationships for patches that contained both essential oil and starch as filler. Patches that contained a starch filler appeared to present higher stresses at a given strain in comparison to those patches that did not include filler. Table II summarizes the stress at several strain values for patches that included potato starch as filler with and without the inclusion of essential oils. Comparing these data with those in Table I, it is again obvious that the addition of starch strengthened and stabilized the patch. The patch matrix became denser (more tightly packed) due to the included starch granules and, as a result, more resistant to the applied stress. Figure 2 not only demonstrates the influence of the included essential oil on the strength of the patch (with or without filler) at 75% strain, which can also be concluded by comparing Tables I and II, it also provides a statistical analysis to make it easier to see the differences between the patches under large deformations: patches without the included essential oil clearly appeared to be stronger than those that included any percentage of entrapped essential oil. In addition, all patches that included fillers were stronger than those that did not.
Fig. 1.
Typical stress–strain relationships: a patches containing no starch; b patches containing starch. EO essential oil
Table I.
Stress at Different Strain Values for Gum Karaya-essential Oil Patches (No Filler Inclusion)
| Included essential oil (%) | Stress at 25% strain (kPa) | Stress at 50% strain (kPa) | Stress at 75% strain (kPa) |
|---|---|---|---|
| 0.0 | 2.5 ± 0.4 a | 8.5 ± 0.4 a | 50.3 ± 4.6 a |
| 2.5 | 2.1 ± 0.6 a | 6.1 ± 0.5 b | 25.0 ± 5.3 b |
| 5.0 | 1.9 ± 0.1 a | 5.7 ± 0.2 b | 19.8 ± 1.1 b |
| 7.5 | 2.0 ± 0.3 a | 5.5 ± 0.3 b | 23.3 ± 3.5 b |
| 10.0 | 1.9 ± 0.3 a | 5.5 ± 0.4 b | 25.6 ± 3.3 b |
Results are expressed as mean ± standard error. Different lowercase letters (a, b) within a column indicate a statistically significant difference at p < 0.05
Table II.
Stress at Different Strain Values for Gum Karaya-potato Starch-essential Oil Patches
| Included essential oil (%) | Stress at 25% strain (kPa) | Stress at 50% strain (kPa) | Stress at 75% strain (kPa) |
|---|---|---|---|
| 0.0 | 3.4 ± 0.1 a | 17.3 ± 0.8 a | 225.6 ± 19.0 a |
| 2.5 | 2.2 ± 0.1 a, b | 9.3 ± 0.1 b | 66.7 ± 3.2 b |
| 5.0 | 2.7 ± 0.3 a, b | 10.6 ± 1.8 b | 70.0 ± 10.1 b |
| 7.5 | 2.2 ± 0.2 b | 8.5 ± 0.9 b | 70.5 ± 13.6 b |
| 10.0 | 2.1 ± 0.4 b | 8.1 ± 1.3 b | 68.6 ± 21.8 b |
Potato starch at 10% was used as filler. Results are expressed as mean ± standard error. Different lowercase letters (a, b) within a column indicate a statistically significant difference at p < 0.05
Fig. 2.
Stress values at 75% deformation for patches with or without (w/o) starch. Bars headed by different letters (a–d) within and between treatments indicate a statistically significant difference at p < 0.05
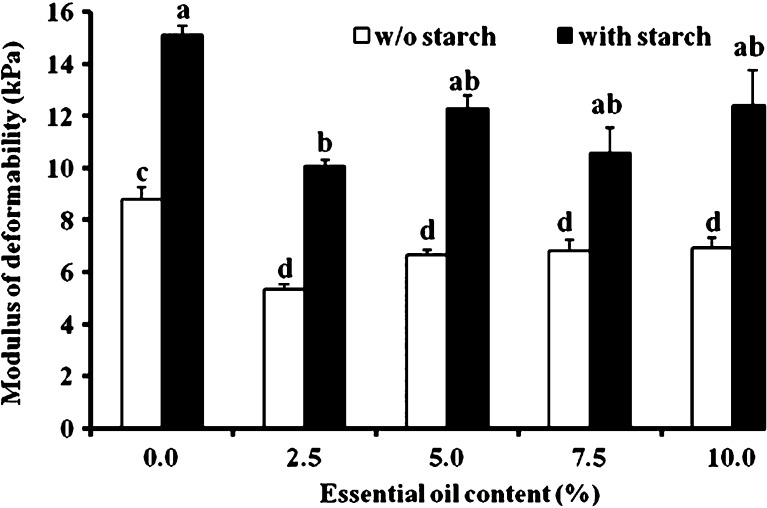
The modulus of deformability was calculated at 30% deformation where the relationship between stress and strain is highly linear (R2 = 0.97 or higher) (Fig. 3). Starch addition consistently increased the stiffness of the gum karaya patch and as a result, its resistance to deformation. This is not all that surprising and in fact, has already been observed in other systems, e.g., inclusion of fillers in dried alginate gels (36) or in microcapsules for drug delivery. In the latter, filler inclusion contributed to the stability of the carriers and prolonged the time of drug release by 6.5–8.5 h relative to carriers that contained no filler (37). The main change for both types of patches, with and without starch (Fig. 3), was the decrease in their deformability modulus upon inclusion of essential oil, even at its lowest amount (2.5%). In other words, the hydrocolloidal patch's texture is highly influenced by the inclusion of the main components of lavender essential oil, linalool, and linalyl acetate.
Fig. 3.
Modulus of deformability at 30% deformation for patches with and without (w/o) starch. Bars headed by different letters (a–d) within and between treatments indicate a statistically significant difference at p < 0.05
Elasticity Test
To achieve attachment, the user presses the patch against the skin (tens of percentage points of deformation are involved) until it adheres to it. When pressure is removed the patch remains glued to the skin and attempts to recover its initial dimensions. This is approximately simulated by applying one cycle of compression-decompression to the patch during the degree of elasticity test, and results of this test may therefore be useful to both the manufacturer and the consumer.
When a patch (with or without essential oil inclusion) adheres to both the upper and lower plates of the Instron, “negative” force/stress values are achieved, and thus any estimation of the degree of elasticity will be influenced/changed or calculated erroneously. Areas above the x-axis are termed “positive” and those below the x-axis “negative”. We were able to eliminate these “negative” (under the x-axis) areas by adopting a method (21) which had been previously developed specifically to cope with this problem. The method consists of spreading talcum powder over both sides of the adhesive patch then shaking off the excess prior to the patch's compression-decompression. The talc granules appear to stick to and cover the surface of the adhesive patches with or without the included essential oil, thereby preventing the formation of adhesive bonds between the sensor and the patch. This method (21) was adopted here since its accuracy has been proven by comparison to another approach—the use of quick-drying glue to attach 100-μm-thick circular polyester plates (less than 1% of the height of the cylindrical samples) to the patches before testing—yielding the same results (21).
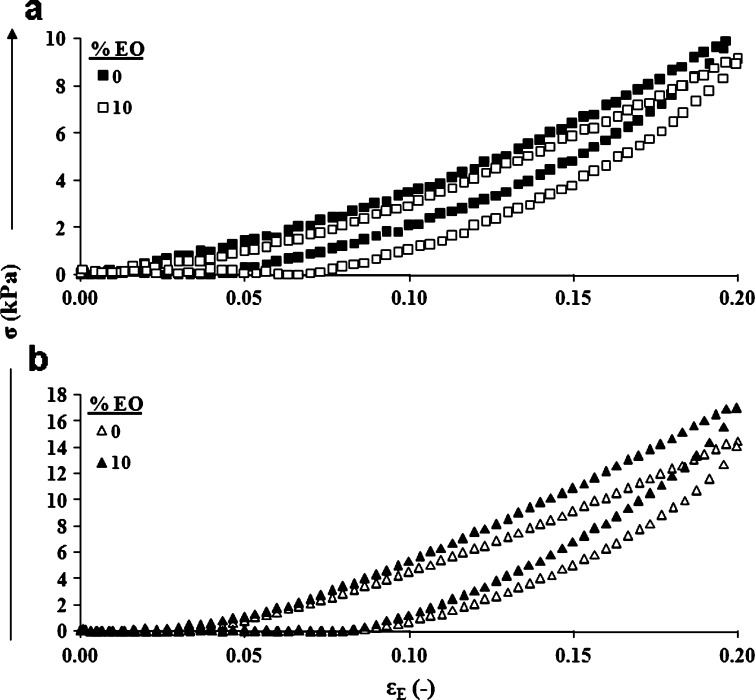
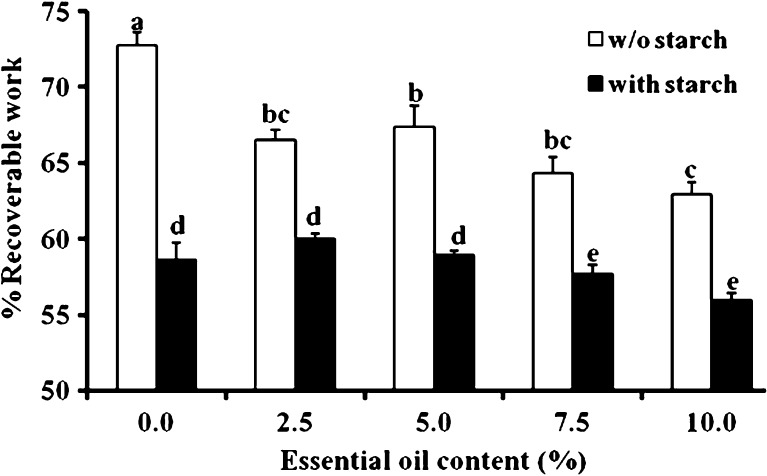
Typical compression-decompression relationships of patches including 0% or 10% essential oil with or without starch as a filler were studied and are demonstrated in Fig. 4. The influence of the included essential oil on the percent recoverable work of the patches with and without starch was calculated from the curves in Fig. 4 and is demonstrated in Fig. 5. Essential-oil inclusion caused a significant reduction in the patches’ percent recoverable work (i.e., their degree of elasticity). For patches without essential oil, degree of elasticity values of 73.0 ± 0.9% were observed, while for patches with included essential oil in the range of 2.5% to 10%, calculated degree of elasticity values fluctuated between 63.0% and 67.0%. The inclusion of starch in the patch decreased the recoverable work to 58.6 ± 1.0%. Inclusion of 2.5% or 5.0% essential oil in the patch did not change its percent recoverable work significantly. However, the inclusion of 7.5% or 10.0% essential oil within the gum karaya-starch patches significantly reduced their percent recoverable work. These findings for both patches, with and without starch, demonstrate that even after the inclusion of essential oil, the patch retains its high elastic properties and can be regarded as an elastic body. Similarly high degrees of elasticity, in the range of 63% to 73%, have been recorded for foods such as frankfurters, jelly candies, and marshmallows, and for different patches stabilized by the inclusion of fillers (21).
Fig. 4.
Typical compression-decompression relationships: a patches containing no starch; b patches containing starch. The patches were compressed to 20% deformation at a rate of 10 mm/min. EO essential oil
Fig. 5.
Percent recoverable work of patches with or without (w/o) starch. The patches were compressed to 20% deformation at a rate of 10 mm/min. Bars headed by different letters (a–e) within and between treatments indicate a statistically significant difference at p < 0.05
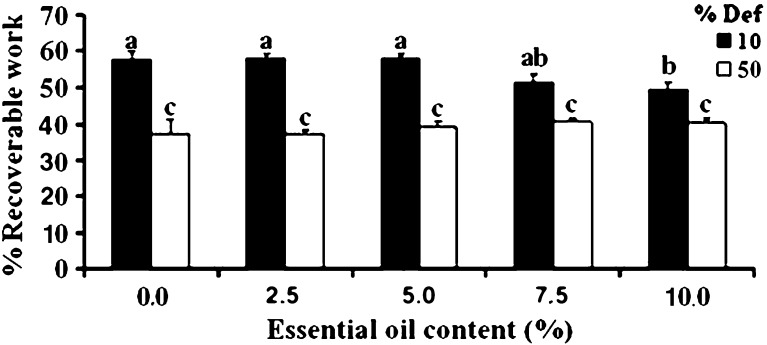
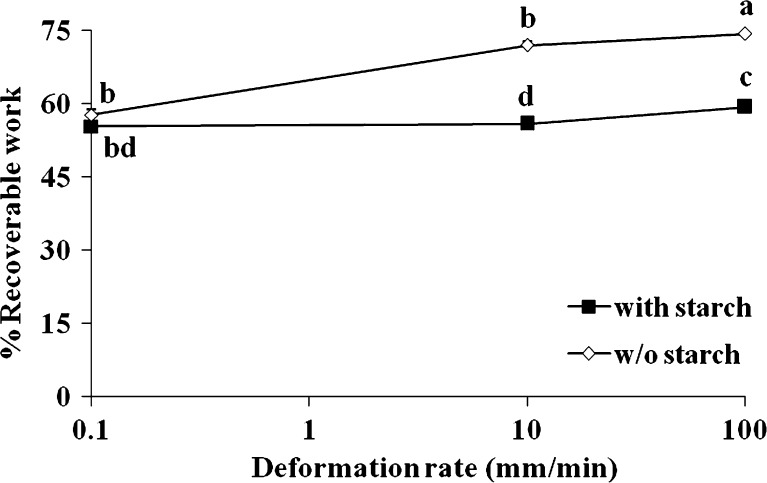
The deformation to which a patch is compressed is well known to influence its percent recoverable work. This hypothesis was checked by compressing the patches to 10 and 50% deformation (Fig. 6): percent recoverable work (i.e., the degree of elasticity) decreased as percent deformation increased. This was likely due to internal damage which probably occurred within the patch during the compression. A similar decrease in percent recoverable work as a result of increasing deformation has been previously reported for agar, carrageenan and gellan gels (32). Deformation rate may also influence the elastic properties of the patches reflected by their percent recoverable work, and therefore patches were passed through one cycle of compression-decompression at deformation rates of 0.1, 10, and 100 mm/min, and then the average recoverable work under those conditions was calculated and compared (Fig. 7). For patches with and without inclusion of a filler (potato starch) there was no difference in percent recoverable work at a deformation rate of 0.1 mm/min. However, a significant change was observed when the rate of deformation “jumped” to 10 and 100 mm/min. It appears that at these latter rates, for both types of patches (with and without starch), the higher the deformation rate the bigger the recorded percent recoverable work. In addition, it appears that inclusion of starch granules reduced the calculated percent recoverable work. This kind of behavior could result from a reduction in the elastic properties of such patches.
Fig. 6.
Percent recoverable work of patches containing starch subjected to one compression-decompression cycle under deformations of 10% or 50% and compressed at a deformation rate of 10 mm/min. Bars headed by different letters (a–c) within and between treatments indicate a statistically significant difference at p < 0.05
Fig. 7.
Percent recoverable work of patches with or without (w/o) starch subjected to deformation rates of 0.1, 10, and 100 mm/min. The patches were compressed to 20% deformation. Different letters (a–d) within and between treatments indicate a statistically significant difference at p < 0.05
Probe-Tack Test
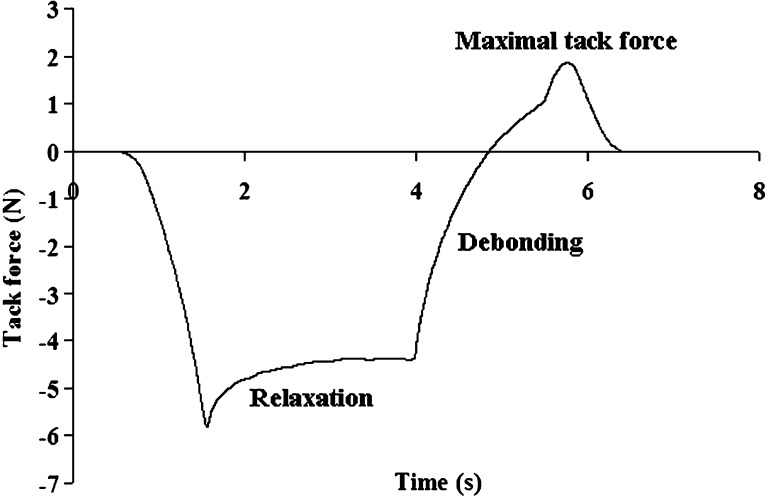
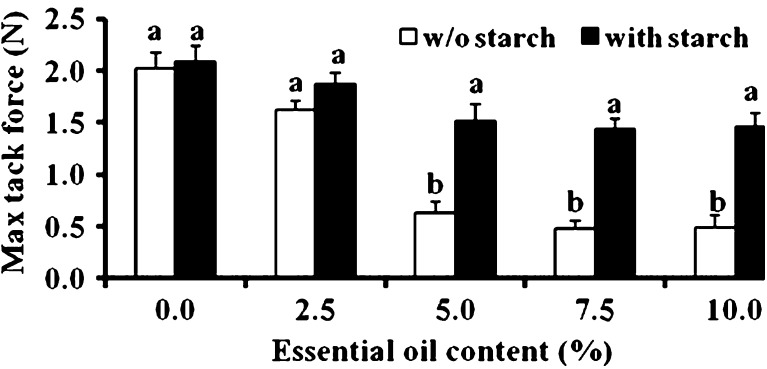
One of the most important properties of PSAs is their ability to adhere to their destined substrate. In fact, without good adhesive properties, the patch's ability to efficiently serve as a reservoir for drugs for either topical or transdermal delivery is questionable. The adhesive properties of karaya-essential oil patches with and without starch were studied. A typical tack curve is demonstrated in Fig. 8, composed of a few components: first the patch is compressed; then the compression is stopped at a predetermined deformation, and force relaxation takes place followed by a debonding process, reaching a maximal tack force and then declining to zero tack force upon detachment. For the different patches, the maximal tack force required to separate the patch from a skin model was measured. Figure 9 reveals that for patches without starch inclusion, the higher the inclusion of essential oil within the patch, the larger the decrease in its tackiness; maximum force values of 2.09 ± 0.15 N were detected for patches without inclusion of essential oil whereas for patches with 10% included oil the maximum force values decreased to 0.49 ± 0.11 N. Starch inclusion increased the maximum recorded tack force values. A significant difference between patches with and without starch inclusion was observed when the content of the entrapped essential oil was 5% or higher. The increase in maximum force values as a result of starch inclusion may be due to changes in the surface properties of the patch that is contacting the substrate, be it a skin model or skin. As previously stated, the inclusion of essential oil within the patch without starch reduced its maximum force value, since the included oil is not adhesive and it potentially reduces patch adhesiveness. Inclusion of starch within a patch that already includes essential oil creates a different situation, in which non-gelatinized, non-tacky, rigid starch granules replace some of the essential oil “regions” present on the surface of the patch; as a result, the patch's hydrophobicity decreases and its tackiness increases. It is only logical that this phenomenon should be further emphasized at higher oil inclusions.
Fig. 8.
Typical tack curve
Fig. 9.
Tackiness of patches with and without (w/o) starch. Bars headed by different letters (a, b) within and between treatments indicate a statistically significant difference at p < 0.05
Peeling Test
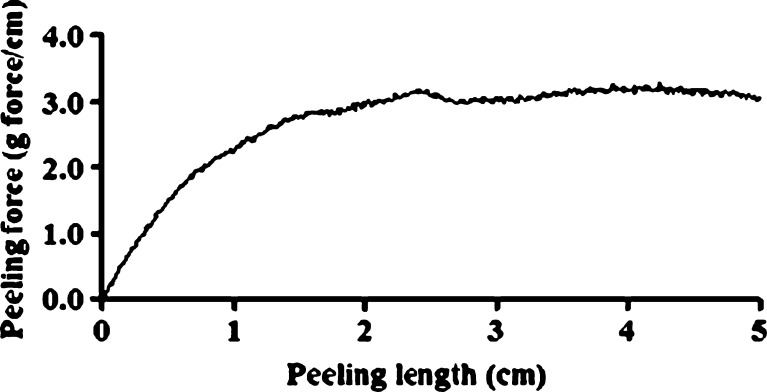
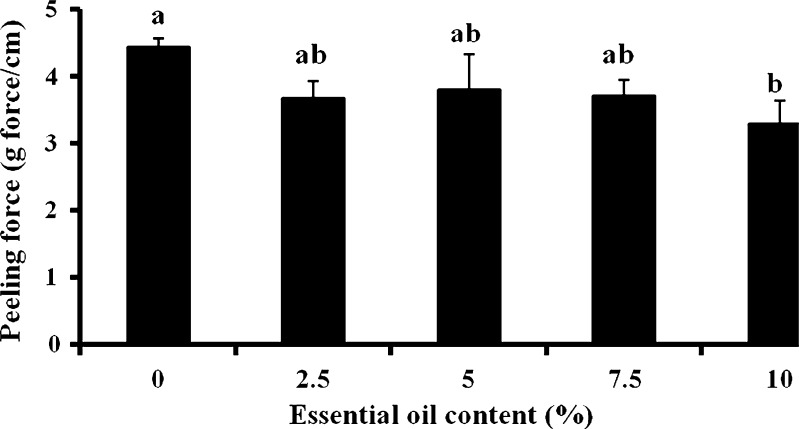
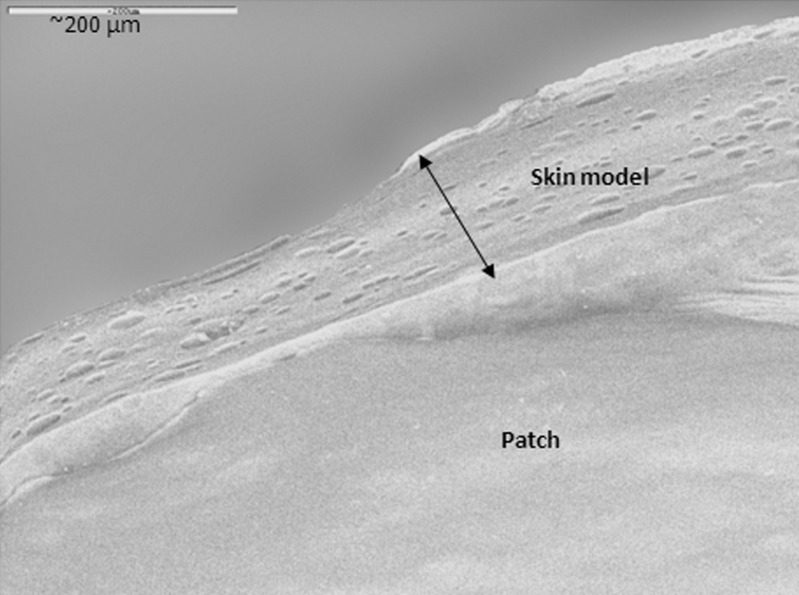
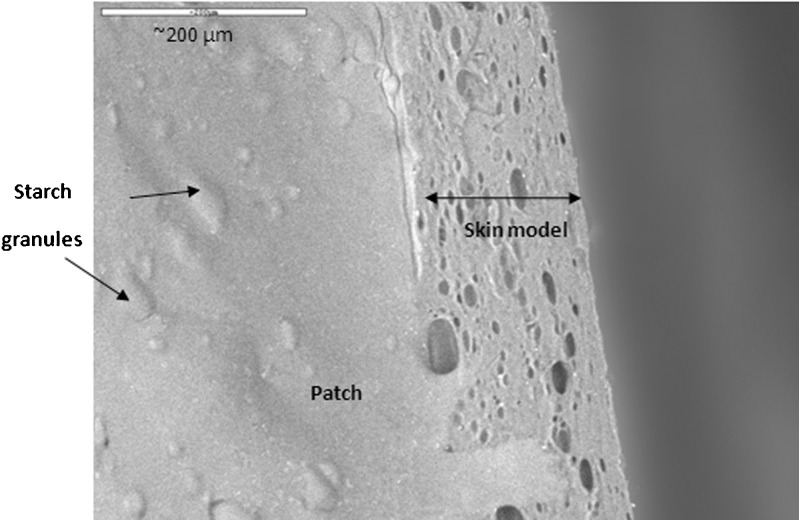
The patches' adhesive properties were studied via probe-tack and peeling tests. Patches are regularly peeled when they need to be replaced. In addition, in parallel to designing a patch that can withstand water (washing), sweat, and so on, and stay on the body for as long as required by its destined use, manufacturers may try to develop patches that can be peeled and re-adhered without losing their adhesion property. For test purposes, peeling from skin is simulated by attaching one side of the patch to a skin model, and attaching the other side to the grip of a UTM, at a 90° angle. The patch is then peeled at a deformation rate of 65 mm/min. The peeling of karaya-essential oil patches from model skin was not possible due to stretching, and then tearing of the rectangular-shaped patches during the test. To overcome its capacity to overstretch and to stabilize the patch (see earlier), 10% potato starch was added to the patch formulation. The typical peel relationships for these fortified patches are demonstrated in Fig. 10. Essential oil inclusion caused a reduction in peeling force, but the difference was not statistically significant for patches with 2.5% to 7.5% included oil (Fig. 11). The only significant reduction in peeling force was observed for patches with 10% included essential oil resulting in 3.2 ± 0.3 g force/cm, compared to patches without essential oil that had a mean peeling force of 4.4 ± 0.1 g force/cm. These results were in agreement with those obtained in the probe-tack test: inclusion of essential oil in the patch reduced its adhesion to the skin model. SEM micrographs of patches without or with the inclusion of starch granules are shown in Figs. 12 and 13, respectively. Both figures show that the patches, whether they include starch granules or not, adhered to the skin model with no detectable spaces between them. Figure 13 also shows oval “bodies” with a diameter of ∼50 μm which are not apparent in Fig. 12. It is hypothesized that these bodies are single or aggregated starch granules that are distributed in a homogeneous manner within the patch and are coated by its karaya gum matrix.
Fig. 10.
Typical peeling graph obtained by peeling a patch containing 2.5% essential oil and 10% starch from a skin model
Fig. 11.
Peeling force of patches with starch. Bars headed by different letters (a, b ) within and between treatments indicate a statistically significant difference at p < 0.05
Fig. 12.
Scanning electron micrograph of a patch without the inclusion of starch granules. Patch adhered to the skin model with no detectable space between them
Fig. 13.
Scanning electron micrograph of a patch with the inclusion of oval “bodies”: single or aggregated starch granules that are distributed in a homogeneous manner within the patch and are coated by its karaya gum matrix
Topographical Characterization of the Skin Model
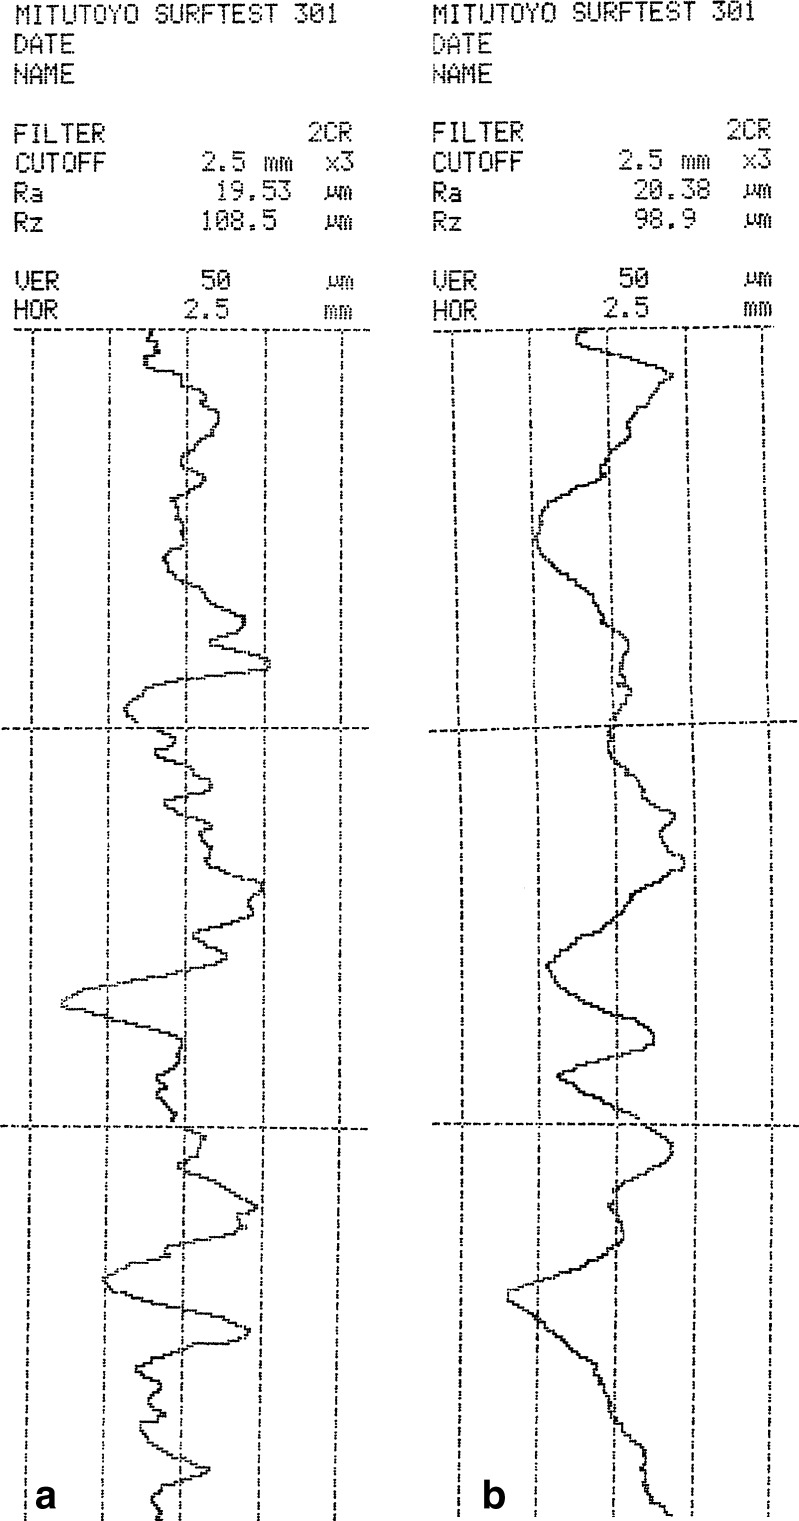
Both tack and peel tests used a skin model as the substrate for adhesion. The roughness of the skin model is very important since contact between the adhesive patch and the skin or skin model, and its adherence, will control the usefulness of the patch and its ability to deliver a future drug. Ra and Rz are the two main parameters used to characterize the roughness profile of a surface. Ra is defined as the average deviation of the absolute values of the roughness profile from the center line within the distance being measured. Rz is defined as the average of the vertical distances from the highest peaks to the lowest valleys within five equal sampling lengths. Figure 14 presents a typical roughness profile for a skin model with a thickness of 200 ± 12 μm.
Fig. 14.
Typical roughness profile for the skin model: a measurement taken in the “x” dimension; b measurement taken in the perpendicular “y” dimension
All presented Ra and Rz values are the means of three measurements, performed in the “x” and “y” dimensions of the skin model plane. The average Ra values in the “x” and “y” dimensions were 19.51 ± 0.15 and 19.61 ± 0.66 μm, respectively. The average Rz values in the “x” and “y” dimensions were 98.6 ± 8.7 and 94.6 ± 3.8 μm, respectively. Ra values for both pig and human skin have been reported at 20 ± 3 μm (38,39), similar to the Ra values obtained here for the skin model, indicating that the model mimics the topography of human skin and can serve as a good substitute for the study of patch adhesion. With essential oil patches, a few aims are expected to be met, among them high-quality adhesion, good compatibility with the skin, the option to use as small a patch as possible and the possibility of leaving it on the skin for longer periods, which includes the least possible irritability. The skin has a pH of 4 to 6 (40); consequently, if the pH of the patch lies outside that range, it could potentially irritate the skin. The pH of karaya-essential oil patches ranged from 4.44 to 4.65 ± 0.007, thus falling within the required pH range.
Color as a Parameter of Marketability
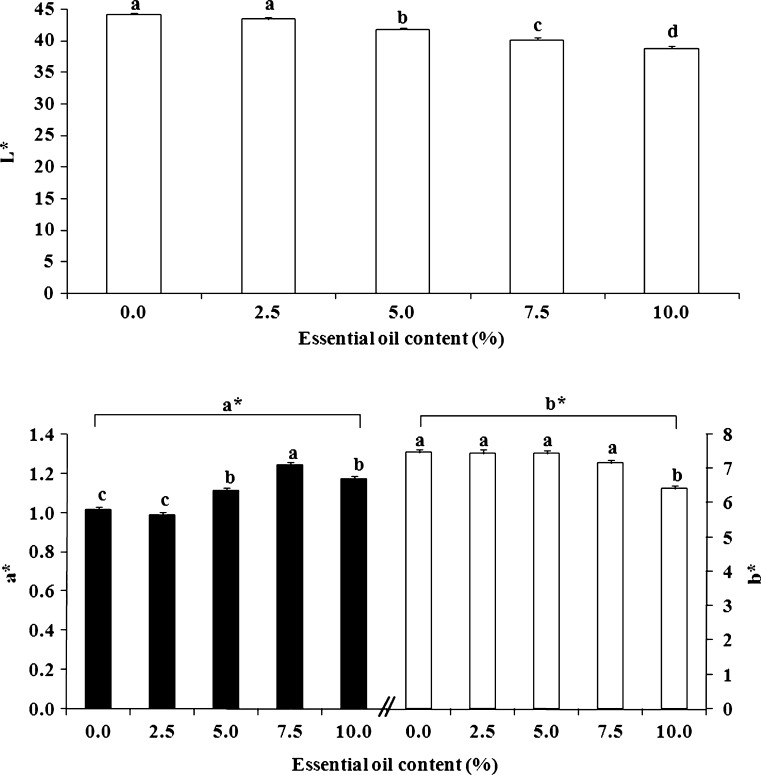
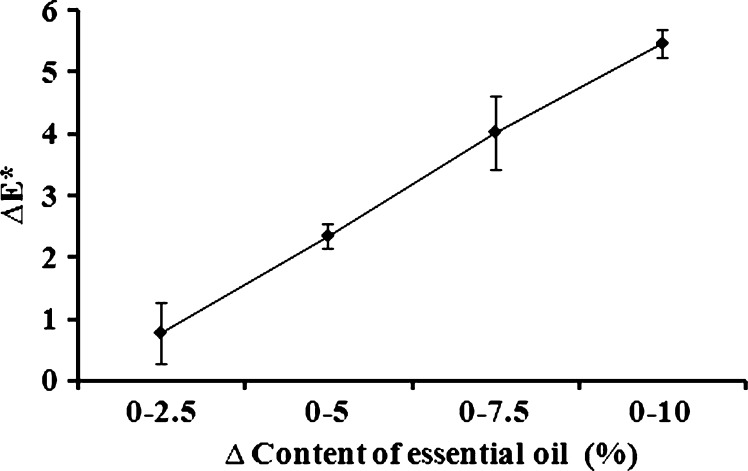
Many physical parameters are related to the quality of the patch matrix and its ability to serve as a drug reservoir and to adhere properly to skin or a skin model. Nevertheless, patches that include essential oils may be marketed for a variety of different purposes and consequently, their color relates directly to their marketing success or to esthetic considerations related to the differences between patch and skin color. In many cases, people will prefer light-colored or transparent rather than very dark patches, and we therefore recorded the colorimetric values L*, a*, and b* of the karaya-essential oil patches. The inclusion of essential oil in the normally light-yellow patch caused a reduction in L* values from 44.1 ± 0.1 for patches without essential oil to 38.8 ± 0.3 for patches with 10% essential oil, decreasing their lightness; a small increase in a* values from 1.01 ± 0.01 to 1.17 ± 0.03 was also observed, as well as a decrease in b* values from 7.46 ± 0.10 for the patch without essential oil to 6.42 ± 0.03 for the patch with 10% essential oil (Fig. 15). The main observable difference was the darkening of the patch (i.e., the change in L*). Nevertheless, to determine other small changes in color induced by the inclusion of essential oil, ΔE* was calculated. ΔE* values for each pair of patches (without essential oil and with a particular content of essential oil) were calculated, and we found that the higher the content of essential oil within the patch the bigger its color difference relative to a patch without essential oil (Fig. 16). Furthermore, the relationship between ΔE* and the change in essential oil content was linear within the different patches and therefore, interpolation within this range is justified for inclusion of essential oils at concentrations of less than 10%.
Fig. 15.
Colorimetric L*, a*, and b* values of karaya-essential oil patches. Different letters (a–d) within and between treatments indicate a statistically significant difference at p < 0.05
Fig. 16.
The color difference ΔE* between patches, versus the change in their essential oil content
CONCLUSIONS
Gum karaya patches can be easily formed and can contain a high proportion of essential oil. Understanding the physical properties of the patches will pave the way to the production of small-sized, light-colored, essential-oil-intact patches for topical purposes, aromatherapeutic applications, and essential oil delivery through the skin.
References
- 1.Price S, Price L. Aromatherapy for health professionals. London: Elsevier Health Sciences; 2007. [Google Scholar]
- 2.Wattenberg L. Inhibition of carcinogenesis by minor dietary constituents. Cancer Res. 1992;52:2085–2091. [PubMed] [Google Scholar]
- 3.Morse M, Stoner G. Cancer chemoprevention: principle and prospects. Carcinogenesis. 1993;14:1737–1746. doi: 10.1093/carcin/14.9.1737. [DOI] [PubMed] [Google Scholar]
- 4.Mansour M, Ginawi O, El-Hadiyah T, El-Khatib A, Al-Shabanah O, Al-Sawaf H. Effects of volatile oil constituents of Nigella sativa on carbon tetrachloride-induced hepatotoxicity in mice: evidence for antioxidant effects of thymoquinone. Res Commun Mol Pathol Pharmacol. 2001;110:239–251. [PubMed] [Google Scholar]
- 5.Bodake H, Panicker K, Kailaje V, Rao V. Chemopreventive effect of orange oil on the development of hepatic preneoplastic lesions induced by N- nitrosodiethylamine in rats: an ultrastructural study. Indian J Exp Biol. 2002;40:245–251. [PubMed] [Google Scholar]
- 6.Ozbek H, Ugras S, Dulger H, et al. Hepatoprotective effect of Foeniculum vulgare essential oil. Fitoterapia. 2003;74:317–319. doi: 10.1016/S0367-326X(03)00028-5. [DOI] [PubMed] [Google Scholar]
- 7.Jiri R, Parija T, Das B. d-Limonene chemoprevention of hepatocarcinogenesis in AKR mice: inhibition of c-jun and c-myc. Oncol Rep. 1999;6:1123–1127. doi: 10.3892/or.6.5.1123. [DOI] [PubMed] [Google Scholar]
- 8.Guyton K, Kensler T. Prevention of liver cancer. Curr Oncol Rep. 2002;4:464–470. doi: 10.1007/s11912-002-0057-4. [DOI] [PubMed] [Google Scholar]
- 9.Parija T, Das B. Involvement of YY1 and its correlation with c-myc in NDEA induced hepatocarcinogenesis, its prevention by d-limonene. Mol Biol Rep. 2003;30:41–46. doi: 10.1023/A:1022207630482. [DOI] [PubMed] [Google Scholar]
- 10.Warnke PH, Becker ST, Podschun R, et al. The battle against multi-resistant strains: renaissance of antimicrobial essential oils as a promising force to fight hospital-acquired infections. J Cranio-Maxillo-Facial Surgery. 2009;37:392–397. doi: 10.1016/j.jcms.2009.03.017. [DOI] [PubMed] [Google Scholar]
- 11.Woollard AC, Tatham KC, Barker S. The influence of essential oils on the process of wound healing: a review of the current evidence. J Wound Care. 2007;16:255–257. doi: 10.12968/jowc.2007.16.6.27064. [DOI] [PubMed] [Google Scholar]
- 12.Komiya M, Sugiyama A, Tanabe K, Uchino T, Takeuchi T. Evaluation of the effect of topical application of lavender oil on autonomic nerve activity in dogs. Am J Vet Res. 2009;70:764–769. doi: 10.2460/ajvr.70.6.764. [DOI] [PubMed] [Google Scholar]
- 13.Ballabenia V, Tognolinia M, Chiavarinia M, et al. Novel antiplatelet and antithrombotic activities of essential oil from Lavandula hybrida Reverchon ‘grosso’. Phytomedicine. 2004;11:596–601. doi: 10.1016/j.phymed.2004.01.002. [DOI] [PubMed] [Google Scholar]
- 14.Rees WDW, Evans BK, Rhodes J. Treating irritable bowel syndrome with peppermint oil. Br Med J. 1979;2:835. doi: 10.1136/bmj.2.6194.835. [DOI] [PMC free article] [PubMed] [Google Scholar]
- 15.Somerville KW, Richmond GD, Bell GD. Delayed release peppermint oil capsules (Colpermin) for the spastic colon syndrome: a pharmacokinetic study. Br J Clin Pharmacol. 1984;18:638. doi: 10.1111/j.1365-2125.1984.tb02519.x. [DOI] [PMC free article] [PubMed] [Google Scholar]
- 16.Gelal A, Jacob P, III, Yu L, Benowitz NL. Disposition kinetics and effects of menthol. Clin Pharmacol Ther. 1999;66:128–135. doi: 10.1053/cp.1999.v66.100455001. [DOI] [PubMed] [Google Scholar]
- 17.Marzulli FN, Maibach HI. Dermatotoxicology. Boca Raton: CRC Press; 1977. [Google Scholar]
- 18.Jäger W, Buchbauer G, Jirovetz L, Fritzer M. Percutaneous absorption of lavender oil from a massage oil. J Soc Cosmet Chem. 1992;43:49–54. [Google Scholar]
- 19.Aulton ME. Pharmaceutics: the science of dosage form design. London: Elsevier Limited, Churchill Livingstone; 2002. [Google Scholar]
- 20.Kampf N, Nussinovitch A. Rheological characterization of κ-carrageenan soy-milk gels. Food Hydrocolloids. 1997;11:261–269. doi: 10.1016/S0268-005X(97)80055-0. [DOI] [Google Scholar]
- 21.Helmreich S, Nussinovitch A. Elasticity determination of adhesive patches with filler inclusion. J Adhes Sci Technol. 2009;23:269–280. doi: 10.1163/156856108X388182. [DOI] [Google Scholar]
- 22.Olkku JE, Sherman P. Compression testing of cylindrical samples with an Instron Universal Testing machine. In: Sherman P, editor. Food texture and rheology. London: Academic Press; 1979. p. 157. [Google Scholar]
- 23.Mohsenin NN. Physical properties of plant and animal materials. 2. New York: Gordon & Breach; 1986. [Google Scholar]
- 24.Kaletunic G, Normand MD, Johnson EA, Peleg M. Degree of elasticity determination in solid foods. J Food Sci. 2006;56:950–953. doi: 10.1111/j.1365-2621.1991.tb14613.x. [DOI] [Google Scholar]
- 25.Nussinovitch A, Kaletunc G, Normand MD, Peleg M. Recoverable work versus asymptotic relaxation modulus in agar, carrageenan and gellan gels. J Texture Stud. 1990;21:427–438. doi: 10.1111/j.1745-4603.1990.tb00492.x. [DOI] [Google Scholar]
- 26.Thomas GB, Finney RL. Calculus and analytic geometry. Reading: Addison Wesley; 1984. [Google Scholar]
- 27.Charkoudian JC. Model human skin. 1989. US Patent #4,877,454.
- 28.Charkoudian JC. A model skin surface for testing adhesion to skin. J Soc Cosmet Chem. 1988;39:225–234. [Google Scholar]
- 29.Ben-Zion O, Nussinovitch A. A modified apparatus for testing the probe tack of pressure-sensitive adhesive materials. J Adhes Sci Technol. 2008;22:205–216. doi: 10.1163/156856108X306957. [DOI] [Google Scholar]
- 30.Portelli GB. Testing, analysis and design of structural adhesive joints. In: Hartshorn SR, editor. Structural adhesives chemistry and technology. New York: Plenum Press; 1986. pp. 407–449. [Google Scholar]
- 31.Ben-Zion O, Nussinovitch A. Physical properties of hydrocolloid wet glues. Food Hydrocolloids. 1997;11:429–442. doi: 10.1016/S0268-005X(97)80041-0. [DOI] [Google Scholar]
- 32.Nussinovitch A. Hydrocolloid applications: gum technology in the food and other industries. London: Blackie Academic & Professional; 1997. pp. 134–137. [Google Scholar]
- 33.Nussinovitch A. In: Water-soluble polymer applications in foods. Oxford: Blackwell Publishing Ltd; 2003. pp. 19–25. [Google Scholar]
- 34.Nussinovitch A, Shcherbina Y, Roth Z. Adhesive-elastic-swellable-reusable natural expressed/essential oil topical patches. US patent application. 2009.
- 35.Nussinovitch A, Peleg M. Mechanical properties of a raspberry product texturized with alginate. J Food Process Preserv. 1990;14:267–278. doi: 10.1111/j.1745-4549.1990.tb00133.x. [DOI] [Google Scholar]
- 36.Rassis DK, Saguy IS, Nussinovitch A. Collapse, shrinkage and structural changes in dried alginate gels containing fillers. Food Hydrocolloids. 2002;16:139–151. doi: 10.1016/S0268-005X(01)00071-6. [DOI] [Google Scholar]
- 37.Gal A, Nussinovitch A. Hydrocolloid carriers with filler inclusion for dilitaizm hydrocholoride release. J Pharm Sci. 2007;96:168–178. doi: 10.1002/jps.20775. [DOI] [PubMed] [Google Scholar]
- 38.De Paepe K, Lagarde JM, Gall Y, Roseeuw D, Rogiers V. Microrelief of the skin using a light transmission method. Arch Dermatol Res. 2000;292:500–510. doi: 10.1007/s004030000166. [DOI] [PubMed] [Google Scholar]
- 39.Ben-Yaakov A. Properties of tree gum exudate patches for transdermal and topical drug delivery. The Hebrew University of Jerusalem, Israel: M.Sc. Thesis; 2007. [Google Scholar]
- 40.Ghosh TK, Pfister WR, Yum SI. Transdermal and topical drug delivery systems. Illinois: Interpharm Press; 1997. [Google Scholar]


