Abstract
Delamination, or the generation of glass flakes in vials used to contain parenteral drug products, continues to be a persistent problem in the pharmaceutical industry. To understand all of the factors that might contribute to delamination, a statistical design of experiments was implemented to describe this loss of chemical integrity for glass vials. Phase I of this study focused on the effects of thermal exposure (prior to product filling) on the surface chemistry of glass vials. Even though such temperatures are below the glass transition temperature for the glass, and parenteral compounds are injected directly into the body, data must be collected to show that the glass was not phase separating. Phase II of these studies examined the combined effects of thermal exposure, glass chemistry, and exposure to pharmaceutically relevant molecules on glass delamination. A variety of tools was used to examine the glass and the solution contained in the vial including: scanning electron microscopy and dynamic secondary ion mass spectroscopy for the glass; and visual examination, pH measurements, laser particle counting, and inductively coupled plasma–optical emission spectrometry for the analysis of the solution. The combined results of phase I and II showed depyrogenation does not play a significant role in delamination. Terminal sterilization, glass chemistry, and solution chemistry are the key factors in the generation of glass flakes. Dissolution of silica may be an effective indicator that delamination will occur with a given liquid stored in glass. Finally, delamination should not be defined by the appearance of visible glass particulates. There is a mechanical component in the delamination process whereby the flakes must break away from the interior vial surface. Delamination should be defined by the observation of flakes on the interior surface of the vial, which can be detected by several other analytical techniques.
Key words: delamination, glass corrosion, ICP–OES, particle formation, pH
INTRODUCTION
The appearance of visible particulates in parenteral formulations is an unacceptable event. Because these products enter the body directly, extra care must be taken to ensure patient safety. Additionally, there is a regulatory expectation that packaging (in this case, the vial) in no way decreases the quality of the product. Glass delamination is a negative event for both of these considerations.
Delamination is relatively well described in the pharmaceutical literature; however, the mechanism is not well-understood (1–6). In the materials science literature, there is a wealth of information on glass degradation, most of which focuses on water diffusion in silicate networks (7–25). Unfortunately, there has been little crossover of information between the drug development and materials science worlds.
A case study was recently published that described the process of delamination of glass vials in terms of changes that occur to the glass chemistry (26). This study looked at the effects of drug product exposure on the glass chemistry. Being a failure analysis, however, the data did not identify the effects of the drug product process on the chemical durability of the glass, and the loss of chemical resistance. In this investigation, a study was designed to identify those factors in pharmaceutical manufacturing that contribute to glass delamination.
Historically, pharmaceutical analyses for glass delamination have focused on the impact of delamination on drug product quality, resulting in tests for the liquid itself such as changes in potency and purity, pH, and so on (6,27). The aforementioned study (26) showed that the glass chemistry on the interior of the vial was changed significantly upon extended contact with the parenteral liquid. The interior surface was enriched with glass-forming elements found in groups IA and IIA, which are far less durable than a glass where silicates form the backbone.
Most of the relevant information on glass instability of this nature has been written about glass antiquities that have been exposed to ambient humidity for centuries (28–31). From a phenomenological perspective, delamination and the degradation of glass by ambient moisture (referred to as crizzling) are direct analogs. Although the glass chemistry and time encountered for crizzling are different from glass delamination, the phenomenology is the same.
MATERIALS AND ANALYTICAL METHODS
Materials Used
Vial Types
Three vial types were used: vial A is a sodium borosilicate type I (similar to Pyrex) that has been treated on the interior with ammonium sulfate to reduce surface alkalinity; vial B (uncoated) is a type I vial that received no ammonium sulfate treatment; and vial B (coated) that has received an additional interior coating of SiO2via chemical vapor deposition. Table I contains the nominal compositions for the three vial types that were used.
Table I.
Nominal Composition of Vials Used
| Vial A | Vial B (uncoated) | Vial B (coated) | |
|---|---|---|---|
| Oxide | wt.% | wt.% | wt.% |
| SiO2 | 80.5 | 75.0 | 75.0 |
| B2O3 | 12.6 | 10.5 | 10.5 |
| Al2O3 | 2.2 | 5.0 | 5.0 |
| Na2O | 4.2 | 7.0 | 7.0 |
| K2O | <0.1 | – | – |
| CaO | <0.1 | 1.5 | 1.5 |
| Ammonium sulfate treated | Yes | No | No |
| Interior coating of SiO2 | No | No | Yes |
Chemicals
The hippuric and glutaric acids were commercially available reagent grade chemicals. The premexetred was made internally at Eli Lilly and Company.
Analytical Methods
A suite of conventional and advanced techniques, described below, was utilized to either characterize the solutions contained in the vials, or the vials themselves, after solution contact. Visual inspection was also performed in this study, as it is a routine analysis for parenteral manufacturing.
pH was measured using a standard electronic pH meter that was calibrated according to internal standard operating procedures.
Inductively Coupled Plasma Analysis
Elemental concentrations of the test solutions were measured using Varian Liberty Axial sequential and Varian Vista Pro Axial simultaneous inductively coupled plasma (ICP) optical emission spectrometers. Both systems were configured with Glass Expansion (West Melbourne, Victoria, Australia) Conikal™ concentric nebulizers, Varian double-pass cyclonic spray chambers, and Varian high-dissolved solids quartz torches with 2.3 mm ID injector tubes. Forward RF power was set at 1.2 KW for both systems. Multi-element analyses were conducted; all target elements were analyzed in a single analytical run.
The contents of three vials from a specific storage condition and interval were pooled together into a 50-mL Falcon polypropylene tube. Test solutions were analyzed directly without additional dilution or preparation. A 0.5 ppm yttrium internal standard solution was T-ed into the sample inlet line to compensate for solution matrix induced response biases. Working calibration standards were prepared from commercial stock standard solutions provided by VHG Labs, Inc. (Manchester, NH, USA). Working standards were prepared at concentrations that encompassed the respective element concentrations in the test solutions. Where reported, the lowest respective standard concentration for each individual element was defined as the limit-of-quantitation for these measurements. A separate check standard prepared at an intermediate concentration was analyzed at the beginning, the end, and after every fifth sample. The acceptance criterion for the check standard analysis was ±15%. Test solution results that were not bracketed by check standard results meeting the acceptance criteria were repeated.
Scanning electron microscopy (SEM) was performed to characterize the morphology of inner surface of selected glass vials after solution contact. Images were obtained on an FEI Quanta 200 FEG microscope using an accelerating voltage of 5 keV. Being a field emission environmental SEM, the microscope was operated in low-vac mode to eliminate the need to sputter coat the sample with a metal coating. When flakes were found in a given vial, energy-dispersive X-ray spectroscopy confirmed that the flakes present in the solution were glass. For this analysis, the accelerating voltage was changed to 25 keV to have sufficient energy to excite the elements present.
Dynamic secondary ion mass spectroscopy (D-SIMS) was employed for compositional analysis of interior surface of vials as a function of depth. This technique utilizes an energetic primary ion beam (oxygen or cesium) to bombard a sample surface generating positively or negatively charged secondary ions, then followed by mass spectrometry of those secondary ions. One major advantage of D-SIMS is its capability of detecting full elemental coverage, from H to U. In addition, D-SIMS is capable of detecting trace impurities with a sensitivity of greater than one part per billion. The data were collected from a Quadrapole D-SIMS instrument. The instrument conditions were optimized for overall depth resolution and sensitivity. The sensitivity of some elements and/or depth (layer definition) resolution may improve under separate analytical conditions. Cesium was used as the primary ion beam, with a beam energy of 3 keV and incident angle as 60°. The surface charge was neutralized with an electron beam. The secondary ions were detected in positive mode. No oxygen leak or liquid nitrogen cold trap was used during the analysis. The depth scales were calibrated by measuring the crater depth using a stylus profilometer as a function of time.
Spectrex™ Laser Particle Counting Instrument
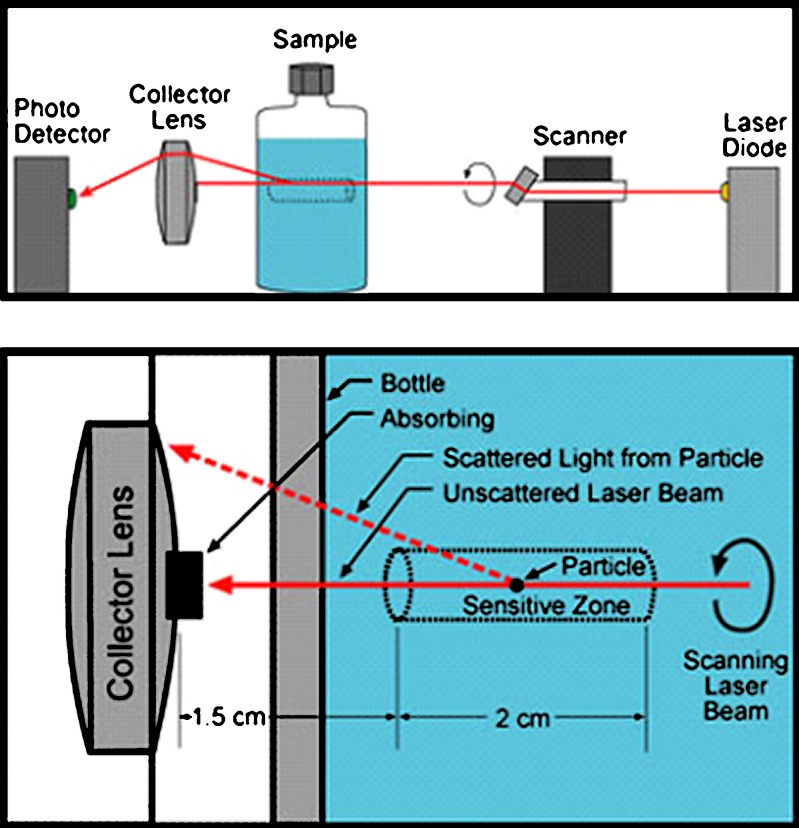
The Spectrex™ laser particle-counting instrument (PC-2000) was used to quantify the generation of glass particles in situ for the filled vials placed on stability. The instrument utilizes the near-angle light scattering principle by passing a rotating laser beam through the glass container and then focusing the near-angle light pulses, resulting from the laser beam/particle collisions, on to the photo detector for conversion into particle count and size data. The technique avoids the problems that often come with traditional flow-through methods, such as cross-contamination. Another clear advantage for the technique is that the same sample set can be analyzed at various time points, thereby removing any statistical sampling issues encountered when the sample is consumed in the analysis, such as in other particle counting tests (e.g., HIAC light obscuration testing). Figure 1 shows schematic drawings of the Spectrex instrument design.
Fig. 1.
Schematic of Spectrex laser particle counter operation (courtesy of Spectrex Corporation)
The unique lens arrangement of the instrument allows only particles in the central volume of the container, also known as the “sensitive zone,” to be counted. To ensure that the sensitive zone falls within the container, a small vial attachment was utilized, since the internal diameter of the vials in the study were less than 25 mm and greater than 13 mm. The attachment effectively changed the particle analysis range from 0.5–100 μm to 3–100 μm and required the use of the integrated F11 and F81 filter files within the analysis software. Table II contains the relevant operating parameters for this instrument. Performance was verified daily by measuring a standard of known particle size and counts. The standard, provided by the instrument manufacturer, contained polystyrene spheres in an alcohol/freon liquid matrix. Every effort was made to minimize background noise on these measurements such as cleaning the vial exterior to remove surface contaminants. To minimize particle settling, each vial was inverted and gently swirled for approximately 10 s prior to measurement. After swirling, the vials were placed upright in the instrument and analyzed for a total measurement time of 64 s seconds per filter file. Each vial was analyzed twice and the results averaged. Two vials per condition were tested via the laser particle counting technique to manage the large volume of vials for analysis and permit the prompt return of the samples to the stability chambers.
Table II.
Operational Parameters Used for Spectrex Instrument
| Instrument parameters | Value |
|---|---|
| Class II laser | 0.9 mW, 670.8 nm |
| Gain | 5.95× |
| Offset | 0.00 V |
| Counter signal calibration parameters | |
| Pre-gain | 6.83× |
| Offset | −0.014 V |
| V Ref | 6.90 V |
| Operating parameters | |
| Scan time | 32 s per filter file (64 s total) |
| Dilution factor | 1:1 |
| Volume exponent | 1.75 |
| Specific gravity | 1 |
| Threshold | 10 |
| Filter file(s) | F11 and F81 |
| Binning standard | Spectrex default (narrow bins) |
HPLC potency analysis was performed to check if the vials were processed correctly according to manufacturing standards, and to verify the chemical integrity of the solutions while being stressed at the prescribed time/temperature combination. Because no data is being presented, a description of the method will not be included here.
Visual inspection of the vials was conducted, per the European Pharmacopeia (EP 2.09.20).
Experimental Design
Phase I of this study was designed to examine the effects of depyrogenation on the vials prior to product filling. Even though these temperatures are well below the glass transition temperature of borosilicate glasses (maximum time/temperature exposure was 18 h at 350°C), pharmaceutical practices mandate confirmation with data; therefore, the study was conducted. Analysis of the vials exposed to various thermal cycles confirmed that the glass surface chemistry was not changing; therefore, none of the data will be presented.
After the completion of phase I, a second statistical design was created to identify the potential factors affecting glass delamination (post-depyrogenation), including: glass chemistry, depyrogenation cycle, sterilization cycle, the chemical structure of the active pharmaceutical ingredient, and the time/temperature conditions for storage of the filled vials.
Table III contains the variables investigated and their corresponding levels.
Table III.
Variables Used for this Phase of the Study
| Factor | Specific levels for each factor |
|---|---|
| Vial types | A, B (uncoated), B (coated) |
| Depyrogenation temperature, ºC | 250, 350 (time was fixed at 4 h) |
| Terminal sterilization cyclesa | 0, 2 |
| Test solutions | 3, pertaining to the chemical structure of the active pharmaceutical ingredient. More information provided below |
| Storage conditions | 60ºC, 40ºC, 25ºC, 5ºC (held in reserve) |
aA terminal sterilization cycle is defined as 15 min at 122–125°C in an autoclave
Depyrogenation and Sterilization Cycles
Phase I of this study showed that exposure to elevated temperatures during depyrogenation did not produce any changes in surface chemistry on the vial interior. As 250 and 350°C are temperatures used for depyrogenation, both temperatures were used in the phase II to provide a critical linkage to actual processing conditions; however, time of exposure was fixed at 4 h. Terminal sterilization was performed by autoclaving the filled vials using the cycle of 122–125°C for 15 min.
Test Solutions
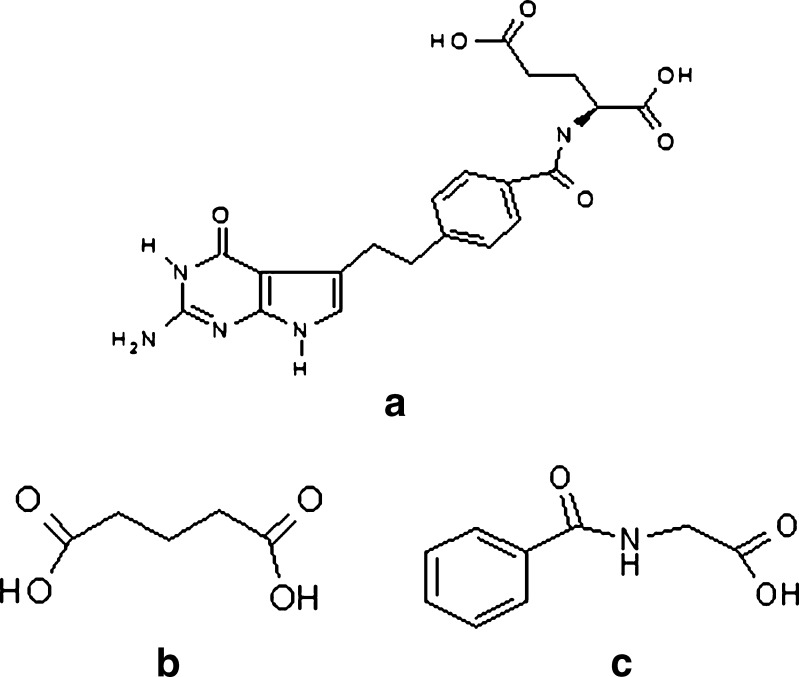
Figure 2 shows the structures of the molecules that were used in this study. Figure 2a is the parent molecule that was investigated in the original failure analysis (26). The other two chemicals, glutaric, and hippuric acid, are chemical moieties in the molecule that were hypothesized to be active agents in the delamination process.
Fig. 2.
Structural diagrams of molecules used in this study: (a) pemetrexed, (b) glutaric acid, and (c) hippuric acid
The solutions were prepared in equimolar amounts as compared with the initial drug product solution in which delamination was first observed.
Storage Conditions
The temperatures selected for vial storage are typical of the conditions that parenteral liquids would encounter either during accelerated storage conditions to predict product stability (60 and 40°C, respectively) or during actual product use (25 and 5°C).
RESULTS
Because of the significant number of vials that were used in this study, it is not possible to present all of the data in a single venue. Additionally, the same experimental trends were observed with all three test solutions. Because of this, only data for glutaric acid will be presented. It is worth emphasizing that all three chemicals caused the glass vials to delaminate.
pH Measurements
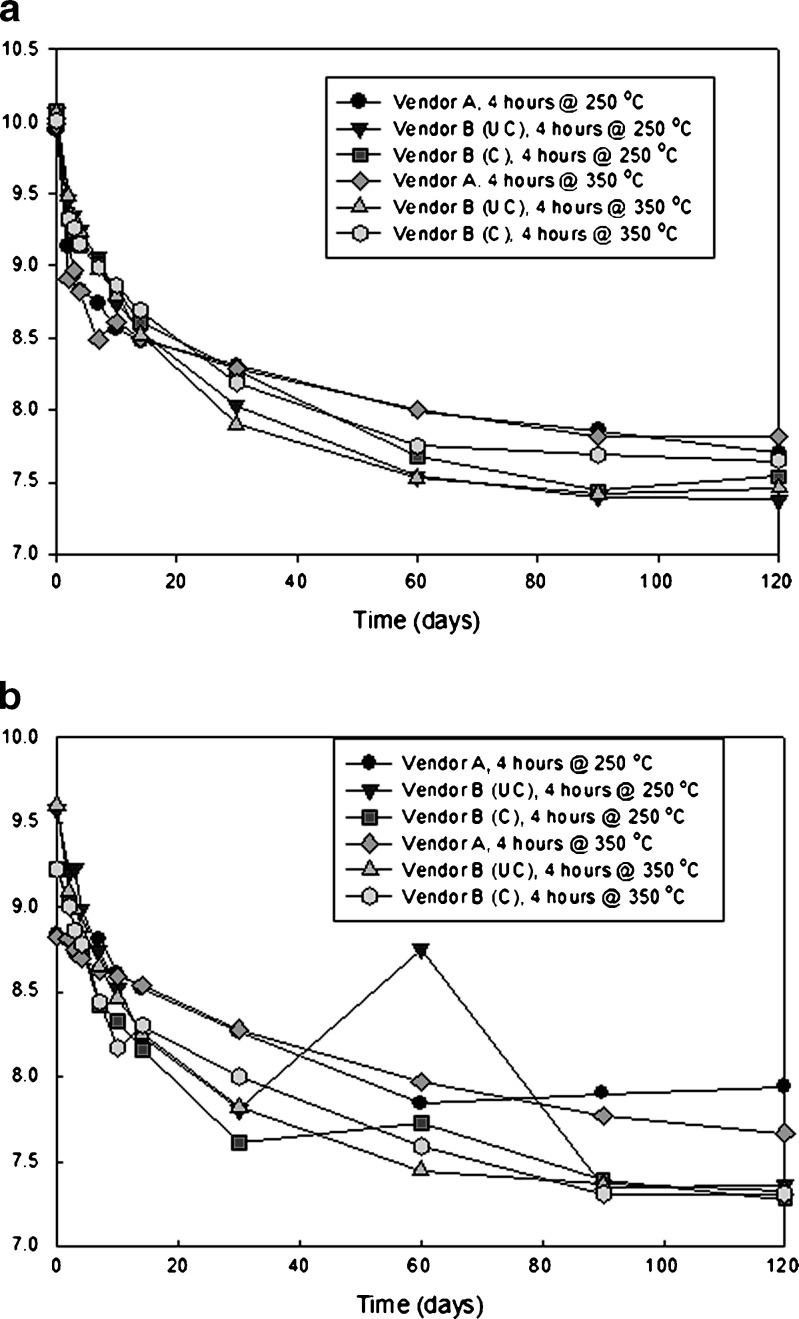
Figure 3 contains plots of pH versus time for vials receiving zero and two sterilization cycles that were stored at 60°C for 120 days. Unsterilized vials start at a higher initial pH than those that received two sterilization cycles. pH decreases at a faster initial rate for the unsterilized vials as well.
Fig. 3.
Plot showing pH as a function of time for glutaric acid solutions in different presentations stored at 60°C: a vials with no terminal sterilization, b vials receiving two (2) terminal sterilization cycles. (UC uncoated, C coated. Additionally, the data point at 60 days for uncoated vendor B vials is an anomaly that has no assignable cause)
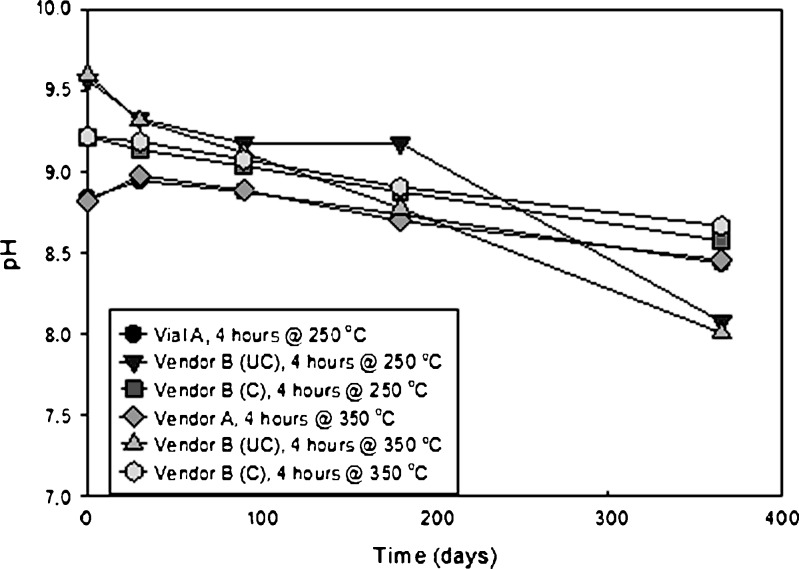
Figure 4 is a plot of pH vs. time for vials that received two sterilization cycles and were stored at 25°C. These initial pH values are approximately the same for the 60°C vials, but the rate of decline is much slower due to kinetic events. At 365 days, the pH has not approached an equilibrium value. The significance of these data will be presented in the DISCUSSION section.
Fig. 4.
pH as a function of time for glutaric acid exposed to two terminal sterilization cycles in various presentations stored at 25°C
ICP–OES Analysis of Glutaric Acid Solutions
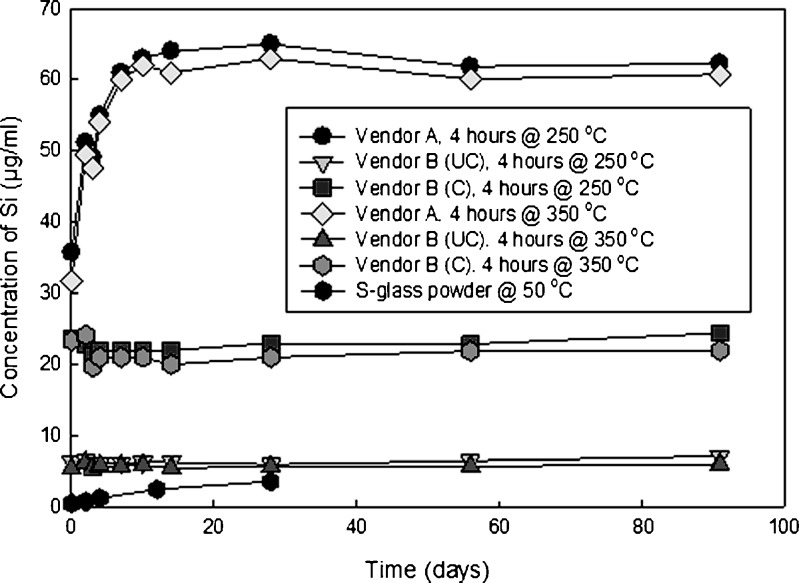
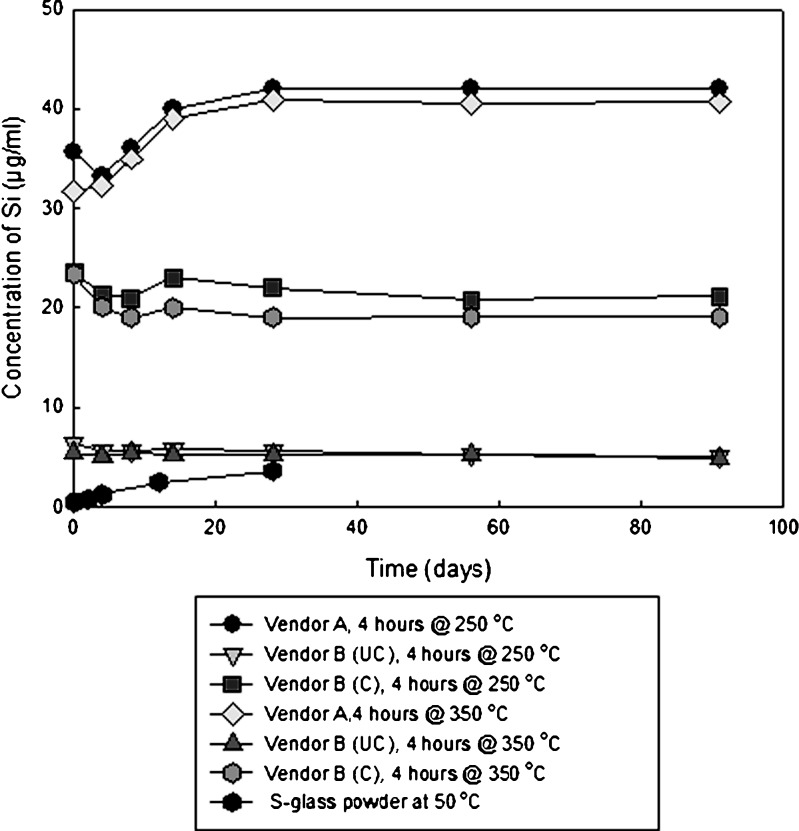
Figure 5 is a plot of silicon content for vials containing glutaric acid that were stored at 60°C, while Fig. 6 is a plot of the silicon content for vials stored at 40°C. The amount of silicon that is dissolved is a function of temperature and vial type. The levels of silicon for both vendor B vials remain constant over time. The amount of silicon that enters solution for vendor A vials increases over time. The vendor B coated vials have a higher concentration than their uncoated counterparts do, as the entire interior contact surface of the vial with the liquid is composed of 100% SiO2.
Fig. 5.
Plot of silicon concentration as a function of time for vials containing glutaric acid, with two terminal sterilization cycles, stored at 60°C. The S-glass data were obtained from powder being immersed in deionized water (pH = 7) at 50°C, and is being shown as a comparator (32)
Fig. 6.
Plot of silicon concentration as a function of time for vials containing glutaric acid, with two terminal sterilization cycles, stored at 40°C. The S-glass data were obtained from powder being immersed in deionized (pH = 7) water at 50°C, and is being shown as a comparator (32)
SEM Analysis of Vial Interiors
Figure 7 shows representative electron micrographs taken from the interior of each of the three vial types (350°C for 4 h, two terminal sterilization cycles, storage at 40°C) after exposure to glutaric acid for 14 days. The interior surface for vendor A vials shows aggressive attack. One can observe where a flake has already broken away from the surface layer. Vendor B vials, both coated and uncoated, show preliminary signs of flakes forming on the vial interior; however, there was no observable sign of flakes breaking off the interior surface. It is remarkable to note the damage in vendor A vials after only 2 weeks of exposure. Such images offer invaluable insight into the ability of a pharmaceutical compound to interact with a glass vial, producing glass flakes in the drug product.
Fig. 7.
Scanning electron micrographs for vials containing glutaric acid, stored at 40°C (4 h at 350°C, two terminal sterilization cycles) for 2 weeks: a vendor A, b vendor B vials, uncoated; and c vendor B vials, coated
D-SIMS Elemental Depth Profiles
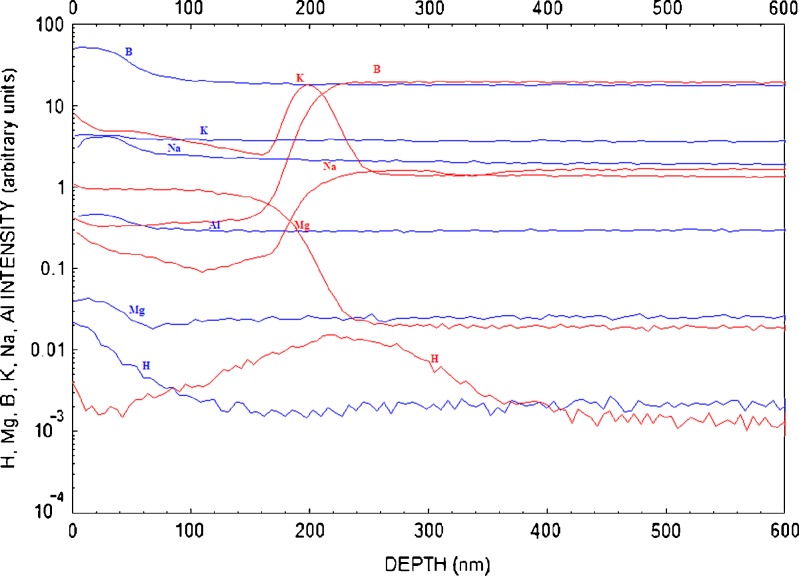
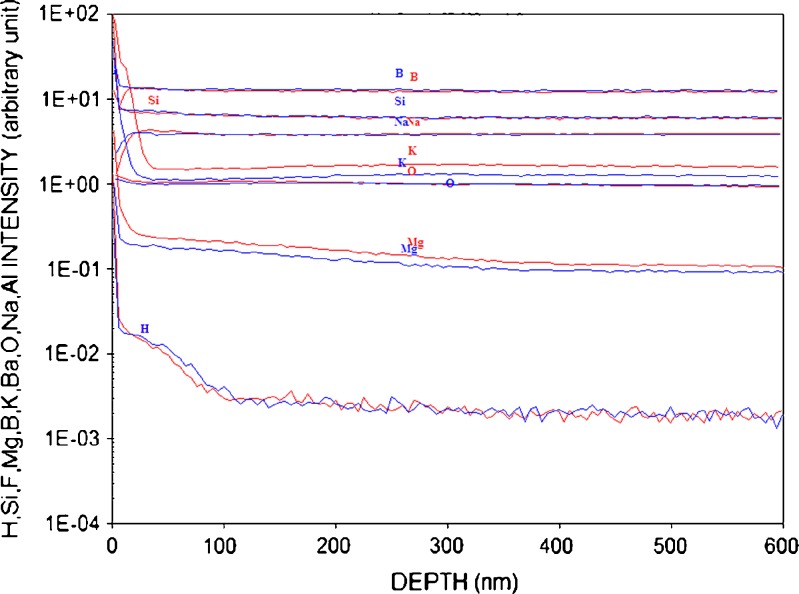
Figure 8 shows an elemental depth profile for a vendor A vial that received two sterilization cycles and was exposed to glutaric acid for 14 days (red), and for the same vial that received no exposure to the drug product (blue). Note the surface enrichment (at approximately 200 nm) with IA and IIA elements (Mg, K, and Na).
Fig. 8.
Depth profile of vial interior using D-SIMS for a vendor A vial (depyrogenated at 250°C for 4 h, receiving two terminal sterilization cycles) with exposure to glutaric acid after 14 days (red), and no exposure to glutaric acid (blue)
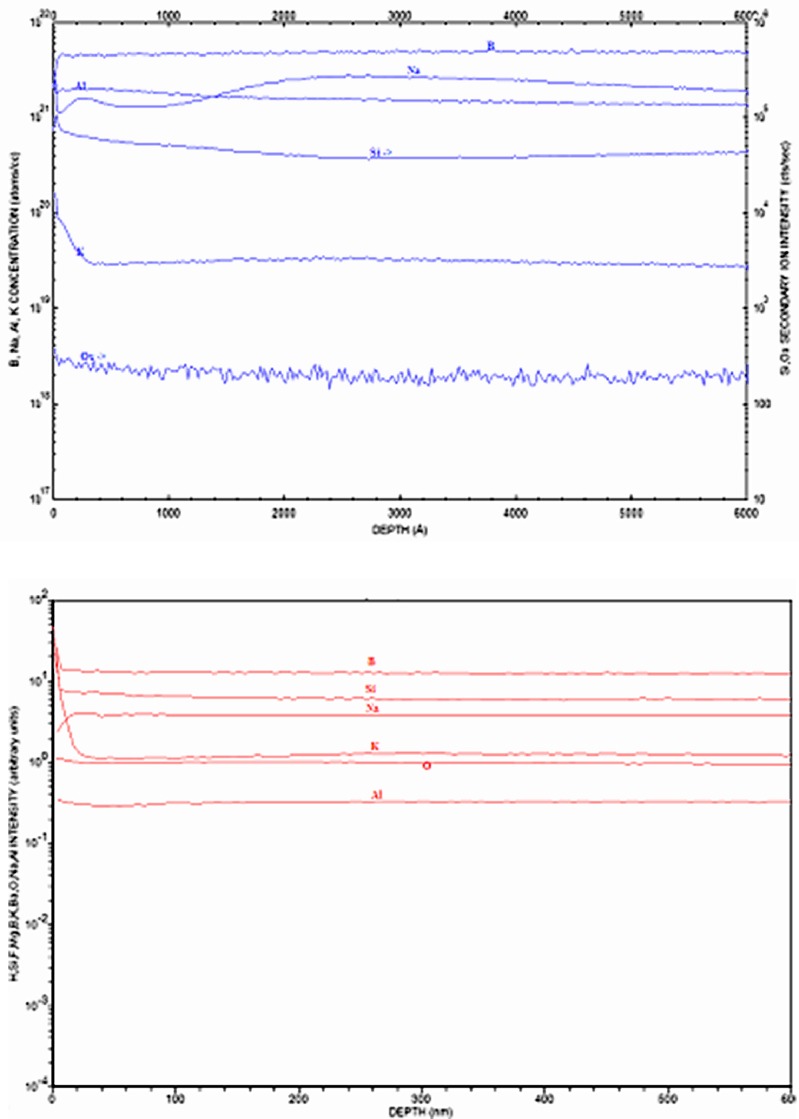
Figure 9 shows two D-SIMS profiles. One was obtained from an uncoated vendor B vial that was exposed to glutaric acid for 14 days at 60°C. The second set of spectra was taken from a vial that saw no exposure to glutaric acid. The exposure to product has not significantly altered the surface chemistry of this glass as compared to vendor A material (Note: the scale on these two spectra is arbitrary units. Only relative comparisons should be made).
Fig. 9.
Depth profile of vial interior using D-SIMS for a vendor B, uncoated vials (depyrogenated at 350°C for 4 h, receiving two terminal sterilization cycles) with no exposure to glutaric acid (blue), and exposure to glutaric acid after 14 days at 60°C (red)
Figure 10 shows comparable depth profiles for vendor B vials (uncoated and coated, respectively) that have been exposed to glutaric acid. The uncoated vendor B vials (blue) do show a slight enrichment of IA and IIA elements, but not to the extent exhibited by the vendor A material. The coated vendor B vials (red) still have evidence of the CVD coating of SiO2, but the majority of the coating has gone into solution, as supported by the ICP–optical emission spectrometry (OES) data provided in this paper. Mass balance calculations showed that the amount of silica that went into solution from the vial inner surface was consistent with the increase in silicon concentration measured by ICP–OES.
Fig. 10.
Depth profile of vial interior using D-SIMS for a vendor B, uncoated (blue) and coated (red) vials (depyrogenated at 350°C for 4 h, receiving two terminal sterilization cycles) with exposure to glutaric acid after 14 days
Spextrex Particle Data and Visual Examination of Vials
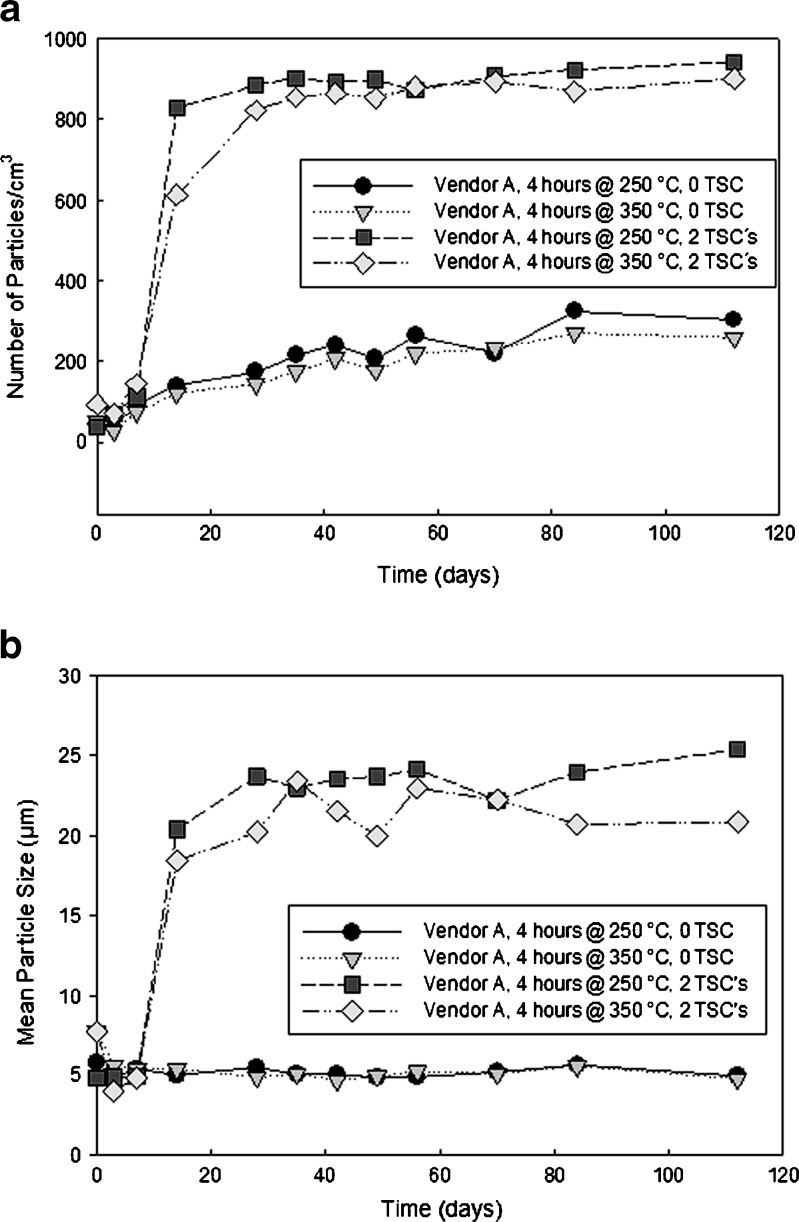
Figure 11 shows plots of the number and size of particles measured by the Spectrex instrument for vendor A vials stored at 60°C, exposed to zero and two terminal sterilization cycles. These data clearly illustrate the effect of terminal sterilization on the delamination phenomenon. Vials not exposed to the two sterilization cycles show a gradual increase in particle count over time, while those receiving the sterilization cycles show a rapid increase in particle count in less than 20 days
Fig. 11.
Plots of number (a) and average particle size (b) vs. time for vendor A vials with glutaric acid solutions receiving zero and two terminal sterilization cycles, using the Spectrex laser diffraction instrument
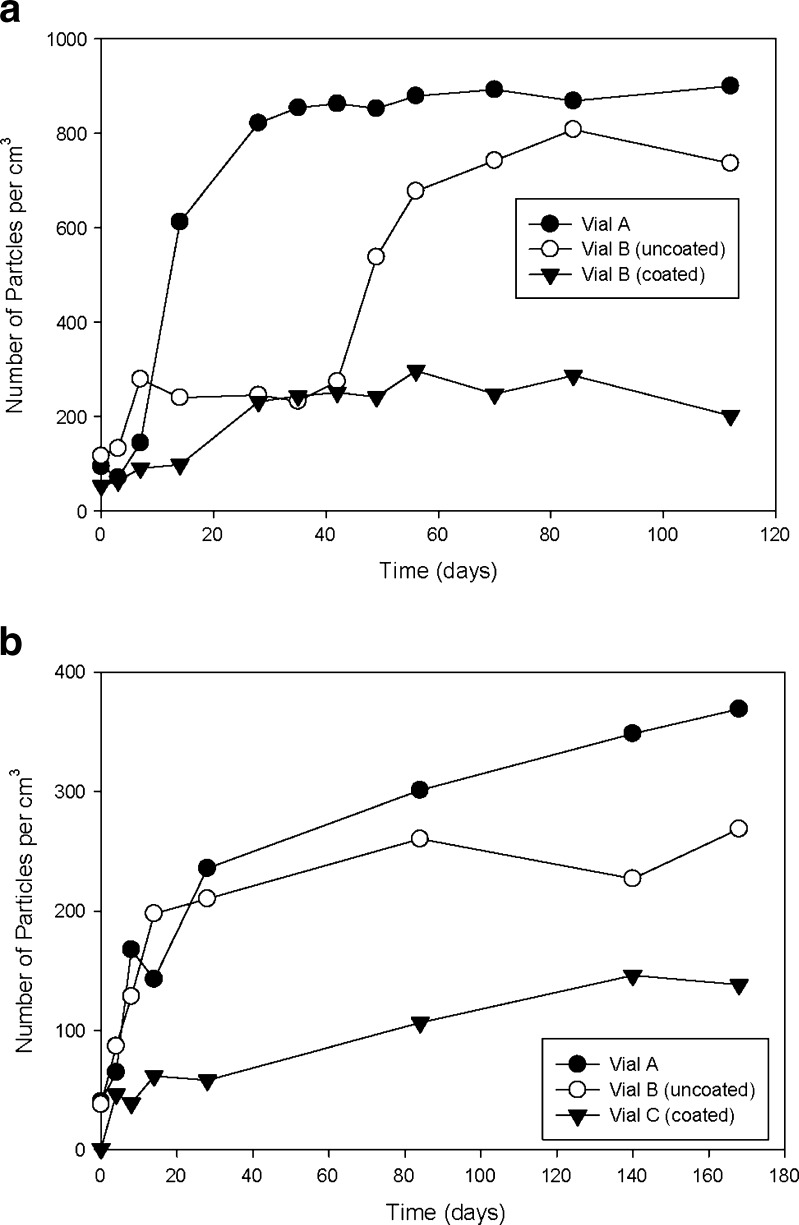
Figure 12 shows a comparison of the three vial types (depyrogenated at 350°C for 4 h, two sterilization cycles) exposed glutaric acid at 40°C and 60°C. Data collected at 40°C show a distinction between the vials. Vendor B coated vials show fewer particles than vendor B uncoated vials, or vendor A vials. At 60°C, vendor B vials (uncoated) show superior resistance to particle generation until 42 days, at which time there is a step function increase in the number of particles. The data then trend in a very similar fashion to vendor A.
Fig. 12.
Plots of particle count vs. time for vials exposed to glutaric acid at 40°C (a) and 40°C (b), respectively. (depyrogenated at 350°C for 4 h, two terminal sterilization cycles)
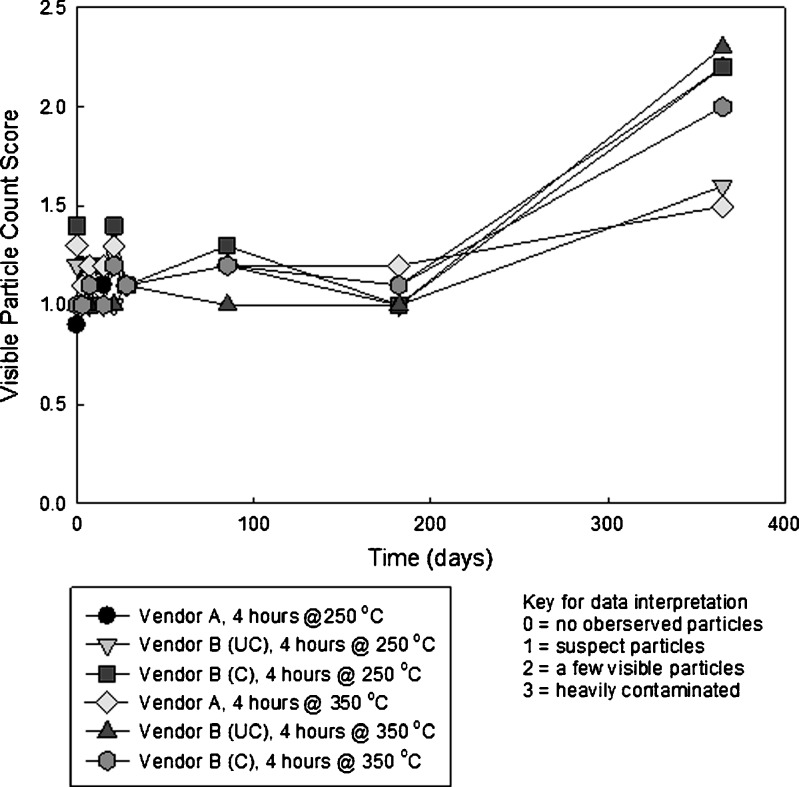
Visual inspection of the solutions in the vials showed a significant increase in the number of visible particles between 180 days and 1 year. Figure 13 shows a plot of these data.
Fig. 13.
Visual inspection data obtained from vials containing glutaric acid stored at 25°C
DISCUSSION
pH Measurements
Often, when a parenteral product changes pH when placed on stability, the assignable cause is the chemical degradation of the molecule. Glutaric acid in solution at 60°C; however, shows no evidence of degradation.
At elevated pH ranges, the dominant degradation mechanism for glass is dissolution of the silicate network. The silicate complex then coverts to silicious acid, which produces the resultant change in pH. Therefore, in this study, the pH drop is due to glass degradation, rather than the degradation of the glutaric acid. White has described the various corrosion mechanisms glass can undergo (21). Iler provides extensive information on the reactions of silicates with water (33).
ICP–OES Analysis of Glutaric Acid Solutions
The data in Figs. 5 and 6 show a clear separation among the three vial types. Vendor A vials release the most silicon into solution, followed by coated vendor B vials, and finally uncoated vendor B vials. As the interior of the coated vendor B vials is exclusively SiO2, these findings are not unexpected. The concentration of silicon does not increase over time for both vials produced by vendor B, indicating that the dissolution of SiO2 occurs during terminal sterilization and does not continue during storage. Such is not the case for vendor A glass, where silica continues to dissolve after the terminal sterilization. For both vendors, there is no observed trend between the amount of silicon that enters solution and the depyrogenation temperature.
Also shown in Figs. 5 and 6 are control data obtained from the literature that show the dissolution of powdered S-glass, which is the glass fiber reinforcement used in fiber glass composites (32). This glass has less chemical durability than type I borosilicate glass; therefore, it serves as a suitable control material for this study. The S-glass was exposed as a powder in water of pH 7, presenting a much higher total surface area than the interior of the vials used in this study.
There is more silica dissolved from the borosilicate glass vials containing glutaric acid stored at 40°C than S-glass powder in water stored at 50°C. This supports the assertion that the molecule is playing an active role in the chemical attack of the glass. The reported equilibrium concentration of silica in water is reproducible for a given material, but data reported by various investigators shows significant variability (33).
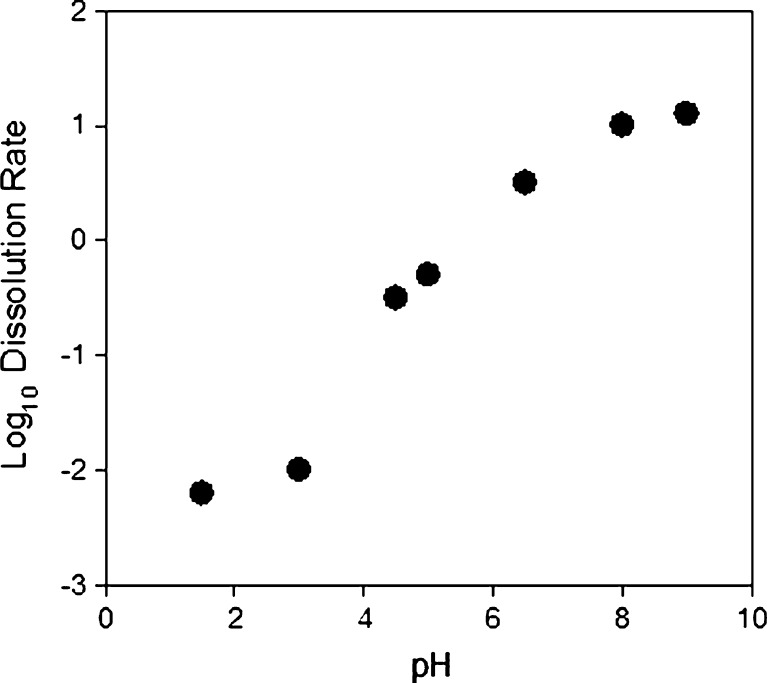
In the pH range of 2–9, the equilibrium concentration ranges from 150 to 150 ppm. At pH 9 and above, several investigators have shown equilibrium concentrations as high as 1,000 ppm (34,35). This apparent increase in solubility is due to a change in the speciation of silica in solution. Figure 14 illustrates that over a pH range of 1.5–9.5, the dissolution rate also increases, in excess of 3 orders of magnitude.
Fig. 14.
Log of dissolution rate vs. pH for silica in water (39)
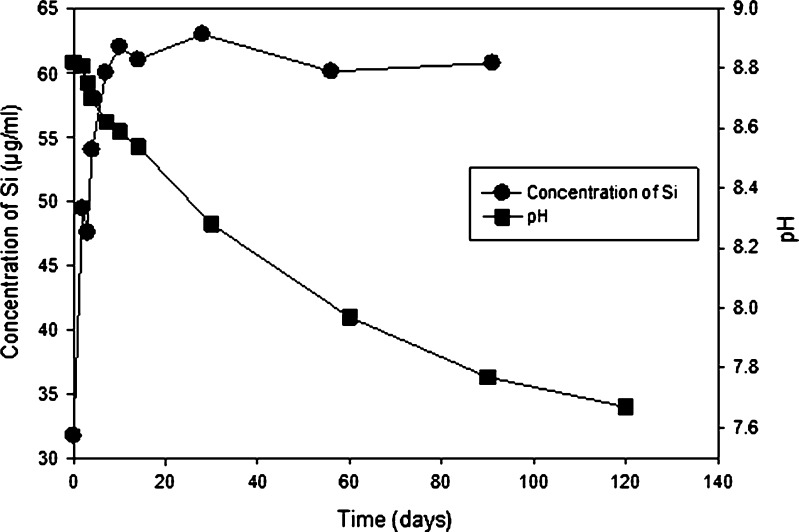
Figure 15 shows a comparison of pH and concentration of silicon in solution as a function of time for this current study. Silicon concentration increases at a much faster rate than the accompanying decrease in pH caused by the generation of silicic acid. This implies that the generation of silicic acid is a multi-step reaction, in which the dissolution of silica is not rate limiting.
Fig. 15.
Plot of pH and concentration of Si for vendor A vials exposed to 350°C for 4 h and receiving two terminal sterilization cycles. Storage temperature was 60°C
Molecular models have been proposed for glass hydrolysis, ion exchange, and dissolution (36,37). First, water must diffuse (as a molecule) into the silicate network. The transport mechanism is controlled by steric constraints imposed by the dimensions of the voids present in the silicate network. If the diffusion path for molecular water in the glass is insufficient due to the presence of glass modifiers such as Na, the network must undergo hydrolysis to convert the SiO2 structure to open rings of silicate tetrahedra. This current study represents a more complicated scenario, as the glutaric acid molecule is playing an active role in the various reactions.
SEM Analysis of Vial Interiors
The images presented in the “RESULTS” section provide direct evidence of chemical attack on the glass. This evidence manifests itself well before visible glass flakes appear in the drug product. By directly examining the glass, the feasibility of parenteral liquid formulation can be assessed in a very short time period (days, rather than months).
D-SIMS Elemental Depth Profiles
The data shown in Fig. 8 demonstrate some unusual changes in surface chemistry when vendor A vials are exposed to glutaric acid at 60°C for 14 days. The surface is enriched with Mg. The concentration profile follows Fickian behavior, but the trend is just the opposite of what one would expect for dissolution of glass. The surface should be deplete of the element if it has gone into solution. The compositional depth profile for sodium is representative of leaching. The depth profile for B follows the same trend (Fig. 9).
The H peak is representative of the diffusion of water into the glass. The peak of the H peak seems to coincide with the enrichment depth for other elements. The enrichment of K, for example, is at approximately at the same depth as the peak for the H depth profile. The surface chemistry is of this vial is very different from a vial that has not been exposed to glutaric acid.
Figure 10 shows two depth scans for uncoated vendor B vials exposed to glutaric acid at 60°C for 14 days. The difference between vials that are exposed and unexposed to glutaric acid is minimal. This glass exhibits much greater chemical stability. There is no surface enrichment of Na or K, as noted with the vendor A material.
The combined data in Figs. 9 and 10 show that the coated vendor B experience little change in surface chemistry due to exposure to glutaric acid.
Because of the differences in manufacturing processes between vendor A and B vials, there is a significant difference in the chemical resistance of these vials. The glutaric acid changes significantly the surface chemistry of the vendor A vials, which greatly aggravates the delamination behavior of the material.
Spextrex Particle Data and Visual Examination of Vials
The data in Fig. 11 offer a great deal of insight into the actual mechanism of delamination. Terminal sterilization has a significant effect on the glass stability. Generation of particles above background levels occurs at day 7. The mean particle size increases to 25 μm in a step function manner, with no further increase over time. This indicates that once formed, the particles do not grow over time. It also indicates that the formation of the flakes is not a solution reprecipitation process, where dissolved silica from the vial interior reprecipitates after a sufficient amount of supersaturation is achieved in solution.
Previously, it was shown that vendor A vials contained two distinct populations of surface defects: one created by phase separation of Na-rich phases (small and close together), and one created by reboil during the glass cane and vial manufacture (larger and further apart; 26). Additionally, it was hypothesized that these defects participated in the delamination process, much in the same way surface pits accelerate corrosion in the pitting corrosion of stainless steel. The Spectrex particle size measurements were completed after 120 days, with no observable increase in particle size. This supports the assertion that the particles are not forming by dissolution and reprecipitation because the particles would increase in size over time. The particles are flaking off the vial interior and do not increase in size over time.
The vials were visually examined by several individuals; hence, the rating is an average score. Because of the variability introduced by differences in human visual acuity, it is not possible to draw quantitative conclusions from the data in Fig. 12; however, qualitative trends are visible. The appearance of significant visible particles requires the most time for any of the techniques that were employed. Other analyses (appearance of sub-visible particles, decrease in pH, and increase in the concentration of silicon) are all leading indicators of delamination. Most likely, mechanical energy in the form of vial contact, shaking, etc. is required for the spalling of these larger flakes. The other tests performed show that glass integrity is compromised well before visible flakes appear.
Effect of the Chemical Species in Solution
Previous work investigated the effect of organic acids (38,39) and other anions (9) in solution on glass durability. Bacon et al. reported that solutions of sodium citrate between the pH range of 5–7.6 attack silicate glasses. Other work has shown that organic acids leach nonsiliceous ions from the glass structure via ion exchange and demonstrate that the acid anion is involved in the leaching process. In a more recent study, Gin et al. reported that various organic acids and acid salts over a pH range of 3–9 caused surface reactions to occur. The mechanism was different at low pH when compared to high pH, but in all cases, glass dissolution did occur.
In these studies, 2a–c were used as the test molecules for glass durability. In each case, at least one carboxylic acid group is present and for 2a,b, there are two carboxylic acid moieties. As well, the final pH of the solution containing these compounds was high (>8). At this high pH range, which is well above the pKa of the test compounds, the species in solution would be anionic in nature. It is acknowledged that the number of chemical moieties investigated in these studies is not comprehensive; however, it was believed that these molecules would cause a rapid deterioration of the glass vials. A decrease of glass durability due to the combination of the anionic nature of the species and the pH of the solution all corroborate other published results in this area.
CONCLUSIONS
The data collected in this study support previously reported results, and provides much greater insight into the delamination process. The chemical durability of glass vials used for the storage of parenteral drug products is greatly affected by the differences in manufacturers, terminal sterilization, and the nature of the chemical moiety contained within the solution. Depyrogenation did not have an effect on the generation of glass flakes. Dissolution of silicon and the appearance of subvisible glass particulates occur well in advance of the appearance of visible glass flakes, and should be considered as leading indicators for the loss of glass chemical durability. The formation of flakes on the vial interior is readily observed by scanning electron microscopy in the same time scale as the appearance of sub visible particles in solution and the increase in silicon content; however, because a breakage event is required for the flakes to spall, significantly more time is required for visible particulates to be observed. From a subvisible particle generation perspective, the presence of a highly chemically resistant coating offers an observable benefit.
Visual observation of glass particulates is not a leading indicator of glass instability with a parenteral liquid, but rather a lagging one. ICP–OES, scanning electron microscopy, changes in pH, early monitoring of particle formation using light scattering techniques, and D-SIMS all provide early indicators of delamination. The stage for delamination is set well before flakes are observed.
Because the vial interior is compromised so early in the shelf life of the product, few options exist for the prevention of delamination. The CVD coating of SiO2 offers some protection against the formation of visible flakes. Materials substitution using plastic vials is also an alternative; however, there are other challenges incurred with such a change. Lyophillization is also a viable alternative. Although the liquid does have contact with the glass prior to processing, the time that the liquid resides in the glass vial is much less than would be encountered with a liquid formulation.
Acknowledgments
The authors would like to recognize the help of Dr. Jean Buckwalter and Ms. Sally Belknap in the preparation of this manuscript.
References
- 1.Roseman TJ, Brown JA, Scothorn WW. Glass for parenteral products: a surface view using the scanning electron microscope. J Pharm Sci. 1976;65(1):22–29. doi: 10.1002/jps.2600650103. [DOI] [PubMed] [Google Scholar]
- 2.Ennis RD, Pritchard R, Nakamura C, Coulon M, Taiyin Y, Visor GC, et al. Glass vials for small volume parenterals: influence of drug and manufacturing processes on glass delamination. Pharm Dev Technol. 2001;6(3):393–405. doi: 10.1081/PDT-100002248. [DOI] [PubMed] [Google Scholar]
- 3.Dimbley B. Glass for pharmaceutical purposes. J Pharm Pharmacol. 1953;5:969–989. doi: 10.1111/j.2042-7158.1953.tb14064.x. [DOI] [PubMed] [Google Scholar]
- 4.Adams PB. Surface properties of glass containers for parenteral solutions. Bull Parenter Drug Assoc. 1977;31(5):213–225. [PubMed] [Google Scholar]
- 5.Abernethy S, Dowd N, Bochert S, Butler DA, Clayton R, Eckhart C, et al. Glass: isolation and identificaiton of extractables from usp grade glass. J Parenter Sci Technol. 1986;40(supplement):S3–S11. [Google Scholar]
- 6.Hinson AL. Flouride washing of glass containers. Bull Parenter Drug Assoc. 1971;25(6):266–269. [PubMed] [Google Scholar]
- 7.Yamanaka Y, Akagi J, Hattori M. Reaction of pyrex type borosilicate glass with water in autoclave. J Non-Cryst Solids. 1985;70:279–290. doi: 10.1016/0022-3093(85)90327-8. [DOI] [Google Scholar]
- 8.Brown JB, Watts AS. Some studies on reactions between glasses and phosphate solution. J Am Ceram Soc. 1937;20:245–250. doi: 10.1111/j.1151-2916.1937.tb19897.x. [DOI] [Google Scholar]
- 9.Bacon FR, Raggon FC. Promotion of attack on glass and silica by citrate and other anions in neutral solution. J Am Ceram Soc. 1959;42(4):199–205. doi: 10.1111/j.1151-2916.1959.tb12947.x. [DOI] [Google Scholar]
- 10.Tian L, Dieckmann R, Hui C-Y, Lin Y-Y. Effect of water incorporation on the diffusion of sodium in type I silica glass. J Non-Cryst Solids. 2001;286:146–161. doi: 10.1016/S0022-3093(01)00520-8. [DOI] [Google Scholar]
- 11.Doremus RH. Diffusion of water in rhyolite glass: diffusion-reaction model. J Non-Cryst Solids. 2000;261:101–107. doi: 10.1016/S0022-3093(99)00604-3. [DOI] [Google Scholar]
- 12.Tomozawa M. Water in glass. J Non-Cryst Solids. 1985;73:197–204. doi: 10.1016/0022-3093(85)90346-1. [DOI] [Google Scholar]
- 13.Doremus RH. Chemical durability of glass. Treatise on materials science and technology. New York: Academic; 1979. pp. 41–69. [Google Scholar]
- 14.Doremus RH. Diffusion of water in glass. J Mater Res. 1995;10(9):2379–2389. doi: 10.1557/JMR.1995.2379. [DOI] [Google Scholar]
- 15.Agarwal A, Tomozawa M, Lanford WA. Effect of stress on water diffusion in silica glass at various temperatures. J Non-Cryst Solids. 1994;167:139–148. doi: 10.1016/0022-3093(94)90378-6. [DOI] [Google Scholar]
- 16.Nogami M, Tomozawa M. Effect of stress on water diffusion in silica glass. J Am Ceram Soc. 1984;67(2):151–154. doi: 10.1111/j.1151-2916.1984.tb09634.x. [DOI] [Google Scholar]
- 17.Wakabayashi H, Tomozawa M. Diffusion of water into silica at low temperature. J Am Ceram Soc. 1989;72(10):1850–1855. doi: 10.1111/j.1151-2916.1989.tb05990.x. [DOI] [Google Scholar]
- 18.Tomozawa M. Stress corrosion reaction of silica glass and water. Phys Chem Glasses. 1998;39(2):65–69. [Google Scholar]
- 19.Tomozawa H, Tomozawa M. Diffusion of water into a borosilicate glass. J Non-Cryst Solids. 1989;109:311–317. doi: 10.1016/0022-3093(89)90044-6. [DOI] [Google Scholar]
- 20.Smets BMJ, Lommen MG. The role of molecular water in the leaching of glass. Phys Chem Glasses. 1982;24(1):35–36. [Google Scholar]
- 21.White WB. Theory of corrosion of glass and ceramics. In: Clark DE, Zoitos BK, editors. Corrosion of glass, ceramics and ceramic superconductors: principles, testing, characterization, and applications. Park Ridge: Noyes Publications; 1992. pp. 2–28. [Google Scholar]
- 22.Baer DR, Pederson LR, McVay GL. Glass reactivity in aqueous solutions. J Vac Sci Technol. 1984;A2:738–743. [Google Scholar]
- 23.Gy R. Stress corrosion of silicate glass: a review. J Non-Cryst Solids. 2003;316:1–11. doi: 10.1016/S0022-3093(02)01931-2. [DOI] [Google Scholar]
- 24.Chene J, Trocellier P. Investigation of alkali borosilicate glass durability using tritium tracing, beta-autoradiography, scanning electron microscopy, and ion beam analysis. J Non-Cryst Solids. 2004;337:86–96. doi: 10.1016/j.jnoncrysol.2004.02.094. [DOI] [Google Scholar]
- 25.Hair ML, Chapman ID. Surface composition of porous glass. J Am Ceram Soc. 1966;49(12):651–654. doi: 10.1111/j.1151-2916.1966.tb13193.x. [DOI] [Google Scholar]
- 26.Iacocca RG, Allgeier MA. Corrosive attack of glass by a pharmaceutical compound. J Mater Sci. 2007;42(3):801–811. doi: 10.1007/s10853-006-0156-y. [DOI] [Google Scholar]
- 27.Borchert SJ, Ryan MM. Accelerated extractable studies of borosilicate containers. J Parenter Sci Technol. 1989;43(2):67–79. [PubMed] [Google Scholar]
- 28.Branda F, Laudisio G, Constantini A, Piccioli C. Weathering of a roman glass: a new hypothesis for pit formation on glass surfaces. Glass Technol. 1999;40(3):89–91. [Google Scholar]
- 29.Gillies KJS, Cox A. Decay of medieval stained glass at york, canterbury, and carlisle: Part 2. Relationship between the composition of the glass, its durability and the weathering products. Glastech Ber. 1988;61(4):101–107. [Google Scholar]
- 30.Rogers P, McPhail D, Ryan J. A quantitative study of decay processes of venetian glass in a museum environment. Glass Technol. 1993;34(2):67–68. [Google Scholar]
- 31.Schreiner M. Deterioration of stained medieval glass by atmospheric attack. Glastech Ber. 1988;61(7):197–204. [Google Scholar]
- 32.Hsu AT, Jemian WA, Wilcox RC. Solvent effect of water on S-glass. J Mater Sci. 1976;11:2099–2104. doi: 10.1007/BF02403360. [DOI] [Google Scholar]
- 33.Iler RK. The chemistry of silica. New York: Wiley-Interscience; 1979. [Google Scholar]
- 34.Baumann H. Solubility of silica in water. Beitr Silikose-Forsch. 1955;37:47. [Google Scholar]
- 35.Cherkinskii YS, Knyaz ' kova IS. Dokl Akad Nauk SSSR. 1971;198:358.
- 36.Bunker BC. Molecular mechanisms for corrosion of silica and silicate glasses. J Non-Cryst Solids. 1994;179(pt 3):300–308. doi: 10.1016/0022-3093(94)90708-0. [DOI] [Google Scholar]
- 37.Batyrev IG, Tuttle B, Fleetwood DM, Schrimpf RD, Tsetseris L, Pantelides ST. Reactions of water molecules in silica-based network glasses. Phys Rev Lett. 2008.100(10):105503:1–8. [DOI] [PubMed]
- 38.Gin S, Gordon N, Mestre JP, Vernaz EY, Beaufort D. Espericamental investigation of aqueous corrosion of R7T7 nuclear glass at 90°C in the presence of organic species. Appl Geochem. 1994;9(3):255–269. doi: 10.1016/0883-2927(94)90036-1. [DOI] [Google Scholar]
- 39.Ramachandran BE, Balasubramanian N, Rao GV, Aravamudan G. Effect of organic acids on e-glass fabric. J Am Ceram Soc. 1981;64(9):C122–C124. doi: 10.1111/j.1151-2916.1981.tb10332.x. [DOI] [Google Scholar]


