


Abstract
Effective transcript profiling in animal systems requires isolation of homogenous tissue or cells followed by faithful mRNA amplification. Linear amplification based on cDNA synthesis and in vitro transcription is reported to maintain representation of mRNA levels, however, quantitative data demonstrating this as well as a description of inherent limitations is lacking. We show that published protocols produce a template-independent product in addition to amplifying real target mRNA thus reducing the specific activity of the final product. We describe a modified amplification protocol that minimizes the generation of template-independent product and can therefore generate the desired microgram quantities of message-derived material from 100 ng of total RNA. Application of a second, nested round of cDNA synthesis and in vitro transcription reduces the required starting material to 2 ng of total RNA. Quantitative analysis of these products on Caenorhabditis elegans Affymetrix GeneChips shows that this amplification does not reduce overall sensitivity and has only minor effects on fidelity.
INTRODUCTION
Many of the most fruitful applications of functional genomics to date have been in the study of homogenous cultured cells (1–7). The diversity of cell types in animals makes the application of transcript profiling to animal systems non-trivial and limited to abundant messages. To detect rare messages and to simplify the analysis of complex expression patterns, isolation of or enrichment for the cell types of interest is essential. Developmental staging, dissection (including biopsies and laser capture), cell sorting (8) and genetic techniques can be used to reduce the complexity of cell types from which RNA is isolated. However, with such techniques it is often difficult to obtain the microgram quantities of mRNA required for existing transcript profiling technologies. A technique capable of amplifying small amounts of mRNA without significantly distorting the information content of the sample is therefore needed, though one has not been described in detail (9,10).
Theoretical considerations suggest that faithful amplification of a complex template can best be achieved by an isothermal reaction with linear kinetics. Any enzymatic reaction will have its biases, but it is possible to control for minor systematic, sequence-dependent biases. In contrast, stochastic and copy number-dependent biases are unacceptable. Although the geometric kinetics of chain reactions are attractive, sequence-dependent biases will also be amplified geometrically. In addition, hybridization kinetics during thermal cycling can cause both sequence-dependent and copy number-dependent biases (11,12). In contrast, biases in an asymmetric isothermal reaction should be limited to modest sequence-dependent effects, which will be constant between samples and independent of copy number, thus allowing reliable and quantitative detection of differences between samples. It would of course be optimal if the biases, though systematic, were minimal so that measurements of absolute abundance would be meaningful as well as comparisons between samples generated with and without amplification.
mRNA amplification by in vitro transcription of cDNA, based on a protocol first described by Eberwine and colleagues (13), has been shown to faithfully maintain relative mRNA levels when starting with 1 µg of poly(A)+ or 10 µg of total RNA (14,15), and has become the standard labeling protocol for the Affymetrix GeneChip technology. Application of additional rounds of amplification from much smaller amounts of RNA have been shown to give reproducible results for a single RNA sample (16), and to allow detection of differences between samples consistent with those detected without amplification (17).
A number of aspects of the cDNA synthesis in vitro transcription protocol remain unclear. Although theoretically there should be no lower RNA limit to the amplification, fidelity appeared to drop off with less starting RNA (our observations; E.Wang, National Institutes of Health, Bethesda, MD, personal communication). In addition, with the exception of very modest amounts of amplification (14), the differences in a sample before and after amplification have not been shown. There is also no quantitative basis to determine the statistical significance of differences detected between samples after amplification.
To investigate these concerns and to provide the quantitative data analysis required to interpret expression data generated from amplified mRNA, we have analyzed in vitro transcription amplification products. Our initial analysis indicated that the existing protocols (16–18) are severely limited by unintended and undescribed template-independent side reactions. We identified the source of the side product and developed optimized reaction conditions that minimize the production of the undesired template-independent products. We then quantitatively analyzed the sensitivity and representation of the optimized reactions using Caenorhabditis elegans Affymetrix GeneChips. Our analysis indicates that the optimized reactions can faithfully amplify 2 ng of total RNA. In combination with techniques that limit cell type diversity, this method will allow effective transcriptional profiling and informative data analysis in animal systems.
MATERIALS AND METHODS
Methods for total RNA isolation, the standard protocol for 10 µg amplifications, chip design, hybridization and data reduction (including conversion of average differences to relative frequencies) are described elsewhere (18), but are also briefly described below. Many variations in the amplification protocols used for each amount of starting material reflect progressive development of the protocol, and additional changes in the working protocol have been made since the generation of the data set reported here. For a thorough and current version of the protocol including a compatible micro-scale RNA isolation procedure and sources of reagents used in this work that may not otherwise be readily available please see http://www.mcb.harvard.edu/hunter.
Total RNA was isolated 0 and 48 h after hypochlorite treatment of a mixed-stage population of wild-type C.elegans (18) by the method of Chomczynski and Sacchi (19). The standard protocol for 10 µg amplifications employed a 20 µl reverse transcription (RT) reaction with 200 U SuperScript II (Life Technologies) and 0.5 µg (dT)-T7 primer1 [5′-GGCCAGTGAATTGTAATACGACTCACTATAGGGAGGCGG(T)24] in 1× first-strand buffer (Life Technologies) with a 50°C incubation. Second-strand synthesis (SSS) was carried out in 150 µl with 40 U DNA polymerase I, 2 U Escherichia coli RNase H, and 10 U E.coli DNA ligase in 1× second-strand buffer (Life Technologies) simply by adding 130 µl of an ice-cold SSS premix to the heat inactivated, ice-cold 20 µl RT reaction and incubating at 15°C for 2 h (20). The double-stranded (ds) cDNA was polished by adding 20 U T4 DNA polymerase and incubating for 5 min at 15°C. cDNA was purified on paramagnetic beads (Perseptives) (21) and was transcribed in 60 µl [37°C, 16 h, 5000 U T7 RNA polymerase (Epicentre Technologies), 3.0 mM GTP, 1.5 mM ATP, 1.2 mM UTP, 1.2 mM CTP, 0.4 mM bio-11-UTP, 0.4 mM bio-11-CTP (Enzo Laboratories), MegaScript 1× buffer (Ambion)]. Amplified antisense RNA (aRNA) was purified on paramagnetic beads (Bangs Laboratories).
For all other amplifications, cDNA synthesis volumes were different from those of the standard protocol above but reaction component concentrations, incubation times and temperatures were conserved except where noted. (dT)-T7 primer2 [GCATTAGCGGCCGCGAAATTAATACGACTCACTATAGGGAGA(T)21V] was used; ds cDNA was polished with T4 DNA polymerase for 15 rather than 5 min and was purified by phenol–chloroform extraction followed by chromatography on a BioGel p-6 column [Bio-Rad; microcon-100s, PCR columns (Qiagen), dialysis and paramagnetic beads gave poor recovery of small amounts of cDNA] and precipitated with 20 µg glycogen; transcription reactions were either 40 µl [42°C, 9 h, 160 U T7 RNA polymerase (Promega), 3.0 mM GTP, 1.5 mM ATP, 1.2 mM UTP, 1.2 mM CTP, 0.4 mM bio-11-UTP, 0.4 mM bio-11-CTP, 1× Ampliscribe buffer (Epicentre)] or 20 µl [42°C, 9 h, 80 U T7 RNA polymerase (Promega), 7.5 mM NTP, 1× Ampliscribe buffer (Epicentre); for the first round of two round experiments]; and aRNA was purified in three washes on a microcon-100 (Millipore) both at the end and between rounds.
For the 200 ng amplifications, RT was in 10 µl with 0.1 µg (dT)-T7 primer2 and incubation for 60 min at 42°C. For the first round of the 10 and 2 ng amplifications, RT was in 1 µl with 10 ng (dT)-T7 primer2, ∼0.2 µg T4gp32, and incubation for 40 min at 42°C, 10 min at 50°C and 10 min at 55°C. RT reactions (1 µl) were carried out by carefully drying the RNA and primer down to 500 nl in a 0.6 ml Eppendorf tube under vacuum using water controls and drops of known volume as gauges. The reactions were primed by heating the tube to 70°C for 4 min in a thermal cycler with a heated lid and snap cooling on ice. Chilled RT premix (500 nl) plus 100 nl extra water (to make up for evaporation, 600 nl total) was then added to the drop at the bottom of the tube and incubation was proceeded with as usual. It is worth noting that at the time of publication we are routinely using a 2 µl RT reaction since it is significantly easier to set up than a 1 µl reaction. For the second round of amplification, RT was in 10 µl with 0.5 µg random hexamers, ∼2.0 µg T4gp32 and incubation for 20 min at 37°C, 20 min at 42°C, 10 min at 50°C and 10 min at 55°C. For SSS in the second round 1 U RNase H was first added to the heat-inactivated 10 µl RT reaction followed by incubation at 37°C for 30 min, denaturation at 95°C for 2 min and snap cooling on ice. 0.1 µg (dT)-T7 primer2 was then added to the chilled cDNA and the SSS reaction was primed by incubation for 10 min at 42°C followed by snap cooling on ice. Sixty-five microliters ice-cold SSS premix (same as in round 1 except minus ligase) was then added and incubation and polishing were carried out as in round 1.
aRNA was quantified either by absorbance at 260 nm or by fluorescence using Ribogreen dye (Molecular Probes) and a 12 µl quartz cuvette (Hellma). Typical mass conversions for the standard protocol starting with 10 µg total RNA and yielding aRNA were 2–4-fold, for the optimized protocol starting with 50–500 ng were 10–20-fold and with 2–10 ng were 5–10-fold for the first round and 200–400-fold for the second round for a total of 30 000–120 000-fold amplification total with two rounds [assuming 3.3% poly(A)+ RNA].
1–2 µg labeled aRNA was used in each hybridization; hybridization and staining were done as described in the Affymetrix Expression Analysis Technical Manual. Array images were reduced to intensity values, average differences and present/absent/marginal calls using the Affymetrix GeneChip software. Average differences were converted to relative frequencies (reported as whole numbers) by a linear fit to a standard curve, derived for each hybridization from the average difference values of 11 bacterial in vitro transcripts spiked into each hybridization at known relative frequencies ranging from 3 to 1000 parts per million (p.p.m.) (14,18). Because the conversion of average differences to relative frequencies is a linear transformation of the data, it is irrelevant to the statistical analysis presented here. Sensitivity of detection for each hybridization was defined as the relative frequency at which there was a 70% likelihood of a transcript being called present, based on a logistic regression of the present/absent calls for the spike-in transcripts as a function of frequency. Sensitivity was 3–4 p.p.m., depending on the hybridization, and there were between 3 and 4000 present calls for each hybridization, out of 6617 predicted C.elegans genes represented on the chip.
Because the coefficient of variation is roughly constant with respect to frequency (data not shown), we used a log transformation of the frequencies to stabilize variance (22). This transformation allows the variance per gene to be pooled across all genes. Thus, t scores = (Xi,48h–Xi,0h)/√[(s20h/n0h)+(s248h/n48h)] where X = mean across replicates of log10 transformed frequencies for a single gene, i, in either the 0 or 48 h RNA sample; s2 = variance in replicates of log10 transformed frequencies for a single gene, averaged across all genes; and n = number of replicates.
RESULTS
We have characterized linear amplification protocols based on T7 RNA polymerase transcription of cDNA. We followed mass conversion by solution-based fluorometry and quantitative fluorescence following gel electrophoresis, molecular weight by native and denaturing gel electrophoresis and representation by hybridization to C.elegans Affymetrix GeneChips. Using existing protocols (17,23), we found that diluted cDNA template performed better than template generated from small-scale cDNA reactions and that the quality of the amplified product, measured by the mean average difference (i.e. mean signal intensity minus background) after GeneChip hybridization, dropped precipitously as <10–20 ng of total RNA was used as starting material (data not shown). We also found that amplified products in general did not perform as well as poly(A)+ RNA in cDNA microarray hybridizations (data not shown). In addition, when amplifying small amounts of RNA the molecular weight of the product was significantly higher than expected (Fig. 1) (24,25; E.Wang, personal communication).
Figure 1.
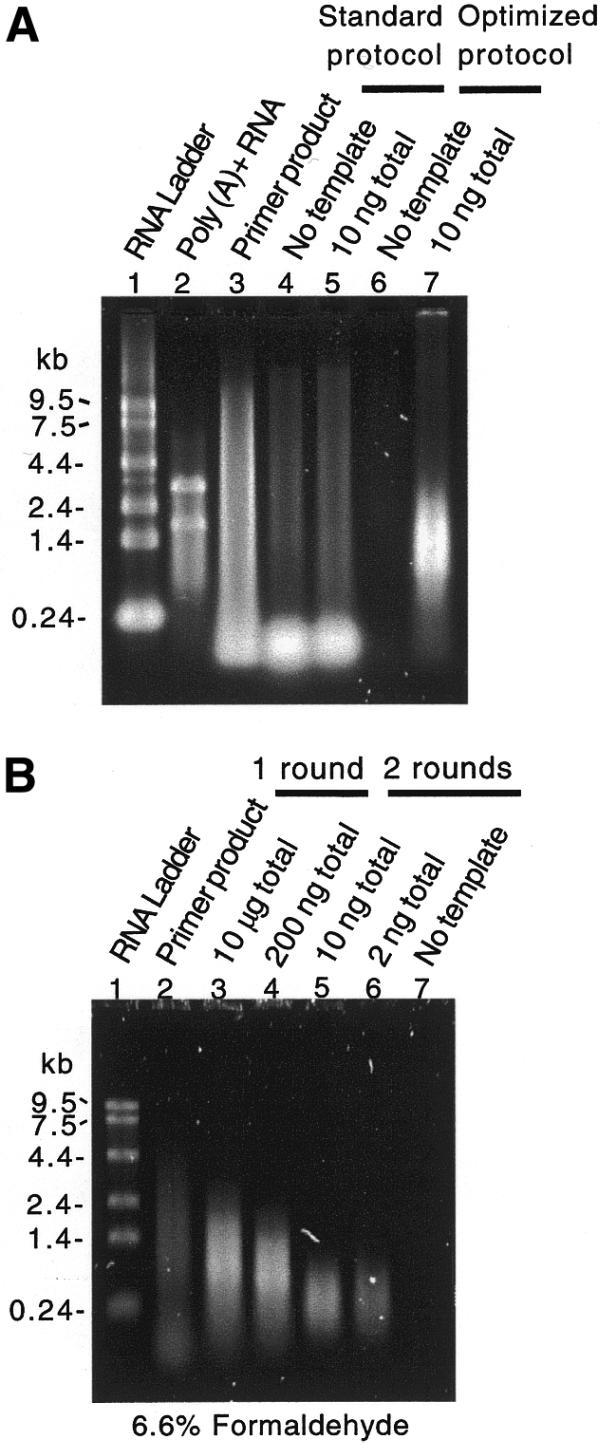
Minimizing primer concentration and RT reaction volume reduces the production of template-independent in vitro transcription product. Products from control, standard and optimized in vitro transcription amplification reactions resolved by (A) native and (B) denaturing agarose gel electrophoresis and stained with SYBR Gold. (A) Lane 1, 50 ng RNA ladder; lane 2, 100 ng poly(A) RNA; lane 3, 5% in vitro transcription reaction containing no template but 500 ng of (dT)-T7 primer; lane 4, 10% no template control standard amplification reaction using 500 ng primer; lane 5, 10% standard amplification reaction using 10 ng total RNA and 500 ng primer; lane 6, 100% no template control optimized amplification reaction using 10 ng primer; lane 7, 100% optimized amplification reaction using 10 ng total RNA and 10 ng primer. Note the lack of template-independent product in lane 6 and the appropriate mobility of the amplification products in lane 7 as compared to lanes 4 and 5. (B) Lane 1, RNA ladder; lane 2, identical reaction product in (A) lane 3; lanes 3 and 4, product of single round of amplification from 10 µg and 200 ng total RNA; lanes 5, 6 and 7, products from two rounds of amplification from 10, 2 and 0 ng total RNA. An equal fraction of each product was loaded in lanes 6 and 7.
We first investigated the source of the high molecular weight product (Fig. 1). Surprisingly, this product was not dependent on the presence of template cDNA. That is, T7 RNA polymerase in the presence of oligo-(dT) efficiently synthesized high molecular weight product in an in vitro transcription reaction. Further investigation showed that this primer-dependent reaction occurred with both T7 and T3 RNA polymerases, did not require excessively high enzyme or nucleotide concentrations, showed accelerated kinetics in the absence of CTP and GTP, was not eliminated by HPLC purification of the primer and was not inhibited by heteropolymeric sequences flanking the dT primer sequence (data not shown).
Our analysis of existing amplification protocols (16,17,23) showed that unincorporated oligo-(dT)-T7 primer from the RT reaction is carried over into the in vitro transcription reaction. Because the amount of primer-dependent product is roughly constant, the ratio of template-dependent product to primer-dependent product drops as less starting RNA is used (data not shown). Published protocols specify 0.5–1.0 µg primer (16,17,23). To reduce the amount of primer present in the transcription reaction, we limited both the concentration of primer and the volumes used in cDNA synthesis. These steps minimized the effects of the primer-dependent reaction as assayed by electrophoresis (Fig. 1). In addition, in a comparison of products amplified from 10 ng total RNA with either 10 or 100 ng primer in the first round, we observed a 60% greater mean average difference after GeneChip hybridization with less primer (n = 2 for each), suggesting that the template-independent product reduces the specific activity of the amplified product. This difference in specific activity is significant given the fact that in this same experiment the average number of present calls was 322 with 100 ng and 3495 with 10 ng of primer. Hybridization of the template-independent product from a no template control amplification resulted in a ‘blank’ array by visual inspection of the image file (data not shown).
The reduction of the high molecular weight, primer-dependent product showed that the molecular weight of the template-dependent product after two rounds of amplification was limited by random priming of the second round of cDNA synthesis (Fig. 1). The loss of molecular weight is expected to be restricted to the 5′ end of messages. To assess the representation of 5′ complexity we monitored the amplification of four in vitro synthesized bacterial transcripts that were spiked into all amplification reactions. These four genes were tiled three times, once each for the 5′, middle (M) and 3′ region of each gene, on the GeneChips used in these experiments. The products of amplification from 10 µg of total RNA show very good 5′/3′ and M/3′ ratios (0.89 and 0.91, respectively), but products of amplification from 200 ng total RNA have lower 5′/3′ and M/3′ ratios (0.42 and 0.31, respectively). There is a further drop in 5′/3′ and M/3′ ratios in products of nested amplifications from 10 ng total RNA (0.19 and 0.08, respectively) and 2 ng total RNA (0.21 and 0.19, respectively). The loss in 5′ complexity was anticipated in the design of the C.elegans Affymetrix GeneChips by restricting oligonucleotide tiling to the 600 3′ coding nucleotides of each predicted gene.
Development of highly processive RT reactions and/or the introduction of cDNA synthesis conditions that do not rely on oligo-dT primers will better preserve 5′ complexity. Towards the first goal, we have found that inclusion of a single-stranded nucleic acid-binding protein significantly increased the processivity of reverse transcription (Fig. 2). This single-stranded binding protein has also been shown to enhance PCR amplification of difficult templates (26). In addition, retro-viral capsid proteins have been shown to bind single-stranded RNA and to increase processivity of reverse transcription in vitro (27).
Figure 2.

Single-stranded nucleic acid-binding protein enhances processivity of RT. Alkaline gel electrophoresis of cDNA product from RT reactions containing increasing amounts of T4gp32 single-stranded binding protein. Lane 1, no T4gp32; lane 2, 14 µg/ml T4gp32; lane 3, 200 µg/ml T4gp32. Note the reduction in the inter-band smear and secondary bands in lanes 2 and 3.
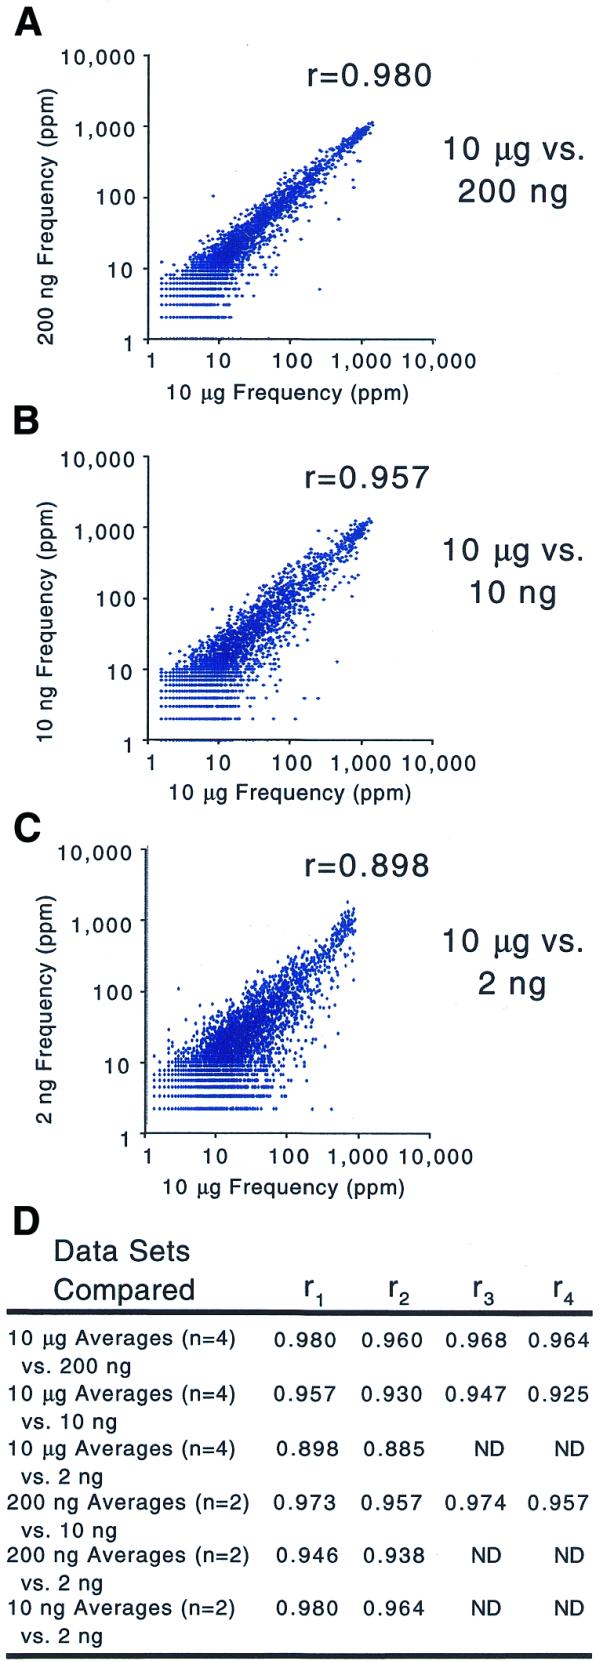
To quantify the reproducibility of the amplification reactions we compared transcript abundance profiles from replicate hybridizations and replicate amplifications. As a measure of GeneChip and hybridization reproducibility a single amplification product was hybridized in replicate and the correlation coefficient of the measured frequencies was calculated [r mean = 0.991 (n = 4)]. This value is similar to that obtained from replicate amplifications from either 10.0 µg total RNA [r mean = 0.990 (n = 4)] or 200 ng total RNA [r mean = 0.992 (n = 2)] (Fig. 3). Thus a single round of amplification does not introduce significant stochastic bias. Although, as indicated by the correlation coefficients of replicate double-amplifications from 10 ng total RNA [r mean = 0.986 (n = 2)] and 2 ng total RNA (r = 0.984) (Fig. 3), an additional round of amplification did have a modest effect on reproducibility. However, these high values suggest that any introduced biases are highly reproducible.
Figure 3.

Scatter plots of gene frequencies from replicate hybridizations and replicate amplification reactions. (A) Scatter plot showing the reproducibility of the Affymetrix GeneChip platform: a single amplification product from 10 µg total RNA was hybridized to multiple chips. (B–E) Scatter plots showing the reproducibility of amplification: gene frequencies from replicate amplification reactions using decreasing amounts of starting total RNA. (B) 10 µg, (C) 200 ng, (D) 10 ng and (F) 2 ng. (E) The complete set of correlation coefficients for all replicates performed.
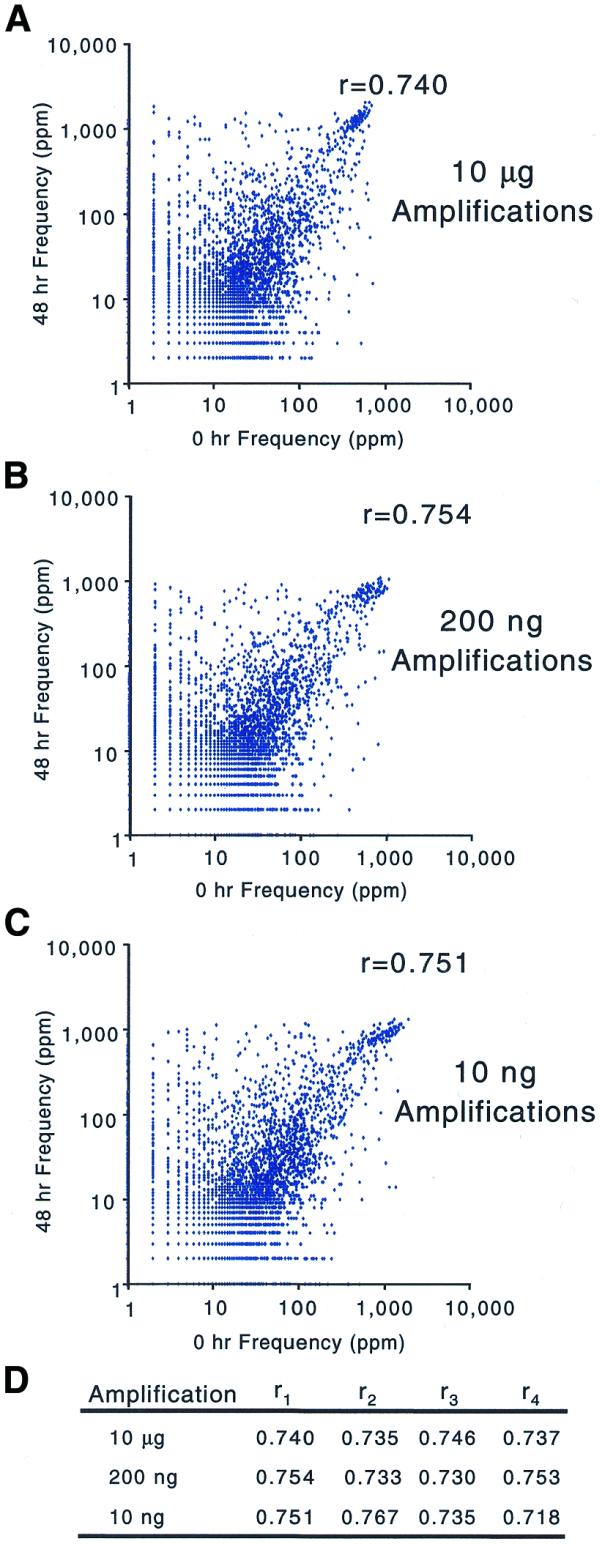
To measure the biases introduced by different amounts of amplification we calculated the correlation coefficient between profiles of a single RNA sample serially diluted and amplified to microgram quantities. The correlation coefficients between frequencies measured after amplification from 10 µg total RNA and 200 ng total RNA [r mean = 0.968 (n = 4); Fig. 4] were not as high as those between replicate amplifications from either 10 µg total RNA [r mean = 0.990 (n = 4)] or 200 ng total RNA [r mean = 0.992 (n = 2); Fig. 3]. The effect of amplification was more severe when comparing products from 10 µg to 10 ng total RNA [r mean = 0.940 (n = 4)] or 2 ng total RNA [r mean = 0.892 (n = 2); Fig. 4]. Although it is clear that bias increases with more amplification, by comparing only a single RNA sample we cannot rule out the possibility that the reproducible nature of the introduced biases is copy number dependent.
Figure 4.
Scatter plots of gene frequencies comparing increasing amounts of amplification. The scatter plots compare the average gene frequency from four independent amplification/labeling reactions using 10 µg total RNA to the gene frequencies from amplification of the same total RNA diluted to (A) 200 ng, (B) 10 ng and (C) 2 ng. (D) The complete set of correlation coefficients including additional comparisons.
To verify that the biases introduced by amplification were sequence and not copy number dependent, we compared the profiles of RNA samples from two different developmental stages of C.elegans (18) and quantified the dissimilarity between them. The correlation coefficients of frequencies measured for each RNA sample show that the two samples are just as dissimilar after being amplified from 200 ng total RNA [r mean = 0.743 (n = 4)] as when amplified from 10 µg total RNA [r mean = 0.738 (n = 4)]. The two samples maintain the same degree of dissimilarity even after amplification from 10 ng total RNA [r mean = 0.743 (n = 4); Fig. 5]. In addition, the range and distribution of frequencies measured after amplification from 200, 10 and 2 ng total RNA are indistinguishable from those measured after amplification from 10 µg total RNA (Fig. 4 and data not shown). The conservation of dissimilarity between RNA samples and the similarity of frequency distributions within a sample suggest that amplification does not introduce copy number dependent biases.
Figure 5.
Scatter plots of gene frequencies for diverse RNA samples. The scatter plots compare the gene frequencies of embryonic versus adult RNA after amplification from different starting amounts of total RNA: (A) 10 µg, (B) 200 ng and (C) 10 ng total RNA. (D) The complete set of correlation coefficients.
To demonstrate the systematic nature of the sequence-dependent biases introduced by amplification, replicates were used to calculate gene-specific t scores for the observed difference in mean frequency between the two different RNA samples. It is worth noting that the t scores computed here (see Materials and Methods) are linearly related to the log of ratios between mean frequencies for the replicate RNA samples. As a result, the scatter plots of t scores (Fig. 6) are qualitatively equivalent to ratios plotted on a log scale. However, it is implicit in the calculation of t scores that replicates are used and statistical significance is considered. Sufficient replicates were done for the 10 µg amplifications so that two separate sets of control t scores could be calculated for the standard protocol. In a comparison between the two sets of 10 µg control t scores, we see a high correlation coefficient (r = 0.948; Fig. 6). The correlation coefficients of t scores drop when comparing 10 µg amplifications to 200 ng amplifications (r = 0.909) or 10 ng amplifications (r = 0.908). The overlap between lists of genes whose frequencies differ most significantly between the two RNAs is as good between the 10 µg and 200 ng data sets as it is between the 10 µg control t scores. However, the overlap between the lists is not as extensive with the 10 ng data set (Fig. 6). Nevertheless, the 10 and 200 ng data sets recapture both the trends and salient features of the 10 µg data set very well.
Figure 6.

Scatter plots of t scores for the differences in observed gene frequency between two diverse RNA samples with and without amplification. t scores were calculated from the data shown in Figure 5. (A) Control t scores from separate pairs of amplification reactions using 10 µg starting total RNA (n = 2). Comparison of t scores derived from 10 µg data (n = 4) and data from amplification from (B) 200 ng (n = 2) and (C) 10 ng (n = 2) total RNA. (D) Overlap between lists of the most significantly different gene frequencies in each data set (highest absolute t scores). *In the intersection between 10 µg and 10 ng data sets, nine genes from each top 20 list do not intersect, but the most discrepant of those 18 genes is found in the top 80 of the other data set.
As an independent confirmation that both the amplification and the assay are linear, we included in the total RNA prior to dilution and amplification in vitro synthesized bacterial transcripts at known relative copy numbers. These spike-ins are separate from those included at hybridization that are used to derive relative frequencies from average differences. The transcripts were spiked into the 48 h total RNA at five times the relative copy number that they were spiked into the 0 h total RNA, allowing the observed ratio of frequencies between the two samples to be compared to the expected value of 5. Only those spike-ins where at least one of each duplicate was called present were used for this analysis to ensure that the signals being compared were near the reported linear range of the GeneChip. For the single round amplification from 200 ng total RNA, the average ratio of means of duplicates spiked-in at 5× and 1× was 4.2 ± 2.1 (n = 3), and for the double round amplification from 10 ng total RNA, the average ratio of means of duplicates spiked-in at 5× and 1× was 4.9 ± 1.4 (n = 3). The three different transcripts used for this analysis were spiked-in at three different relative copy numbers (1× = 20, 82 and 333 p.p.m.). Independent of the rest of the data presented in this work and in confirmation of Lockhart et al. (14), though starting with orders of magnitude less RNA, these data show that for at least a handful of genes both the amplification and the assay are linear.
DISCUSSION
T7 RNA polymerase can catalyze reactions other than the desired DNA-dependent synthesis of RNA. We have shown that an in vitro transcription reaction containing an oligo-(dT) primer will produce a high molecular weight RNA and that this side reaction compromises the specific activity of the amplified product (Fig. 1). In addition, excessively high concentrations of T7 RNA polymerase in the presence of biotinylated nucleotides can produce a template and primer-independent high molecular weight product. Even the apparent template-dependent product synthesized with such high concentrations of enzyme was of a higher than expected molecular weight and of questionable integrity (data not shown). Interestingly, various ribosomal RNAs showed geometric amplification under all reaction conditions tested, presumably independent of cDNA synthesis (data not shown). Although unexpected, such phenomenology has been previously described (28,29). The presence of the template-independent side reactions does not qualitatively affect the hybridization patterns of abundant transcripts, but because such side products limit sensitivity, less abundant transcripts are not detectable in their presence. Curiously, simply adding more amplified RNA to the hybridization does not increase sensitivity as assessed by average differences or present calls (data not shown). However, reduction of primer increased the number of present calls over 10-fold (see Results). We have shown, after minimizing side reactions by reducing the amount of carryover primer in the transcription reaction and using moderate concentrations of enzyme, that sensitivity and representation of the amplification procedure are very good (Figs 4 and 5).
The poor 5′ representation of amplified RNA is most likely caused by inefficient RT. Indeed, we observed differences in 5′ representation that correlate with different RT reaction conditions and that may explain the introduction of systematic biases. The RT reactions for the 200 ng and 10 µg amplifications were performed at 42 and 50°C, respectively; the 200 ng amplification showed significantly greater loss of 5′ complexity (see Results). This suggests that constant RT reaction conditions should minimize the introduction of biases, and that variability in cDNA synthesis efficiencies could drastically perturb the resulting expression data. 5′ representation is further compromised during the second round of amplification, which depends on random priming cDNA synthesis (Fig. 1).
The significance of reduced 5′ complexity and specific activity is dependent on microarray design. It is clear from this work that sufficient 5′ complexity can be maintained through two rounds of amplification where oligonucleotide arrays biased towards the 3′ end of genes are used (Fig. 4). cDNA microarrays that contain a complete 3′-UTR should be even less sensitive to loss of 5′ representation. However, microarrays produced with DNA restricted to the 5′ ends of a gene will be very sensitive to loss of 5′ information; even slight differences in cDNA synthesis efficiency, with or without amplification, could drastically affect the data and resulting interpretations. In addition, microarrays employing competitive hybridization should allow more robust detection of differences between samples where specific activity is low. Because both measurements are made from a single hybridization, two-channel detection minimizes the increase in gene-specific variance in signal-to-noise that accompanies loss of specific activity. This advantage of cDNA microarrays may explain the success of Wang et al. (17) in detecting ‘outliers’ in spite of the presumed low specific activity of their amplification products, and suggests that it should be possible to obtain satisfactory results using our optimized protocol from even less RNA when hybridizing to cDNA microarrays.
Quantitative measurements of mRNA levels after amplification are highly reproducible. The reproducibility of a single round of amplification is comparable to that of the chip hybridization and readout procedure itself (Fig. 3). However, there may be a stochastic component to the bias introduced by two rounds of amplification (Fig. 3). The source of this stochastic bias probably lies in the small RT volumes used, which would suggest a trade-off between reproducibility and sensitivity. Competing template-independent reactions or random priming may also contribute to the lower reproducibility seen with two rounds of amplification. Nevertheless, after two rounds of amplification reproducibility is sufficiently high for reliable quantification of differences between samples (Fig. 6).
Furthermore, and equally important, there is no compression of differences between RNA samples with either one or two rounds of amplification. We found, using existing amplification protocols (16,17), that gene frequencies and the differences between them in different RNA samples drop with less starting RNA, and that simply adding more amplified RNA to the hybridization did not improve signal intensity or the linear range of differences between RNAs (data not shown). This ‘compression’ phenomenon is explicable in terms of signal and noise and is consistent with our observations that the amount of template-dependent product (hybridizable) drops relative to template-independent product (non-hybridizable) as less starting RNA is used in the amplification. However, we were able to maintain the full range of frequencies (Fig. 4) and differences between samples (Fig. 5) by limiting the amount of primer used, and therefore the amount of template-independent product included in the hybridization.
Our improved amplification, which is highly reproducible and does not compress differences between samples, still alters the final transcriptional profile. Lockhart et al. have shown, starting with microgram quantities of RNA, that the cDNA-synthesis-in vitro transcription protocol represents the original relative abundance of transcripts very well (14). In contrast, we detect differences between transcript profiles generated from 10 µg and 200 ng of total RNA (Fig. 4), but it is unclear how much these differences are the result of additional amplification or just differences in RT conditions. It is not surprising that the biases introduced by two rounds of amplification, which include a random primed RT reaction, are even greater (Fig. 4). However, because the biases introduced by both one and two rounds of amplification are reproducible (Fig. 3), systematic (Fig. 6) and not too severe (Fig. 4) they should not preclude inclusion of experiments employing this amplification in a ‘compendium’ of expression profiles (7).
We have shown that mRNA can be amplified faithfully from as little as 2 ng of total RNA. Where the application is less demanding than an oligonucleotide array (e.g. cDNA microarray), it may be possible to start with even less RNA. However, until a protocol is developed that further reduces competing side reactions, mRNA amplification by cDNA synthesis and in vitro transcription will be limited to ∼2 ng of total RNA. Two nanograms total RNA can be obtained from a few hundred cells or 10 C.elegans embryos. We have successfully isolated, amplified and profiled mRNA from as few as 10 embryos (data not shown), but care must be taken in the RNA isolation since commonly used reagents can inhibit cDNA synthesis at high concentration. This procedure, in combination with techniques that reduce the complexity of cell types from which RNA is isolated, makes myriad exciting applications of transcript profiling possible.
Acknowledgments
ACKNOWLEDGEMENTS
We wish to acknowledge Bernadine Tsung for preparing the RNA used in these experiments, and J.Hardwick, P.Clemons, L.Henry, S.Haggarty, M.R.Santos and A.Murray for thoughtful discussions and comments. We would also like to thank the W. F. Milton Fund, the Beckman Foundation, Harvard University and the Harvard Center for Genomics Research for financial assistance.
References
- 1.DeRisi J.L., Iyer,V.R. and Brown,P.O. (1997) Exploring the metabolic and genetic control of gene expression on a genomic scale. Science, 278, 680–686. [DOI] [PubMed] [Google Scholar]
- 2.Chu S., DeRisi,J., Eisen,M.B., Mulholland,J., Botstein,D., Brown,P.O. and Herskowitz,I. (1998) The transcriptional program of sporulation in budding yeast. Science, 282, 699–705. [DOI] [PubMed] [Google Scholar]
- 3.Spellman P.T., Sherlock,G., Zhang,M.Q., Iyer,V.R., Anders,K., Eisen,M.B., Brown,P.O., Botstein,D. and Futcher,B. (1998) Comprehensive identification of cell cycle-regulated genes of the yeast Saccharomyces cerevisiae by microarray hybridization. Mol. Biol. Cell, 9, 3272–3297. [DOI] [PMC free article] [PubMed] [Google Scholar]
- 4.Heller R.A., Schena,M., Chai,A., Shalon,D., Bedilion,T., Gilmore,J., Wooley,D.E. and Davis,R.W. (1997) Discovery and analysis of inflammatory disease-related genes using cDNA microarrays. Proc. Natl Acad. Sci. USA, 94, 2150–2155. [DOI] [PMC free article] [PubMed] [Google Scholar]
- 5.Iyer V.R., Eisen,M.B., Ross,D.T., Schuler,G., Moore,T., Lee,J.C.F., Trent,J.M., Staudt,L.M., Hudson,J., Boguski,M.S. et al. (1999) The transcriptional program in the response of human fibroblasts to serum. Science, 283, 83–87. [DOI] [PubMed] [Google Scholar]
- 6.Roberts C.J., Nelson,B., Marton,M.J., Stoughton,R., Meyer,M.R., Bennett,H.A., He,Y.D., Dai,H., Walker,W.L., Hughes,T.R. et al. (2000) Signaling and circuitry of multiple MAPK pathways revealed by a matrix of global gene expression profiles. Science, 287, 873–880. [DOI] [PubMed] [Google Scholar]
- 7.Hughes T.R., Marton,M.J., Jones,A.R., Roberts,C.J., Stoughton,R., Armour,C.D., Bennet,H.A., Coffey,E., Dai,H., He,Y.D. et al. (2000) Functional discovery via a compendium of expression profiles. Cell, 102, 109–126. [DOI] [PubMed] [Google Scholar]
- 8.St. Croix B., Rago,C., Velculesco,V., Traverso,G., Romans,K.E., Montgomery,E., Lal,A., Riggins,G.J., Lengauer,C., Vogelstein,B. and Kinzler,K.W. (2000) Genes expressed in human tumor endothelium. Science, 289, 1197–1202. [DOI] [PubMed] [Google Scholar]
- 9.Young R.A. (2000) Biomedical discovery with DNA arrays. Cell, 102, 9–15. [DOI] [PubMed] [Google Scholar]
- 10.Lockhart D.J. and Winzeler,E.A. (2000) Genomics, gene expression and DNA arrays. Nature, 405, 827–836. [DOI] [PubMed] [Google Scholar]
- 11.Wetmur J.G. and Davidson,N. (1968) Kinetics of renaturation of DNA. J. Mol. Biol., 31, 349–370. [DOI] [PubMed] [Google Scholar]
- 12.Peccoud J. and Jacob,C. (1996) Theoretical uncertainty of measurements using quantitative polymerase chain reaction. Biophys. J., 71, 101–108. [DOI] [PMC free article] [PubMed] [Google Scholar]
- 13.Van Gelder R.N., von Zastrow,M.E., Yool,A., Dement,W.C., Barchas,J.D. and Eberwine,J.H. (1990) Amplified RNA synthesized from limited quantities of heterogeneous cDNA. Proc. Natl Acad. Sci. USA, 87, 1663–1667. [DOI] [PMC free article] [PubMed] [Google Scholar]
- 14.Lockhart D.J., Dong,H., Byrne,M.C., Follettie,M.T., Gallo,M.V., Chee,M.S., Mittmann,M., Wang,C., Kobayashi,M., Horton,H. and Brown,E.L. (1996) Expression monitoring by hybridization to high-density oligonucleotide arrays. Nat. Biotechnol., 14, 1675–1680. [DOI] [PubMed] [Google Scholar]
- 15.Mahadevappa M. and Warrington,J.A. (1999) A high-density probe array sample preparation method using 10- to 100-fold fewer cells. Nat. Biotechnol., 17, 1134–1136. [DOI] [PubMed] [Google Scholar]
- 16.Luo L., Salunga,R.C., Guo,H., Bittner,A., Joy,K.C., Galindo,J.E., Xiao,H., Rogers,K.E., Wan,J.S., Jackson,.M.R. and Erlander,M.G. (1999) Gene expression profiles of laser-captured adjacent neuronal subtypes. Nature Med., 5, 117–122. [DOI] [PubMed] [Google Scholar]
- 17.Wang E., Miller,L.D., Ohnmacht,G.A., Liu,E.T. and Marincola,F.M. (2000) High-fidelity mRNA amplification for gene profiling. Nat. Biotechnol., 18, 457–459. [DOI] [PubMed] [Google Scholar]
- 18.Hill A.A., Hunter,C.P., Tsung,B.T., Tucker-Kellog,G. and Brown,E.L. (2000) Genomic analysis of gene expression in C. elegans. Science, 290, 809–812. [DOI] [PubMed] [Google Scholar]
- 19.Chomczynski P. and Sacchi,N. (1987) Single-step method of RNA isolation by acid guanidinium thiocyanate–phenol–chloroform extraction. Anal. Biochem., 162, 156–159. [DOI] [PubMed] [Google Scholar]
- 20.Gubler U. and Hoffman,B. (1983) A simple and very efficient method for generating cDNA libraries. Gene, 25, 263–269. [DOI] [PubMed] [Google Scholar]
- 21.DeAngelis M.M., Wang,D.G. and Hawkins,T.L. (1995) Solid-phase reversible immobilization for the isolation of PCR products. Nucleic Acids Res., 22, 4742–4743. [DOI] [PMC free article] [PubMed] [Google Scholar]
- 22.Box G.E.P., Hunter,W.G. and Hunter,J.S. (1978) Statistics for Experimenters. Wiley, New York, NY.
- 23.Kacharmina J.E., Crino,P.B. and Eberwine,J. (1999) Preparation of cDNA from single cells and subcellular regions. Methods Enzymol., 303, 3–18. [DOI] [PubMed] [Google Scholar]
- 24.Eberwine J. (1996) Amplification of mRNA populations using aRNA generated from immobilized oligo(dT)-T7 primed cDNA. Biotechniques, 20, 584–591. [DOI] [PubMed] [Google Scholar]
- 25.Madison R.D. and Robinson,G.A. (1998) λRNA internal standards quantify sensitivity and amplification efficiency of mammalian gene expression profiling. Biotechniques, 25, 504–514. [DOI] [PubMed] [Google Scholar]
- 26.Rapley R. (1994) Enhancing PCR amplification and sequencing using DNA-binding proteins. Mol. Biotechnol., 2, 295–298. [DOI] [PubMed] [Google Scholar]
- 27.Ji X., Klarmann,G.J. and Preston,B.D. (1996) Effect of human immunodeficiency virus type 1 (HIV-1) nucleocapsid protein on HIV-1 reverse transcriptase activity in vitro. Biochemistry, 35, 132–143. [DOI] [PubMed] [Google Scholar]
- 28.Biebricher C.K. and Luce,R. (1996) Template-free generation of RNA species that replicate with bacteriophage T7 RNA polymerase. EMBO J., 15, 3458–3465. [PMC free article] [PubMed] [Google Scholar]
- 29.Arnaud-Barbe N., Cheynet-Sauvion,V., Oriol,G., Mandrand,B. and Mallet,F. (1998) Transcription of RNA templates by T7 RNA polymerase. Nucleic Acids Res., 26, 3550–3554. [DOI] [PMC free article] [PubMed] [Google Scholar]