Abstract
Background and Purpose
Clinical trial planning and site selection require an accurate estimate of the number of eligible patients at each site. In this study, we developed a tool to calculate the proportion of patients that would meet a specific trial's age, baseline severity and time to treatment inclusion criteria.
Methods
From a sample of 1322 consecutive patients with acute ischemic cerebrovascular syndromes, we developed regression curves relating the proportion of patients within each range of the three variables. We used half the patients to develop the model, and the other half to validate it by comparing predicted versus actual proportions that met the criteria for four current stroke trials.
Results
The predicted proportion of patients meeting inclusion criteria ranged from 6% to 28% among the different trials. The proportion of trial-eligible patients predicted from the first half of the data was within 0.4% to 1.4% of the actual proportion of eligible patients. This proportion increased logarithmically with NIHSS score and time from onset: lowering the baseline limits of the NIHSS score and the treatment window would have the greatest impact on the proportion of patients eligible for a stroke trial.
Conclusions
This model helps estimate the proportion of stroke patients eligible for a study based on different upper and lower limits for age, stroke severity and time to treatment, and may be a useful tool in clinical trial planning.
Keywords: Clinical Trial, acute ischemic stroke, NIH Stroke Scale, age, time factors
Background
Clinical trial planning and site selection depend on an accurate estimate of eligible patients at each site. Overestimates may lead to slower than expected recruitment rate.1 The purpose of this study was to develop a tool to calculate the proportion of patients that would meet a specific trial's age, baseline severity and time to treatment inclusion criteria.
Methods
Patients
This is a retrospective analysis of data collected prospectively for quality improvement purposes at Suburban Hospital (SH) in Bethesda, MD and Washington Hospital Center (WHC) in Washington, DC. This analysis includes data from all patients with an acute ischemic cerebrovascular syndrome2 seen by the NIH Stroke Team at both hospitals between September 30, 2000 and June 30, 2006 whose age, baseline NIHSS score, and onset to triage time (OTT) were known. We abstracted patient data (age, NIHSS score, time last seen normal, and triage time) from the stroke team's clinical database. For the analysis, we used the first NIHSS score recorded by the stroke team. We calculated the OTT by subtracting the time last seen normal from the triage time as documented in the emergency room log. The stroke code paging time was used as the triage time for all in-patient stroke cases. For estimating the proportion of patients presenting within a target treatment time window, we used the OTT plus 60 minutes. When the NIHSS score was missing but the hospital chart documented resolution of symptoms at the time of the evaluation, a score of 0 was given. Patients who had missing data, were younger than 18 years, or who died before hospital admission were excluded. Patient identifiers were removed before the final analyses.
Statistical Analysis
To fit the data to a regression equation, we created a cumulative frequency table that described the proportion of patients with less than or equal to non-zero values of each of the three variables of interest (age, NIHSS score, OTT time). We removed the outlier values (approximately the highest and lowest 2.5% of the sample for age and OTT, and the highest 2.5 % for NIHSS), and fit regression curves using Data Fit 9.0.59 (Oakdale Engineering, Oakdale, PA). The best fitting curve was chosen as that which resulted in the lowest order function that explained > 99.5% of the variance and conformed to the shape of the data.
To validate the model, we divided the sample into two groups, A and B, randomly assigning patients into one or the other group. Using the regression equations obtained from sample A, we calculated the probability that patients would meet the age, NIHSS and time to treatment (estimated as OTT plus 60 minutes) criteria for four recently published or ongoing stroke clinical trials DIAS-2, MR RESCUE, ROSIE and SAINT,3–6 and compared these predicted proportions with the actual proportions of trial-eligible patients in Group B. A deviation between predicted and actual of more than 5% was considered significant. After confirming the predictive validity of the model, we fitted regression curves for the entire sample for further use.
We calculated the proportion of patients whose age, NIHSS score and OTT were within a range by subtracting the proportion of patients whose values fell below the lower limit from the proportion of patients whose values fell bellow the upper limit. The proportion of patients within range for all three variables was calculated as the product of the three individual proportions, assuming that correlations among the three variables were negligible. To confirm that assumption we calculated pair-wise correlations among the three variables.
Results
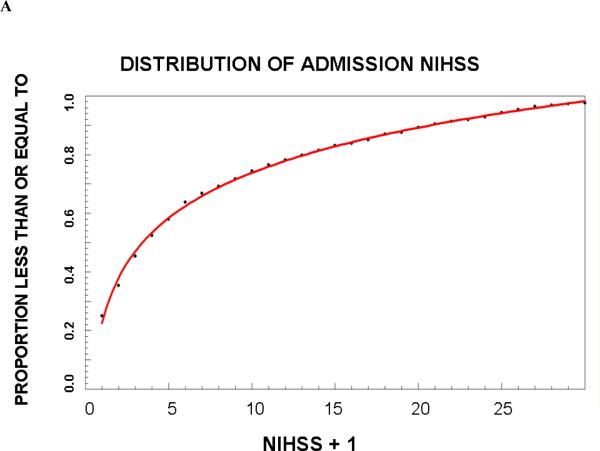
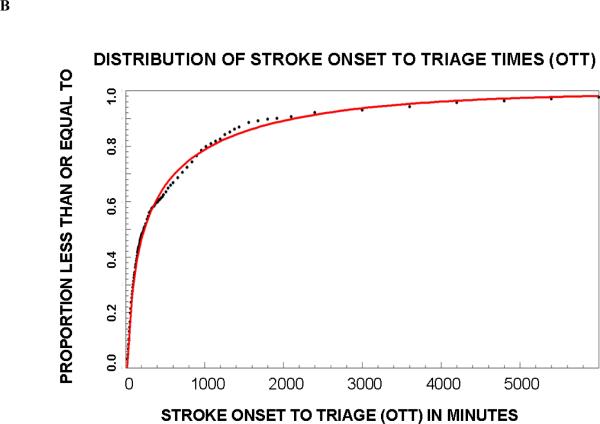
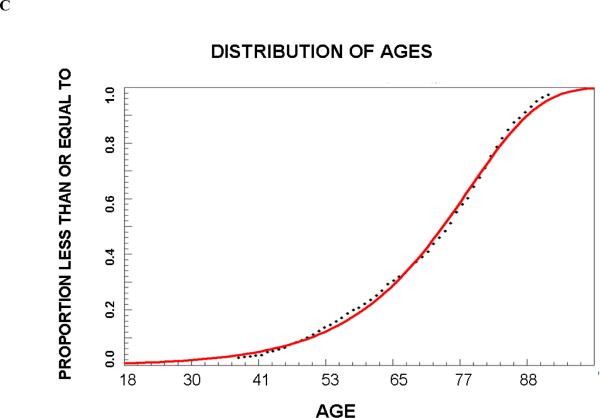
A total of 1322 patients met the inclusion criteria and their summary statistics are listed in Table 1; 651 were randomized to group A and 671 to group B. In Group A, the frequency distribution for age was best fit by a Weibull function (r2=0.997 and 0.997, respectively), for OTT by a third order logarithmic function (r2=0.998 and 0.994), and for NIHSS score by a first order logarithmic function (r2=0.997 and 0.997). The proportions (95 % confidence interval) of trial eligible patients in Group B that predicted from Group A were 6.2% (4.6–8.2%), 8.2% (6.2–10.6%), 28.9% (25.5–32.5%), and 20.1% (17.2–23.4%), respectively. The actual proportions of patients in group B who met these criteria were very similar (Table 2). Since in all cases the deviation between predicted and actual number of patients who met all criteria was within 5%, we proceeded to create final regression equations using the entire dataset. These equations are shown in Table 3. Graphs of the cumulative frequency distribution for the actual and fitted data for each of the three variables are shown in Figure 1. The pair-wise correlation coefficients for the three variables were between 0.05 and 0.13, confirming poor correlation among the variables.
Table 1.
| Total Sample (N=1322) | First group (N=651) | Second Group (N=671) | |
|---|---|---|---|
| Mean age (SD) | 71.6 years (14.7) | 71.7 years (14.7) | 71.4 years (14.7) |
| Median NIHSS score (IQR) | 3 (1–10) | 3 (0–10) | 3 (1–10) |
| Median OTT in minutes (IQR) | 229 (75–868) | 234 (75–862) | 220 (75–859) |
Table 2.
| Trial | Age | NIHSS score | Onset to treatment triage (minutes) | Proportion (95CI) of patients that met the three criteria in Group B | Predicted with equation from entire sample (group A and Group B) | |
|---|---|---|---|---|---|---|
| Predicted with equation from Group A | Actual | |||||
| DIAS-2 | 18–85 | 8–24 | 120–480 | 6.2% (4.6–8.2%) | 5.4% | 6.2% (5.0–7.7%) |
| MR RESCUE | 18–85 | 6–30 | 120–420 | 8.2% (6.2–10.6%) | 6.8% | 8.2% (6.9–9.8%) |
| ROSIE | 18–80 | 0–16 | 120–1380 | 28.9% (25.5–32.5%) | 29.3% | 28.5% (26.1–31.0%) |
| SAINT | 18–95 | 6–40 | 0–300 | 20.1% (17.2–23.4%) | 19.7% | 22.2% (18.1–22.5%) |
Table 3.
Regression equations for the whole sample. These can be used to calculate the probability that the variable of interest falls within a certain range of values.
| Proportion of patients less than or equal to a value for |
| AGE: PAGE= 1-exp(−.0017*1.09AGE) |
| NIHSS: PNIHSS = .23 + .22*ln(NIHSS +1) |
| OTT: POTT = −.07+(−.15)*ln(OTT)+.07*ln(OTT)2+(−.005)*ln(OTT)3 |
| Proportion of patients less than or equal to a value for all three variables (PALL): = PAGE* PNIHSS* POTT |
| To determine the proportion of patients falling within a range of values for a variable subtract PALL for values below the minimum of the range from PALL for the maximum value of the target range. |
Figure 1.
Cumulative proportion of patients that meet criteria for age (A), baseline NIHSS score (B) and onset to triage times (OTT).
Discussion
We developed a model to estimate the proportion of stroke patients that meet eligibility requirements on a combination of common clinical trial selection variables. With this model, it is possible to estimate the impact on recruitment rate of different cut-off points for three of the most influential entry criteria. Because the variables considered in this paper did not correlate with each other, the simple arithmetic product of the proportions for each variable was a satisfactory predictor. This approach to estimating the proportion of patients eligible for trials could potentially accommodate additional criteria, e.g., imaging features. If the additional variables correlate with the others, however, then the calculation of the proportion meeting all criteria would need to account for that.
Our study has some limitations. We excluded 256 patients from the final data set because they were missing data, most commonly time last known well. These patients, however, would also not be eligible for acute therapies. Because of this selection bias, the SPECTRM model may overestimate the proportion of patients eligible for a specific clinical trial. In addition, many of our patients would have been excluded because they had a mild stroke (the median baseline NIHSS score was 3). Although our sample is large, was collected prospectively by several physicians, and combines data from two stroke centers serving a multi-ethnic and socio-economically varied population in both inner city and suburban settings, our results would have to be replicated with data from other stroke centers. Despite these limitations, we believe that the statistical functions describing the relationship of baseline features to the proportion of patients, although the parameters of the regression equations we defined may vary by stroke center or geographical regions because of different demographic and organizational characteristics.
This model may be useful in clinical trial planning. Because the proportion of patients increased logarithmically with NIHSS and time from onset (Figure), allowing the inclusion of patients with milder strokes and earlier treatment (i.e. not limiting enrollment to patients beyond the standard thrombolytic time window) will have a greater impact on the proportion of eligible patients than extending the time window or allowing older or more severe patients to enroll. The design of clinical trials strikes a balance among several important, often competing, features including sample size, recruitment rate, years required to complete the trial, generalizability, and optimal patient selection to maximize effect size. Although lowering the minimum NIHSS requirement would exponentially increase the pool of eligible patients, these patients tend to recovery spontaneously and may be less likely to demonstrate a treatment effect. Enrolling only patients outside the time window for intravenous thrombolytic therapy may be desirable when investigating the effects of a new treatment as a monotherapy, but that decision would exclude the nearly 50% of otherwise eligible patients who present in time for alteplase therapy. Balancing these design factors is difficult and often depends on expert opinion. The model we developed adds a quantitative dimension to this decision making process that has not been previously available.
Acknowledgements
We would like to thank Dr. Lawrence Latour and the members of the NIH Stroke Teams at Suburban Hospital and Washington hospital who assisted with data collection and patient care.
Funding This research was supported by the Division of Intramural Research of the National Institute of Neurological Disorders and Stroke, National Institutes of Health.
Footnotes
Disclosure/Conflict of Interest: None.
This is a PDF file of an unedited manuscript that has been accepted for publication. As a service to our customers we are providing this early version of the manuscript. The manuscript will undergo copyediting, typesetting, and review of the resulting proof before it is published in its final citable form. Please note that during the production process errors may be discovered which could affect the content, and all legal disclaimers that apply to the journal pertain.
References
- 1.Elkins JS, Khatabi T, Fung L, Rootenberg J, Johnston SC. Recruiting subjects for acute stroke trials: a meta-analysis. Stroke. 2006;37(1):123–128. doi: 10.1161/01.STR.0000195149.44390.aa. [DOI] [PubMed] [Google Scholar]
- 2.Kidwell CS, Warach S. Acute ischemic cerebrovascular syndrome: diagnostic criteria. Stroke. 2003;34(12):2995–2998. doi: 10.1161/01.STR.0000098902.69855.A9. [DOI] [PubMed] [Google Scholar]
- 3.Hacke W, Furlan AJ, Al-Rawi Y, Davalos A, Fiebach JB, Gruber F, Kaste M, Lipka LJ, Pedraza S, Ringleb PA, Rowley HA, Schneider D, Schwamm LH, Leal JS, Söhngen M, Teal PA, Wilhelm-Ogunbiyi K, Wintermark M, Warach S. Intravenous desmoteplase in patients with acute ischaemic stroke selected by MRI perfusion-diffusion weighted imaging or perfusion CT (DIAS-2): a prospective, randomised, double-blind, placebo-controlled study. Lancet Neurol. 2009 Feb;8(2):141–50. doi: 10.1016/S1474-4422(08)70267-9. [DOI] [PMC free article] [PubMed] [Google Scholar]
- 4.MR and Recanalization of Stroke Clots Using Embolectomy (MR RESCUE) ClinicalTrials.gov Identifier NCT00389467. [Google Scholar]
- 5.ReoPro Retavase Reperfusion of Stroke Safety Study - Imaging Evaluation (ROSIE) ClinicalTrials.gov Identifier NCT00039832. [Google Scholar]
- 6.Diener HC, Lees KR, Lyden P, Grotta J, Davalos A, Davis SM, Shuaib A, Ashwood T, Wasiewski W, Alderfer V, Hårdemark HG, Rodichok L, SAINT I and II Investigators NXY-059 for the treatment of acute stroke: pooled analysis of the SAINT I and II Trials. Stroke. 2008 Jun;39(6):1751–8. doi: 10.1161/STROKEAHA.107.503334. [DOI] [PubMed] [Google Scholar]


