

Abstract
Background and objectives: In the Hemodialysis (HEMO) Study, the lower death rate in women but not in men assigned to the higher dose (Kt/V) could have resulted from use of “V” as the normalizing factor, since women have a lower anthropometric V per unit of surface area (V/SA) than men.
Design, setting, participants, & measurements: The effect of Kt/V on mortality was re-examined after normalizing for surface area and expressing dose as surface area normalized standard Kt/V (SAn-stdKt/V).
Results: Both men and women in the high-dose group received approximately 16% more dialysis (when expressed as SAn-stdKt/V) than the controls. SAn-stdKt/V clustered into three levels: 2.14/wk for conventional dose women, 2.44/wk for conventional dose men or 2.46/wk for high-dose women, and 2.80/wk for high-dose men. V/SA was associated with the effect of dose assignment on the risk of death; above 20 L/m2, the mortality hazard ratio = 1.23 (0.99 to 1.53); below 20 L/m2, hazard ratio = 0.78 (0.65 to 0.95), P = 0.002. Within gender, V/SA did not modify the effect of dose on mortality.
Conclusions: When normalized to body surface area rather than V, the dose of dialysis in women in the HEMO Study was substantially lower than in men. The lowest surface-area-normalized dose was received by women randomized to the conventional dose arm, possibly explaining the sex-specific response to dialysis dose. Results are consistent with the hypothesis that when dialysis dose is expressed as Kt/V, women, due to their lower V/SA ratio, require a higher amount than men.
The National Institutes of Health (NIH)-sponsored Hemodialysis (HEMO) Study used a randomized factorial design to assess mortality, hospitalization, and a number of secondary outcomes in hemodialysis patients as a function of dose, targeted as an equilibrated eKt/V of 1.05 versus 1.45, and dialyzer membrane flux (1). The primary results demonstrated no significant overall effect of dose (2) on mortality or hospitalizations in the full study cohort. In a subgroup analysis, women randomized to the “conventional” (lower) dose had a higher mortality rate than women randomized to the higher dose (3). Because there was an opposite trend toward higher mortality in men randomized to the higher dose, the overall difference in mortality by dose was not statistically significant (3).
The HEMO Study investigators have been cautious in interpreting the gender-dependent results due to the risk of a type I error (false positive result) and other limitations of subgroup analyses. Gender was one of seven prespecified factors considered for subgroup analyses, so after statistical adjustments were made for multiple comparisons, neither the dose effect in women nor the interaction characterizing the difference in the dose effects between women and men reached statistical significance (4). Several observational studies published during the conduct of the HEMO Study and subsequently (5,6) suggested that the association between dose expressed as per-session Kt/V and mortality might indeed be different among women and men. However, interpretation of the observational study results is complicated by the demonstration within the HEMO Study of substantial bias in the relationship between achieved dose and mortality, with the further complication that this bias appears to have been stronger in women than in men (7).
Lowrie et al. objected to normalizing Kt by V and initially suggested giving the same dialysis dose, expressed as Kt, to all patients (8). They later modified this approach to suggest that a more appropriate denominator for dialysis dose should be body surface area (9). Rescaling dose to body surface area is not straightforward, because the measured predialysis and postdialysis blood urea nitrogen (BUN) values are directly translated to the urea elimination constant (K/V) by mathematical modeling. Extracting V from this ratio requires knowledge of K (10). We previously proposed a method of rescaling the normalized clearance (Kt/V), based on the average ratio of anthropometric volume (Vant) to body surface area (SA) in men and women based on age, height, and weight, and also suggested applying this rescaling factor to the standard Kt/V (stdKt/V) in population studies (11). The purpose of the present study was to re-examine the gender effect on dose response in the HEMO Study using dose rescaled to surface area instead of V using the method previously described.
Materials and Methods
Patients and Study Design
Details of the study design and the characteristics of the 1846 randomized patients in the HEMO Study have been reported and are briefly summarized (1,2,4). Patients 18 to 80 years of age who had been hemodialysis-dependent for at least 3 months with less than 1.5 ml/min per 35 L of residual urea clearance were enrolled between 1995 and 2000 and followed for up to 6.6 years, with a mean follow-up of 2.84 years. Patients from 72 dialysis units affiliated with 15 clinical centers were randomized with equal allocation under a 2 × 2 factorial design to target equilibrated single pool Kt/V (eKt/V) levels of 1.05 or 1.45 and to low or high flux membranes. To qualify for randomization, each patient had to achieve an eKt/V ≥ 1.30 within 4.5 hours of treatment during the baseline period, resulting in the exclusion of very large patients, so that 97% of randomized patients weighed less than 100 kg.
Computations
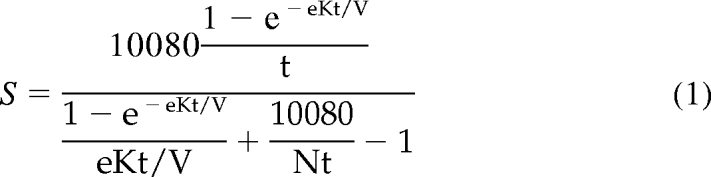
Throughout the conduct of the trial, eKt/V was computed from the single-pool Kt/V (spKt/V) using the Daugirdas-Schneditz rate equation, eKt/V = spKt/V − 0.6 K/V + 0.03 (12). This adjusts spKt/V based on the rate of dialysis (K/V). The spKt/V was determined from the pre- and postdialysis BUN using the two-BUN method (10,13). The dose intervention was monitored by monthly kinetic modeling sessions and administered with centrally generated dialysis prescription reports. On the basis of a detailed kinetic modeling substudy performed at the 4- and 36-month visits, a modified rate equation (eKt/V = spKt/V − 0.4 K/V [+0.01 for patients in the high-dose group]) was later developed and used to present the study results (13). In this report, standard Kt/V is estimated for each kinetic modeling session using a two-step calculation. In the first step, an approximation to stdKt/V (denoted S) was obtained using a simplified, fixed-volume equation (14):
 |
(1) |
where N = 3, the number of treatments per week in the HEMO Study, t denotes treatment time in minutes, and eKt/V was computed using a modification of the Tattersall equation (15) given by eKt/V = spKt/V × [T/(T + 23.2)], where the time constant of 23.2 minutes corresponds closely to the 0.40 term in the modified Daugirdas-Schneditz equation (12,13). In the second step, stdKt/V was corrected for ultrafiltration by: stdKt/V = S/(1 − [0.74/N] × Qfw/V) (16), where N again denotes the number of dialysis sessions per week, Qfw is the weekly fluid ingestion, and V is the modeled urea volume. This two-step procedure yields estimates of delivered stdKt/V, which closely approximate those provided by an exact solution to the two-pool variable extracellular volume model if the intercompartmental clearance, Kc in ml/min, is assumed to be 0.016 times the postdialysis modeled two-pool volume, in milliliters (16,17). The stdKt/V estimates obtained by this approximation reflect delivered dialysis dose, and thus exclude residual renal urea clearance, which by design was small in HEMO Study subjects (<1.5 ml/min at entry).
We used three different approaches to calculate surface-area-normalized stdKt/V (SAn-stdKt/V). In the first approach, an anthropometric estimate of V (VWatson) was computed using the equation of Watson et al. (18), and SA was estimated by the equation of Dubois and Dubois (19). An estimate of SAn-stdKt/V was computed by multiplying stdKt/V by the ratio V/SA divided by 20, as described previously (11). In the second approach, we corrected Watson V to more precisely estimate the modeled urea volume under the conditions of the HEMO Study by applying a regression equation developed from HEMO Study baseline data to relate modeled volume to Watson V, gender, age, race, and diabetic status (20). The resulting estimate was VHEMO = 0.824 × VWatson × (1 + 0.033 [if diabetic]) × (1 + 0.033 [if female]) × (1 + 0.043 [if black]) × (1 – [0.002 × ([Age − 50]/10)] [if male]) × (1 − [0.015 × ([Age − 50]/10)] [if female]). The use of VHEMO in place of VWatson accounts for race and diabetic status in addition to a lower value for modeled V in comparison to Watson V (20). In this second approach, the estimate of surface-area-normalized stdKt/V (SAn-stdKt/V) was computed by multiplying stdKt/V by (VHEMO/SA)/17.2, where 17.2 was the average of the population mean values for VHEMO in men and in women. In the third approach, the mean modeled volume (Vave-modeled) was obtained as the average of the 4-month running mean modeled volumes over a designated period (see Data Analyses section), where the 4-month running mean volumes excluded outlying measurements if the coefficient of variation exceeded 10% (7). In this third approach, the estimate of SAn-stdKt/V was computed by multiplying stdKt/V by [(Vave-modeled)/SAave]/17.8, where SAave denotes the average body surface area over the same period that was used to compute Vave-modeled, and 17.8 was the average value of the mean values for Vave-modeled/SAave in men and in women. Altogether, this report examines a total of six different measures of dialysis dose: eKt/V per dialysis session, weekly stdKt/V, SAn-eKt/V (defined as eKt/V × [VWatson/SA]/20), and the three calculations of SAn-stdKt/V as described above.
Cohorts for Data Analysis
Two different patient cohorts were used. The first cohort, which was used to characterize the distributions of SAn-stdKt/V and other measures of dialysis dose, consisted of 1621 of the 1846 randomized patients without above-the-foot amputations who had at least 5 months of valid kinetic modeling data after randomization. Results of individual kinetic modeling sessions were regarded as invalid and excluded from analyses if interruption time exceeded 15 min (2.4% of sessions) or if the pre- and post-BUNs exhibited extreme errors (2.5% of sessions). The second cohort consisted of 1765 randomized nonamputees, including all 1621 patients in the first cohort, and was used in analyses relating mortality to the dose intervention and baseline factors.
Analyses of Dialysis Dose Distributions
Each of the six dialysis dose measures were first averaged over the first 12 months of follow-up for each of the 1621 patients in the dialysis dose cohort. A 12-month period was selected for computation of average dose levels because 12 modeling sessions were sufficient to reduce variations associated with measurement error in modeled volume, but not so long as to incur large systematic within-subject changes in weight or modeled volume.
The distributions of the averaged dose measurements were then compared between males and females who were assigned to the standard and high-dose groups using standard descriptive statistics and displayed using nonparametric kernel density curves (21). Summaries based on averages over each patient’s full follow-up period gave results similar to those based on the 12-month averages and are not shown.
Analyses of Mortality
Analyses of mortality were performed using methods similar to those we reported previously describing the effect modification (interaction) by gender on the dose-mortality relation (3). The interaction between the dose and gender herein refers to the difference between the effects of the dose intervention in females compared with males.
In the primary analysis of the full HEMO Study cohort, the effects of the dose and flux interventions on mortality were tested using Cox regression with stratification for clinical center and controlling for seven prespecified baseline factors: Age, gender, race, years on dialysis, diabetes, modified index of coexisting disease (ICED) (22), and serum albumin, plus the interaction of baseline serum albumin with follow-up time (1,2). In this report, the question of whether the previously reported dose times gender interaction on mortality might be related to the normalization of dose by V instead of SA was explored by expanding the primary Cox regression model by adding interaction terms to model separate hazard ratios for the dose effect within subgroups defined by gender and/or the ratio of Watson volume to body surface area (VWatson/SA) at baseline. The expanded Cox regressions were stratified by the subgroups under investigation to account for possible differences in the baseline hazard function between the subgroups. The interaction between dose assignment and baseline VWatson/SA as a continuous variable was tested by adding a product term between baseline VWatson/SA and dose assignment to the primary Cox regression analysis.
Due to evidence of large biases from uncontrolled confounding in analyses relating achieved dose and mortality (7), all analyses of the dose effect are based on comparisons of the randomized dose groups rather than on the achieved levels of eKt/V or alternative dose measures. All P values are two-sided without adjustment for multiple comparisons.
Results
Dialysis Dose Distributions
The baseline demographic characteristics of subjects in the HEMO study have been previously described (2,3,13) and are not be repeated here. The mean levels of selected anthropometric and modeling parameters over the first 12 months of follow-up are summarized for the 1621 subjects of the dialysis dose cohort in Table 1.
Table 1.
Anthropometric body size measures and modeled volumes in men and women randomized to the conventional and high dose groups (mean ± SD)
| “Conventional” Dose Arm |
High-Dose Arm |
|||
|---|---|---|---|---|
| Women (n = 446) | Men (n = 369) | Women (n = 463) | Men (n = 343) | |
| Postdialysis weight (kg) | 67.3 ± 15.3 | 73.4 ± 13.6 | 66.9 ± 15.1 | 71.5 ± 13.8 |
| Height (cm) | 160 ± 7 | 171 ± 78 | 159 ± 7 | 171 ± 7.4 |
| Surface area (SA, m2) | 1.69 ± 0.19 | 1.85 ± 0.18 | 1.69 ± 0.18 | 1.83 ± 0.18 |
| Watson V (Vant, L) | 31.5 ± 4.1 | 40.0 ± 5.0 | 31.4 ± 4.0 | 39.4 ± 5.0 |
| Vmodeled/Vant | 0.90 ± 0.10 | 0.88 ± 0.08 | 0.91 ± 0.11 | 0.88 ± 0.08 |
| Vant/SA (L/m2) | 18.6 ± 0.4 | 21.6 ± 1.0 | 18.6 ± 0.4 | 21.5 ± 1.0 |
Vmodeled, two-pool modeled volume using urea kinetics. Values are averages over the first 12 months of follow-up.
The women were lighter than the men, shorter in stature, had lower estimated values for body water and for body surface area, and had a markedly lower ratio of Vant/SA (where Vant was the Watson estimate).
The distributions of six dialysis dose measures are summarized in Table 2 and in Figure 1, A through F. As shown in Figure 1A and the first row of Table 2, the mean eKt/V was slightly higher for women than for men in both dose groups, but the percent separation in the mean eKt/V between dose groups was similar (32% to 33%) for both men and women. A similar pattern was seen when dose was expressed as stdKt/V (Figure 1B), except that the separation in mean dose was reduced to 18.5% for women and 14.9% for men. When expressed as SAn-eKt/V (Figure 1C), dose levels fell into four groups ranked low to high as conventional dose women, conventional dose men, high-dose women, and high-dose men, with dose increments of 12% to 17% between the successive groups. When expressed as SAn-stdKt/V calculated using VWatson/SA (Figure 1D), the SAn-stdKt/V of the high-dose women and conventional dose men were roughly the same, with SAn-stdKt/V doses being roughly 15% lower in conventional dose women and 15% higher in conventional dose men. Somewhat similar patterns were observed when SAn-stdKt/V was computed using the HEMO Study estimate of V (VHEMO/SA) as shown in Figure 1E. Results were also similar when SAn-stdKt/V was computed using Vave-modeled/SAave (Figure 1F), but in this case the mean dose was slightly (2% to 4%) higher in high-dose women than conventional-dose men.
Table 2.
Separation (increase) in dialysis dose when compared to women assigned to the conventional dose group
| Dose Measure | Women (Mean) |
Men (Mean) |
%Δ of Mean Dose versus Women Assigned to Conventional Dose |
||||
|---|---|---|---|---|---|---|---|
| Conventional | High | Conventional | High | High Women | Conventional Men | High Men | |
| eKt/V | 1.170 | 1.549 | 1.138 | 1.503 | 32.4% | −2.7% | 28.5% |
| stdKt/V | 2.230 | 2.643 | 2.264 | 2.601 | 18.5% | 1.5% | 16.6% |
| SAn-eKt/V | 1.087 | 1.440 | 1.228 | 1.616 | 32.5% | 13.0% | 48.7% |
| SAn-stdKt/V (VWatson) | 2.136 | 2.457 | 2.442 | 2.797 | 15.0% | 14.3% | 30.9% |
| SAn-stdKt/V (VHEMO) | 2.163 | 2.489 | 2.438 | 2.791 | 15.1% | 12.7% | 29.0% |
| SAn-stdKt/V (modeled V) | 2.162 | 2.500 | 2.410 | 2.764 | 15.6% | 11.5% | 27.8% |
Shown are mean levels of dose indices averaged over the first 12 months of follow-up, and the percent differences in the mean indices between subgroups defined by gender and dose group. eKt/V, equilibrated Kt/V; stdKt/V, standard Kt/V computed with a variable volume model; SAn-eKt/V, eKt/V multiplied by (VWatson/SA)/(population mean value of VWatson/SA); SAN-stdKt/V is the standard Kt/V value multiplied by (V/SA)/(population mean value for V/SA), where V is computed either as the anthropometric Watson V, the anthropometric V according to the HEMO equation, or the kinetically modeled two-pool V.
Figure 1.

(A) Equilibrated Kt/V (eKt/V) in the conventional and high-dose HEMO Study subjects by gender. Frequency density values shown represent nonparametric kernel density curves (21). (B) stdKt/V in the conventional and high-dose HEMO Study subjects by gender. (C) SAn-eKt/V (surface-area-normalized equilibrated Kt/V) in the conventional and high-dose HEMO Study subjects by gender. Normalization was using the VWatson/SA ratio. (D) SAn-stdKt/V (surface-area-normalized standard Kt/V) in the conventional and high-dose HEMO Study subjects by gender, where the V/SA adjustment was based on Watson anthropometric V. (E) SAn-stdKt/V in the conventional and high-dose HEMO Study subjects by gender, where the V/SA adjustment was based on the HEMO Study approximation for anthropometric V. (F) SAn-stdKt/V (surface-area-normalized standard Kt/V) in the conventional and high-dose HEMO Study subjects by gender where the V/SA adjustment was based on average modeled V.
Analyses of Mortality
As described in the Materials and methods section, if the effect modification by gender on the dose-mortality relation in the HEMO Study resulted from scaling of dialysis dose by V instead of S, we should expect to see a related interaction, with a greater reduction in mortality by the high-dose intervention among patients with lower levels of Vant/SA than among patients with higher levels of Vant/SA.
Reflecting the inclusion of gender in the Watson formula for Vant, Figure 2 shows that baseline Vant/SA was strongly associated with gender among the 1765 nonamputees included in the mortality analyses. Overall, gender accounted for almost 80% of the variation in VWatson/SA (R2 = 0.795), with median VWatson/SA equal to 18.6 in women versus 21.6 in men. A cutoff of 19.8 L/m2 optimally discriminated between the genders (Table 3), separating subjects by gender in 1722 (97.6%) of the 1765 subjects. Table 4summarizes the results of Cox regression analyses of the effects of dose assignment on all-cause mortality, first by gender (left columns), then within two subgroups defined by VWatson/SA ≤ 19.8 and VWatson/SA > 19.8 L/m2, and finally within each of four subgroups, using additional VWatson/SA thresholds defined by the median VWatson/SA among women (18.50 L/m2) and among men (21.55 L/m2).
Figure 2.

Distribution histograms of baseline Vant/SA (Vant = Watson V) in men (top panel) and women (lower panel) in 1765 HEMO study subjects without above-the-foot amputations.
Table 3.
Cross-classification of Vant/SA category by gender
| Females | Males | |
|---|---|---|
| Vant/SA < 19.8 L/m2 | 968 | 18 |
| Vant/SA ≥ 19.8 L/m2 | 25 | 754 |
Table 4.
Dose assignment: Mortality risk interactions with gender and with Vant/SA as a categorical variable (n = 1765)
| by Gender |
by Vant/SA(L/m2) |
by Vant/SA (L/m2) (four groups) |
||||||
|---|---|---|---|---|---|---|---|---|
| Women | Men | ≥19.8 | >19.8 | <18.50 | 18.50 to 19.8 | 19.8 to 21.55 | >21.55 | |
| Dose assignment effect on mortality | 0.80 | 1.18 | 0.78 | 1.23 | 0.80 | 0.75 | 1.23 | 1.25 |
| 95% confidence limits | 0.67 to 0.97 | 0.95 to 1.46 | 0.65 to 0.95 | 0.99 to 1.53 | 0.61 to 1.06 | 0.57 to 0.99 | 0.92 to 1.63 | 0.86 to 1.81 |
| Interaction P value | 0.009 | 0.002 | 0.024 (across four Vant/SA groups) 0.026 (Vant/SA as continuous variable) | |||||
As reported previously (3), there was significant effect modification by gender when considering volume-normalized dose; in this cohort of 1765 patients, high-dose therapy was associated with a 20% lower mortality in women and an 18% higher mortality in men (interaction P = 0.009). As would be expected, when the analysis was repeated versus VWatson/SA divided into two groups maximally aligned with gender, the results were similar, with an interaction P value of 0.002. However, there was no evidence that the dose effect varied by VWatson/SA within men or within women; although variation of VWatson/SA within gender was small, limiting statistical power. When VWatson/SA was divided into four groups (Table 1), there was no discernable difference in mortality risk between the two lower groups nor between the two higher groups. However, due to the differences in the hazard ratios between the two lower and two higher VWatson/SA groups, the interaction between dose and VWatson/SA remained nominally significant when VWatson/SA was divided into the four groups of Table 4 (P = 0.024) and when VWatson/SA was treated as a continuous variable (P = 0.026). Similar results were obtained for the interaction of dose group with Vant/SA when Vant was computed using the HEMO Study adjustment to the Watson formula (data not shown).
Discussion
When the HEMO study was designed, V was used to normalize dialysis dose, and the dose intervention was carefully formulated to administer the same dose of dialysis to subjects in a given arm, regardless of gender. Our results, and those published previously, show that the original design was followed closely (2,3,7). The separation in mean dose based on eKt/V, the primary dose measure, amounted to 33% (2), and was similar among men and women (Table 2). After the HEMO study was well underway, Keshaviah (23) and Gotch (24,25) proposed a new concept of measuring the dose of dialysis using a continuous equivalent clearance, defined by Keshaviah as the weekly solute removal index, and by Gotch as standard Kt/V (stdKt/V). We recalculated the HEMO dose in the two dosing arms by gender using this new continuous measure of dialysis adequacy, with a modification to account for ultrafiltration using two-pool modeling (16,17). Our results indicate that separation between the two arms was cut in half when viewed using stdKt/V instead of eKt/V, i.e., from about 33% to 16% to 17%. While it is possible that a higher dialysis dose is in fact not superior to a conventional dose, the overall lack of a dose effect in the HEMO study might also be explained by the relatively small separation in stdKt/V achieved between the two dose groups. The limited separation between the conventional and high-dose groups was on the one hand a consequence of the necessity of meeting national guidelines for minimum dose levels (URR ≥65% or single pool Kt/V >1.2) in the conventional dose group, and on the other hand the infeasibility of extending treatments in the high-dose group substantially beyond 4.5 hours under the three times per week dialysis schedules used in the United States during the period of the trial. To achieve larger increments in stdKt/V requires either a marked prolongation of the dialysis session length or increased frequency of dialysis, as is being tested in the Frequent Hemodialysis Network randomized controlled trials (26). Regardless, the separation between dosing arms in the HEMO Study were similar among men and the women when analyzed in terms of stdKt/V. Thus, changing the dose expression from eKt/V to stdKt/V alone cannot explain the statistically significant (and potentially clinically important) effect modification by gender on the dose-mortality relation.
As we explored the dose by gender interaction, we needed to reconsider the method by which dialysis dose was normalized. The concept of normalizing dialysis dose to urea distribution volume, which is similar to that of total body water, has been well established, since dialysis dosing based on urea kinetic modeling was initiated with post hoc analyses of the National Cooperative Dialysis Study 25 years ago (27). This approach is valid if the generation of urea is proportional to the urea distribution volume and if urea is to be the marker for uremic toxins. However, if one examines the native GFR as measured by iothalamate clearance in potential kidney donors, GFR divided by SA is similar in the two genders, whereas GFR divided by anthropometric (Watson) volume (Vant) is not (28). Women have a lower Vant/SA ratio than men, since they have relatively less water-rich muscle mass and relatively more water-poor adipose mass. We previously examined the Vant/SA ratio in the HEMO study subjects during the baseline period and found that Vant/SA was quite different among women and men, being lower than 20 L/m2 in most women, and higher than this value in almost all men (11). It is difficult to rescale dialysis dose directly, since what one measures, via the urea reduction ratio, is Kt scaled to V. However, multiplying Kt/V by Vant/SA yields a value that is effectively Kt/SA. This value can then be normalized to a Vant/SA ratio that is the average of that in men and women (11). We used this approach to compute a “surface-area-normalized” value of stdKt/V (SAn-stdKt/V). If this alternative normalization in terms of body surface area were a valid construct, it would be clear that female subjects in the HEMO study, within both conventional and high-dose arms, received less dialysis than did male subjects.
So how might invoking surface-area-normalization of the stdKt/V explain the previously reported effect modification by gender on the dose-mortality relation (3)? Although SAn-stdKt/V was lower in the women than in the men in both dosing arms, the separations between stdKt/V and SAn-stdKt/V in the two dose groups by gender were almost identical. However, the mean values for SAn-stdKt/V segregated into three ranges (Table 2 and Figure 1, D through F). Women assigned to the conventional eKt/V group had a mean SAn-stdKt/V of 2.14. The women in the high-dose group and the men in the conventional-dose group formed the second range of values, with mean SAn-stdKt/V values of 2.46 and 2.44, respectively. Finally, men assigned to the high-dose group had a mean SAn-stdKt/V of 2.80. Even though the SAn-doses segregated in this fashion, if the relationship between SAn-stdKt/V and mortality were linear in the range of 2.1 to 2.8, one could still not explain a difference in dose-mortality effect between men and women. However, if one were to postulate a breakpoint in the relation between SAn-stdKt/V and mortality somewhere in the range of SAn-stdKt/V = 2.5, it is conceivable that even although the separation in SAn-stdKt/V in men and women was similar in the HEMO study, the women may have been on a steeper portion of the dose versus mortality curve. We believe this to be a reasonable conjecture; we know for certain that the dose-mortality curve must be nonlinear, as when stdKt/V approaches zero, the mortality risk must be extremely high.
It is important to keep in mind that the above explanation for the dose effect in females was developed in a post hoc fashion, after examination of the data, and that it requires positing not only that the dose should be normalized by SA (or a related measure) rather than V but also that the dose-response relationship might exhibit a nonlinear break point at or around a SAn-stdKt/V of 2.5, intermediate between women on the conventional dose and the remaining HEMO Study patients. Furthermore, it fails to explain one important point: When comparing the mortality risk in men randomized to the conventional versus the high-dose arms, the men in the high-dose arm did not have a slightly reduced mortality risk; in fact, their risk was increased, albeit not significantly (P = 0.16). Finally, while the subgroup analysis by gender was prespecified, it was one of seven such analyses, and this exercise could reflect a reanalysis of a false positive result. Given its magnitude and clinical importance, however, we felt compelled to explore it further.
In our previously reported analysis of the interaction of dose with gender in the HEMO trial (3), we applied multivariable models in an attempt to determine whether the dose by gender interaction could be explained by differences in size measures among women and men. Unfortunately, the power of our analyses to disentangle gender and body size was limited, first by the usual power constraints for detecting interactions within a single trial (29) and second by strong correlations among gender and body size parameters, such as height, weight, and the derived body surface area and body mass index (a problem of multicollinearity). Thus, it is not surprising that our analyses adjusted for gender and body size provided no evidence of stronger dose effects in patients with smaller size parameters once the differential dose effects with gender were taken into account. What was surprising, given the low statistical power, was that the dose by gender interaction persisted after controlling for the interactions of dose with several of the size parameters, including body surface area (3).
We confronted a similar issue in the present study, as gender accounted for nearly 80% of the variation in baseline Vant/SA, and essentially all of the patients with VWatson/SA below 20 were women, and almost all with VWatsonSA above 20 were men. Thus, as would be expected, when VWatson/SA was dichotomized into values less than or greater than 19.8, we obtained similar results irrespective of whether we analyzed by gender or by dichotomized Vant/SA. Similar to the other size parameters evaluated previously, we also found no significant dose effect among men with smaller Vant/SA compared with men with larger Vant/SA, nor among women with smaller Vant/SA compared with women with larger Vant/SA. However, because the ranges of Vant/SA within men and within women were so narrow, the power to detect differences by size within gender was extremely low. Because gender is itself included in the calculation of Vant, we made no attempt to determine if the dose by gender interaction persisted after accounting for the interaction of dose with Vant/SA.
In summary, the evidence from the HEMO Study suggesting a dose by gender interaction, the strong interdependence of gender with Vant/SA, and the lower levels of achieved SAn stdKt/V for women assigned to the conventional dose compared with other HEMO Study subjects are together consistent with a hypothesis of a nonlinear dose-response between SAn stdKt/V and mortality with a threshold around 2.5. However, due to the collinearity between gender and Vant/SA, analyses of mortality in HEMO Study cannot provide further corroboration for this hypothesis beyond that implicit in the dose by gender interaction itself.
If one considers dosing dialysis normalized by body surface area, why not dose by Kt/SA directly instead of multiplying Kt/V by Vant/SA? To answer this question, one needs to recall the substantial errors in Kt/V that can occur when Kt/V is derived from the urea reduction ratio and estimates of dialyzer clearance and treatment time. In situations where the modeled V can be determined reliably, adjusting by Vmodeled/SA, which is similar to computing Kt/SA directly, is theoretically feasible. However, large errors in single estimates of modeled V are common with modeling technology as it exists today. Similarly, underestimation or overestimation of true V by Vant is common and substantial when applied to individual patients. Given these limitations, marked departures from current dialysis dosing standards should be done with caution, especially when V/SA in a given patient departs by more than 10% to 15% from the population mean value for whatever measure of V and SA are being utilized.
If one does consider SAn-stdKt/V as a new candidate for minimum dialysis dose, at what level should the minimum value be set? The current KDOQI standards set a minimum of stdKt/V of 2.0 (30). This was based on equivalency to a three per week schedule with a minimum single pool Kt/V of about 1.2, when stdKt/V was estimated using the simplified, fixed-volume equation listed above as Equation 1 (30). When stdKt/V is computed using variable-volume formal modeling, as we have done in this study, the dose of stdKt/V is about 6% to 7% higher than determined by the fixed-volume simplified Equation 1, due to volume removal (16,17). Therefore, the corresponding minimum stdKt/V target using formal kinetics should be about 7% higher, 2.15 instead of 2.0. By how much, on average, might one recommend that this minimum, formally calculated stdKt/V target of 2.15 be increased in women? The amount of increase may depend somewhat on what method is used to estimate V in the V/SA calculation. If the Watson V is used, the median Vant/SA ratio for women (18.5) is about 8% lower than the population mean for both sexes (approximately 20), and so for women, the minimum target stdKt/V would need to be on average about 8% higher. To effect an 8% increase in stdKt/V (e.g., from 2.15 to 2.32) with a three per week dialysis schedule, a proportionately larger change in the per-session single-pool Kt/V is required. As a rough guide, the spKt/V would need to be approximately 1.40 instead of 1.20, and the minimum urea reduction ratio for women would need be about 70% instead of 65%. However, the approach of correcting the VWatson/SA ratio to the population mean, which is 20 (Figure 2), implies that the dose in men, in whom VWatson/SA averages 21.5, could be reduced by 8%, with the thought that men have more muscle, which contributes relatively little to body surface area and therefore to the need for dialysis. The reduced risk of mortality associated with larger muscle mass in dialysis patients is usually attributed to better nutrition, but it is also possible that muscle metabolism might have a detoxifying effect on certain uremic retention solutes, e.g., amino acid derivitives. However, in the absence of reliable outcomes data, recommending less dialysis for men would certainly be premature. An alternative, more aggressive approach would be to leave the minimum suggested dose in men where it stands and to increase the minimum average stdKt/V target in women by 16%, bringing the women up to the same surface-area-normalized targets that are currently recommended for men, given that the VWatson/SA ratio in mean (21.5) is 16% greater than the 18.5 mean ratio in women. The second approach would require, for women, an average minimum stdKt/V of 2.15 × 1.16 = 2.49, which would translate into a minimum three per week session spKt/V of about 1.60, and a minimum URR target close to 75%. Identifying the minimum acceptable dialysis dose for either gender remains difficult due to the problem with dose targeting bias (7), which confounds interpretation of data that we have in abundance from observational studies.
In the present analysis, the dose-mortality effect was not affected by V/SA within each gender. The presumed explanation was the fact that V/SA was markedly collinear with gender in the HEMO population, and also, the fact that the range of V/SA was so restricted within each gender, and particularly, in women (Figure 2). Thus, the data do not allow us to choose between two equally plausible explanations for the apparent gender effect on the dose-mortality interaction: (1) it’s all about gender and (2) it’s not about gender, but all about renormalization of dose to SA. It ultimately will be important to solve this issue, since the implications of these two alternatives for more correctly targeting dialysis dose are different. If it’s about renormalization to SA using V/SA, then not only gender, but also patient size factors into target dialysis dose, given that in smaller patients, the ratio of V/SA tends to decrease (11,28,31,32). This means that smaller patients would need relatively greater dialysis doses when dose is expressed as Kt/V. Also, a V/SA explanation also suggests that dialysis dose would need to be markedly increased in children, in whom V/SA is markedly reduced (33).
In conclusion, if the doses of dialysis in the HEMO Study are rescaled to body surface area, the two target doses based on urea distribution volume separate out into three distinct surface-area-normalized groups, with the women randomized to the conventional dose arm making up the group receiving the least amount of dialysis. Denominators of dialysis dose other than V may potentially change the way an adequate dose of dialysis is defined. Rescaling dialysis dose to body surface area would require significantly higher targets for women as well as for smaller patients.
Disclosures
None.
Acknowledgments
The HEMO Study was supported by a grant from the the National Institutes of Health, National Institute of Diabetes and Digestive and Kidney Diseases (NIH/NIDDK). Presented at the American Society of Nephrology Annual Scientific Meeting; October 27 through November 1, 2009; San Diego, California.
Footnotes
Published online ahead of print. Publication date available at www.cjasn.org.
References
- 1.Greene T, Beck GJ, Gassman JJ, Gotch FA, Kusek JW, Levey AS, Levin NW, Schulman G, Eknoyan G: Design and statistical issues of the hemodialysis (HEMO) study. Control Clin Trials 21: 502–525, 2000 [DOI] [PubMed] [Google Scholar]
- 2.Eknoyan G, Beck GJ, Cheung AK, Daugirdas JT, Greene T, Kusek JW, Allon M, Bailey J, Delmez JA, Depner TA, Dwyer JT, Levey AS, Levin NW, Milford E, Ornt DB, Rocco MV, Schulman G, Schwab SJ, Teehan BP, Toto R; Hemodialysis (HEMO) Study Group: Effect of dialysis dose and membrane flux in maintenance hemodialysis. N Engl J Med 347: 2010–2019, 2002 [DOI] [PubMed] [Google Scholar]
- 3.Depner T, Daugirdas J, Greene T, Allon M, Beck G, Chumlea C, Delmez J, Gotch F, Kusek J, Levin N, Macon E, Milford E, Owen W, Star R, Toto R, Eknoyan G; the Hemodialysis Study Group: Dialysis dose and the effect of gender and body size on outcome in the HEMO Study. Kidney Int 65: 1386–1394, 2004 [DOI] [PubMed] [Google Scholar]
- 4.Greene T: What did we learn from the HEMO Study? Implications of secondary analyses. Contrib Nephrol 149: 1–14, 2005 [DOI] [PubMed] [Google Scholar]
- 5.Owen WF, Jr, Chertow GM, Lazarus JM, Lowrie EG: Dose of hemodialysis and survival: Differences by race and gender. JAMA 280: 1764–1768, 1998 [DOI] [PubMed] [Google Scholar]
- 6.Port FK, Wolfe RA, Hulbert-Shearon TE, McCullough KP, Ashby VB, Held PJ: High dialysis dose is associated with lower mortality among women but not among men. Am J Kidney Dis 43: 1014–1023, 2004 [DOI] [PubMed] [Google Scholar]
- 7.Greene T, Daugirdas J, Depner T, Allon M, Beck G, Chumlea C, Delmez J, Gotch F, Kusek JW, Levin N, Owen W, Schulman G, Star R, Toto R, Eknoyan G; Hemodialysis Study Group: Association of achieved dialysis dose with mortality in the hemodialysis study: An example of “dose-targeting bias”. J Am Soc Nephrol 16: 3371–3380, 2005 [DOI] [PubMed] [Google Scholar]
- 8.Lowrie EG, Chertow GM, Lew NL, Lazarus JM, Owen WF: The urea [clearance × dialysis time] product (Kt) as an outcome-based measure of hemodialysis dose. Kidney Int 56: 729–737, 1999 [DOI] [PubMed] [Google Scholar]
- 9.Lowrie EG, Li Z, Ofsthun N, Lazarus JM: The online measurement of hemodialysis dose (Kt): Clinical outcome as a function of body surface area. Kidney Int 68: 1344–1354, 2005 [DOI] [PubMed] [Google Scholar]
- 10.Depner TA: Prescribing Hemodialysis: A Guide to Urea Modeling, Boston, Kluwer Academic Publishers, 1990 [Google Scholar]
- 11.Daugirdas JT, Depner TA, Greene T, Kuhlmann MK, Levin NW, Chertow GM, Rocco MV: Surface-area-normalized Kt/V: A method of rescaling dialysis dose to body surface area-implications for different-size patients by gender. Semin Dial 21: 415–421, 2008 [DOI] [PMC free article] [PubMed] [Google Scholar]
- 12.Daugirdas JT, Schneditz D: Overestimation of hemodialysis dose depends on dialysis efficiency by regional blood flow but not by conventional two pool urea kinetic analysis. ASAIO J 41: M719–M724, 1995 [DOI] [PubMed] [Google Scholar]
- 13.Daugirdas JT, Greene T, Depner TA, Leypoldt J, Gotch F, Schulman G, Star R; Hemodialysis Study Group: Factors that affect postdialysis rebound in serum urea concentration, including the rate of dialysis: Results from the HEMO Study. J Am Soc Nephrol 15: 194–203, 2004 [DOI] [PubMed] [Google Scholar]
- 14.Leypoldt JK: Urea standard Kt/V for assessing dialysis treatment adequacy. Hemodial Int 8: 193–197, 2004 [DOI] [PubMed] [Google Scholar]
- 15.Tattersall JE, DeTakats D, Chamney P, Greenwood RN, Farrington K: The post-hemodialysis rebound: Predicting and quantifying its effect on Kt/V. Kidney Int 50: 2094–2102, 1996 [DOI] [PubMed] [Google Scholar]
- 16.Daugirdas JT, Depner TA, Greene T, Levin NW, Chertow GM, Rocco MV; the Frequent Hemodialysis Network (FHN) Trial Group: Standard Kt/Vurea: A method of calculation that includes the effects of fluid removal and residual kidney clearance. Kidney Int 77: 637–644, 2010 [DOI] [PubMed] [Google Scholar]
- 17.Daugirdas JT, Depner TA, Greene T, Silisteanu P: “Solute-Solver®”: A Web-based tool for modeling urea kinetics for a broad range of hemodialysis schedules in multiple patients. Am J Kidney Dis 54: 798–809, 2009 [DOI] [PubMed] [Google Scholar]
- 18.Watson PE, Watson ID, Batt RD: Total body water volumes for adult males and females estimated from simple anthropometric measurements. Am J Clin Nutr 33: 27–39, 1980 [DOI] [PubMed] [Google Scholar]
- 19.Dubois D, Dubois EF: A formula to estimate the approximate surface area if height and weight be known. Arch Intern Med 17: 863–871, 1916 [Google Scholar]
- 20.Daugirdas JT, Greene T, Depner TA, Chumlea C, Rocco MJ, Chertow GM; Hemodialysis (HEMO) Study Group: Anthropometrically estimated total body water volumes are larger than modeled urea volume in chronic hemodialysis patients: Effects of age, race, and gender. Kidney Int 64: 1108–1119, 2003 [DOI] [PubMed] [Google Scholar]
- 21.Kleinman K, Horton N: SAS and R: Data Management, Statistical Analysis, and Graphics, New York, CRC Press, 2010 [Google Scholar]
- 22.Miskulin DC, Athienites NV, Yan G, Martin AA, Ornt DB, Kusek JW, Meyer KB, Levey AS; Hemodialysis (HEMO) Study Group: Comorbidity assessment using the Index of Coexistent Diseases in a multicenter clinical trial. Kidney Int 60: 1498–1510, 2001 [DOI] [PubMed] [Google Scholar]
- 23.Keshaviah P: The solute removal index: A unified basis for comparing disparate therapies. Perit Dial Int 15: 101–104, 1995 [PubMed] [Google Scholar]
- 24.Gotch FA: The current place of urea kinetic modelling with respect to different dialysis modalities. Nephrol Dial Transplant 13 (Suppl 6): 10–14, 1998 [DOI] [PubMed] [Google Scholar]
- 25.Gotch FA: Evolution of the single-pool urea kinetic model. Semin Dial 14: 252–256, 2001 [DOI] [PubMed] [Google Scholar]
- 26.Suri RS, Garg AX, Chertow GM, Levin NW, Rocco MV, Greene T, Beck GJ, Gassman JJ, Eggers PW, Star RA, Ornt DB, Kliger AS; Frequent Hemodialysis Network Trial Group: Frequent Hemodialysis Network (FHN) randomized trials: Study design. Kidney Int 71: 349–359, 2007 [DOI] [PubMed] [Google Scholar]
- 27.Gotch FA, Sargent JA: A mechanistic analysis of the National Cooperative Dialysis Study (NCDS). Kidney Int 28: 526–534, 1985 [DOI] [PubMed] [Google Scholar]
- 28.Daugirdas JT, Meyer K, Greene T, Butler RS, Poggio ED: Scaling of measured glomerular filtration rate in kidney donor candidates by anthropometric estimates of body surface area, body water, metabolic rate, or liver size. Clin J Am Soc Nephrol 4: 1575–1583, 2009 [DOI] [PMC free article] [PubMed] [Google Scholar]
- 29.Assmann SF, Pocock SJ, Enos LE, Kasten LE: Subgroup analysis and other (mis)uses of baseline data in clinical trials. Lancet 255: 1064–1069, 2000 [DOI] [PubMed] [Google Scholar]
- 30.Hemodialysis Adequacy 2006 Work Group: Clinical practice guidelines for hemodialysis adequacy, update 2006. Am J Kidney Dis 48(Suppl 1): S2–S90, 2006 [DOI] [PubMed] [Google Scholar]
- 31.Daugirdas JT. Appendix 1. In: Handbook of Dialysis, 4th ed., edited by Daugirdas JT, Ing TS, Blake PB, Philadelphia, Lippincott Williams and Wilkins, 2006 [Google Scholar]
- 32.Spalding EM, Chandna SM, Davenport A, Farrington K: Kt/V underestimates the hemodialysis dose in women and small men. Kidney Int 74: 348–355, 2008 [DOI] [PubMed] [Google Scholar]
- 33.Daugirdas JT, Hanna MG, Becker-Cohen R, Langman CB: Dose of dialysis based on body surface area is markedly less in younger children than in older adolescents. Clin J Am Soc Nephrol 5: 821–827, 2010 [DOI] [PMC free article] [PubMed] [Google Scholar]