

Abstract
Objective:
The human leukocyte antigen (HLA) DQB1*0602 allele is closely associated with narcolepsy, a neurologic disorder characterized by excessive daytime sleepiness, fragmented sleep, and shortened REM sleep latency. We evaluated whether DQB1*0602 was a novel marker of interindividual differences by determining its relationship to sleep homeostatic, sleepiness, and cognitive responses to baseline and chronic partial sleep deprivation (PSD) conditions.
Methods:
Ninety-two DQB1*0602-negative and 37 DQB1*0602-positive healthy adults participated in a protocol of 2 baseline 10 hours time in bed (TIB) nights followed by 5 consecutive 4 hours TIB nights. DQB1*0602 allelic frequencies did not differ significantly between Caucasians and African Americans.
Results:
During baseline, although DQB1*0602-positive subjects were subjectively sleepier and more fatigued, they showed greater sleep fragmentation, and decreased sleep homeostatic pressure and differentially sharper declines during the night (measured by non-REM EEG slow-wave energy [SWE]). During PSD, DQB1*0602-positive subjects were sleepier and showed more fragmented sleep, despite SWE elevation comparable to negative subjects. Moreover, they showed differentially greater REM sleep latency reductions and smaller stage 2 reductions, along with differentially greater increases in fatigue. Both groups demonstrated comparable cumulative decreases in cognitive performance.
Conclusions:
DQB1*0602 positivity in a healthy population may represent a continuum of some sleep–wake features of narcolepsy. DQB1*0602 was associated with interindividual differences in sleep homeostasis, physiologic sleep, sleepiness, and fatigue—but not in cognitive measures—during baseline and chronic PSD. Thus, DQB1*0602 may represent a genetic biomarker for predicting such individual differences in basal and sleep loss conditions.
GLOSSARY
- ANOVA
= analysis of variance;
- COWAT
= Controlled Oral Word Association Test;
- DS
= Digit Span;
- DSST
= Digit Symbol Substitution Task;
- HLA
= human leukocyte antigen;
- KSS
= Karolinska Sleepiness Scale;
- MWT
= Maintenance of Wakefulness Test;
- POMS
= Profile of Mood States;
- PSD
= partial sleep deprivation;
- PSG
= polysomnography;
- PVT
= Psychomotor Vigilance Task;
- SOL
= sleep onset latency;
- SR
= sleep deprivation/restriction;
- SWA
= slow-wave activity;
- SWE
= slow-wave energy;
- TIB
= time in bed;
- TOL
= Tower of London;
- TSD
= total sleep deprivation;
- VAS
= visual analog scale;
- WASO
= wake after sleep onset.
Subjects undergoing total sleep deprivation (TSD), or chronic partial sleep deprivation (PSD) whereby sleep is restricted nightly to 3–7 hours, show robust interindividual differences in response to the same sleep loss conditions.1–6
Genetic polymorphisms may underlie these interindividual differences.7,8 The catechol-O-methyltransferase Val158Met polymorphism predicted interindividual differences in α oscillations.9 The adenosine deaminase 22G→A polymorphism contributed to interindividual variability in baseline slow-wave sleep and non-REM slow-wave activity (SWA), and the adenosine A2A receptor c.1083T>C polymorphism related to baseline sleep and wake EEG differences.10 During TSD, the PERIOD3 VNTR polymorphism predicted slow-wave energy (SWE) and executive performance differences,11 but during PSD, it predicted SWE, but not neurobehavioral differences.6
Although DQB1*0602 positivity closely relates to narcolepsy, a disorder characterized by excessive daytime sleepiness, fragmented nighttime sleep, and shortened REM sleep latency, it is neither necessary nor sufficient for its development.12,13 DQB1*0602-negative individuals can develop narcolepsy—although rarely with hypocretin deficiency—and 12%–38% of DQB1*0602-positive carriers are healthy sleepers.12,13
In one large study, DQB1*0602-positive healthy sleepers showed shorter nighttime REM sleep latency, greater sleep continuity, and more REM sleep, but no daytime sleepiness differences.12 DQB1*0602 positivity also associated with more sleep-onset REM sleep periods and greater REM sleep duration during naps.14 DQB1*0602-positive subjects displayed subclinical presentations of sleep features reminiscent of narcolepsy. SWE/SWA and neurobehavioral performance were not measured.
We evaluated whether DQB1*0602 was a novel biomarker of differential vulnerability to homeostatic, sleepiness, and neurobehavioral deficits during chronic PSD—a condition experienced by millions and associated with serious health consequences.15
METHODS
Participants.
A total of 129 subjects participated in 1 of 2 PSD experiments. Following protocol completion, subjects were genotyped for the DQB1*0602 allele. Because this was a retrospective analysis, DQB1*0602-positive and negative subjects were not matched. DQB1*0602-positive and negative percentages (table 1) approximated other studies.13,14,16
Table 1 Characteristics of DQB1*0602-negative (−) and DQB1*0602-positive (+) subjects, mean ± SD
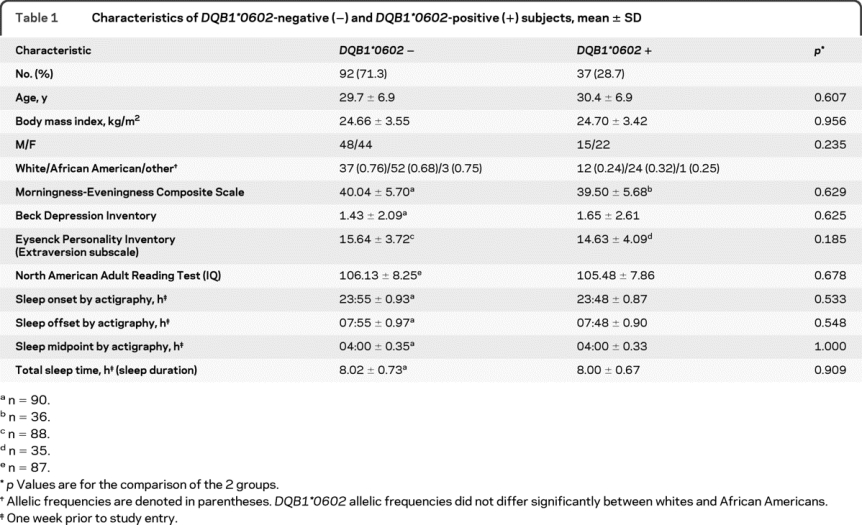
Subjects met the following inclusionary criteria: age between 22 and 45 years; physically and psychologically healthy, assessed by physical examination and history; no clinically significant blood chemistry abnormalities; drug-free urine samples; good habitual sleep, between 6.5 and 8.5 hours daily duration with regular bedtimes, and wake-up times between 6:00 and 9:00 (verified by sleep logs and wrist actigraphy for ≥1 week before study entry); absence of extreme morningness/eveningnesse1; absence of sleep or circadian disorders, assessed by questionnairee2 and polysomnography; absence of psychiatric illness or adverse neuropsychiatric reaction to sleep deprivation; no alcohol or drug abuse history; and no current use of medical or drug treatments (excluding oral contraceptives).
Standard protocol approvals, registrations, and patient consents.
The protocols were approved by the Institutional Review Board of the University of Pennsylvania. For all subjects, written informed consent was obtained according to the principles expressed in the Declaration of Helsinki prior to entry; all subjects received compensation for participation.
Experimental design.
Subjects participated in an 11- or 16-day experiment in the Sleep and Chronobiology Laboratory. Only data from the first 7 nights of the protocols—which were procedurally identical—were analyzed. On the 2 baseline nights, subjects received 10 hours time in bed (TIB) from 22:00–8:00; on the subsequent 5 nights, subjects received 4 hours TIB (4:00–8:00). Some experimental data from these subjects were published previously.6
During the protocol, laboratory conditions and scheduled activities were highly controlled. Ambient light remained at <50 lux during wakefulness, and <1 lux (darkness) during sleep. Temperature was maintained at 22 ± 1 °C. Subjects were continuously monitored by trained staff. Between performance bouts, they were restricted from strenuous activities or having visitors, but could read, play games, watch movies, and interact with staff to help remain awake. Subjects received 3 standardized meals/day and an optional evening snack. Caffeine, turkey, bananas, alcohol, or tobacco were prohibited.
Neurobehavioral assessments.
Subjects performed a computerized neurobehavioral test battery every 2 hours during wakefulness, which included the following: the Karolinska Sleepiness Scale (KSS),e3 a Likert-type subjective sleepiness scale; a visual analog scale of fatigue (VAS)e4 anchored by “fresh as a daisy” and “tired to death”; the Profile of Mood States (POMS),e5 a scale assessing transient affective states; the Digit Symbol Substitution Task (DSST),e6 a cognitive throughput task; the Digit Span (DS) task,e6 a working memory storage capacity test, given in forward and backward versions and summed as a total number correct measure; and the Psychomotor Vigilance Task (PVT), a sustained attention test utilizing reaction times as a behavioral alertness assay.17 Subjects remained seated throughout testing, were behaviorally monitored, and were instructed to perform to the best of their ability and use compensatory effort to maintain performance. Baseline values were derived from the second baseline day (B2). Daily values for each performance task were calculated by averaging scores from all test bouts that day.
Other measurements.
Before the study, subjects completed questionnaires on demographic, sleep–wake and circadian-related variables, and psychosocial/personality traits, including the Morningness-Eveningness Composite Scale,e1 the Beck Depression Inventory,e7 the Eysenck Personality Inventory,e8 and the North American Adult Reading Test.e9 At partial sleep deprivation/restriction night 5 (SR5), 4 executive function tests were administered: the Hayling and Brixton tests,e10 the Controlled Oral Word Association Test (COWAT),e11 and the Tower of London (TOL).e12 In the 11-day protocol, a modified Maintenance of Wakefulness Test (MWT15,18)—a physiologic measure of the ability to resist sleep—was administered at B2 and SR5 (a single trial was conducted between 14:30 and 16:00 hours) using a standard recording montage. Before each trial, the lights were dimmed to <10 lux and subjects were instructed to “keep your eyes open and try not to fall asleep.” Each trial was terminated at the first microsleep (10 seconds of theta activity19) determined by the C3/A2 derivation or at 30 minutes if sleep onset did not occur. MWT scores represented either the time (minutes) to microsleep initiation or 30 minutes (if a microsleep did not occur).
Sleep architecture.
Polysomnography.
The polysomnographic (PSG) montage included frontal (Fz), central (C3), and occipital (O2) EEG, bilateral EOG, submental EMG, and ECG. Data were recorded from 22:00 to 08:00 hours on B2, and from 04:00 to 08:00 hours on partial sleep deprivation/restriction night 1 (SR1) and SR5. Records were visually scored in 30-second epochs using standard scoring criteria20 by a trained scorer blind to DQB1*0602 typing.
Non-REM EEG SWE and SWA.
After artifact rejection, spectral analysis of the sleep EEG derivations (C3/A2, Fz/A1, O2/A1) was performed with Fast Fourier Transform in 5-second bins. Power spectra were averaged across 30-second epochs. For each night, SWE in the delta band (0.5–4.5 Hz) was totaled over all epochs of non-REM (visually scored stages 2–4) sleep. Power in the delta band (SWA) was calculated by dividing SWE by the number of non-REM sleep epochs. For B2, absolute values were determined for each hour of sleep for SWE and SWA; for SR1 and SR5, SWE and SWA were normalized by calculating the percent of the corresponding B2 hour.
Genotyping.
Genomic DNA was extracted from whole blood using Qiagen's QIAamp DNA Blood Mini Kit (Catalog no. 51106). The presence or absence of DQB1*0602 and not complete HLA-DQB1 typing was determined using amplification techniques as previously described.21 DQB1*0602 typing for each subject could be unambiguously determined, although this typing method does not distinguish extremely rare alleles similar to DQB1*0602 (frequency <0.5%).
Statistical analyses.
Mixed-model analyses of variance (ANOVAs), with day or hour as the within-subjects (repeated measures) factor and genotype as the between-group factor, were used to analyze MWT, PSG, SWA/SWE, PVT, KSS, VAS, POMS, DSST, and DS data. Greenhouse–Geisser corrections were applied to all within-subjects effects. One-way ANOVAs were used to analyze demographic and prestudy measures, PSG, MWT, cognitive, executive function, and sleep measures during baseline and PSD. Post hoc comparisons using Bonferroni-adjusted probabilities examined significant group differences. SPSS version 15.0 (SPSS Inc., Chicago, IL) was used for statistical analyses; p ≤ 0.05 was significant.
RESULTS
Demographic and prestudy variables.
DQB1*0602 subjects did not differ significantly in age, body mass index, or sex (table 1). DQB1*0602 frequencies also did not differ between whites and African Americans (25% vs 32%). Moreover, the groups did not show differences in IQ,e9 psychosocial/personality traits,e7,e8 prestudy sleep variables, or circadian phase markers (Morningness-Eveningness chronotypee1 and sleep midpoint).
Sleep physiology.
Non-REM EEG SWE and SWA.
Across B2, DQB1*0602-positive subjects showed less SWE in the C3 channel (figure 1A; F1,90 = 6.50, p = 0.012), but no differences in the Fz (figure 1C; F1,96 = 3.21, p = 0.077) or O2 EEG derivations (figure 1F; F1,99 = 0.34, p = 0.560). The DQB1*0602 groups did not differ in SWA in the C3 (figure 1B; F1,90 = 3.36, p = 0.070), Fz (figure 1D; F1,96 = 2.74, p = 0.101), or O2 channels (figure 1F; F1,99 = 0.58, p = 0.449). SWE (C3: F3.22,290.17 = 104.65, p < 0.0001; Fz: F2.44,234.48 = 108.63, p < 0.0001; O2: F1.98,195.98 = 52.27, p < 0.0001), and SWA (C3: F2.89,260.28 = 90.04, p < 0.0001; Fz: F1.94,185.82 = 69.39, p < 0.0001; O2: F1.86,184.02 = 43.34, p < 0.0001) dissipated across B2 in all channels. Moreover, DQB1*0602-positive subjects demonstrated sharper SWE and SWA declines during the first few hours of sleep in the O2 (SWE: F1.98,195.98 = 3.48, p = 0.033; SWA: F1.86,184.02 = 3.19, p = 0.047), but not in the C3 (SWE: F3.22,290.17 = 1.58, p = 0.191; F2.89,260.28 = 1.83, p = 0.144) or Fz derivations (SWE: F2.44,234.48 = 0.54, p = 0.622; SWA: F1.94,185.82 = 0.49, p = 0.607).

Figure 1 Hourly slow-wave energy and slow-wave activity during baseline for the DQB1*0602 groups
Mean (±SEM) hourly slow-wave energy (SWE) and slow-wave activity (SWA) derived from the C3 (A, B), Fz (C, D), or O2 (E, F) channels during baseline for DQB1*0602-negative subjects (open circles) and DQB1*0602-positive subjects (closed circles). SWE derived from C3 was lower in DQB1*0602-positive subjects (denoted by **, p < 0.05); SWA derived from C3 and SWE and SWA derived from the Fz channel showed similar trends. As expected, SWE and SWA showed a typical pattern of dissipation across the baseline night in all 3 channels for both groups (denoted by *, p < 0.05); moreover, DQB1*0602-positive subjects demonstrated sharper declines in sleep pressure derived from the O2 channel during the first few hours of the night than DQB1*0602-negative subjects (denoted by †, p < 0.05). In some records, EEG signal quality was insufficient or contained too much artifact for reliable power spectral analysis. Thus, the final sample sizes were as follows: for C3, DQB1*0602-negative (n = 68) and -positive (n = 24) subjects; for Fz, DQB1*0602-negative (n = 70) and -positive (n = 28) subjects; for O2, DQB1*0602-negative (n = 74) and -positive (n = 27) subjects.
SWE and SWA displayed acute responses to PSD in both groups—evidenced by percentage increases above the corresponding B2 hour in all channels. There were changes across PSD derived from C3 and Fz for SWE% baseline (C3: F1.86,182.34 = 5.03, p = 0.009; Fz: F2.27,217.91 = 7.26, p = 0.001; figure 2, A and C) and SWA% baseline (C3: F2.06,202.03 = 5.82, p = 0.003; Fz: F1.77,171.58 = 5.26, p = 0.008; figure 2, B and D), but not from the O2 channel (SWE% baseline: F2.25,216.41 = 0.69, p = 0.520; SWA% baseline: F2.12,201.28 = 0.81, p = 0.453; figure 2, E and F). These measures showed no differential changes across PSD in the C3 (SWE% baseline: F1.86,182.34 = 0.71, p = 0.484; SWA% baseline: F2.06,202.03 = 1.05, p = 0.354; figure 2, A and B), Fz (SWE% baseline: F2.27,217.91 = 0.83, p = 0.451; SWA% baseline: F1.77,171.58 = 0.63, p = 0.517; figure 2, C and D), or O2 derivations (SWE% baseline: F2.25,216.41 = 1.88, p = 0.150; SWA% baseline: F2.12,201.28 = 0.72, p = 0.496; figure 2, E and F). The groups did not differ in SWE% baseline (F1,98 = 1.73, p = 0.191) or SWA% baseline (F1,98 = 0.14, p = 0.708) from the C3 (figure 2, A and B), Fz (SWE% baseline: F1,96 = 2.71, p = 0.103; SWA% baseline: F1,97 = 2.51, p = 0.116; figure 2, C and D) or O2 channels (SWE% baseline: F1,96 = 0.30, p = 0.587; SWA% baseline: F1,95 = 1.80, p = 0.183; figure 2, E and F).

Figure 2 Slow-wave energy and slow-wave activity during chronic partial sleep deprivation for the DQB1*0602 groups
Mean (±SEM) hourly slow-wave energy (SWE) and slow-wave activity (SWA) as a percentage of baseline at the same corresponding hour derived from the C3 (A, B), Fz (C, D), or O2 (E, F) channels at partial sleep deprivation/restriction night 1 (SR1) and partial sleep deprivation/restriction night 5 (SR5) for hour 1 (H1) and hour 2 (H2) for DQB1*0602-negative subjects (open circles) and DQB1*0602-positive subjects (closed circles). SWE and SWA increased from SR1 to SR5 for the C3 and Fz channels (denoted by *, p < 0.05). There were no group differences or differential changes across nights. In some records, EEG signal quality was insufficient or contained too much artifact for reliable power spectral analysis. Thus, the final sample sizes were as follows: for SR1 and SR5 C3, DQB1*0602-negative (n = 72) and -positive (n = 28) subjects; for SR1 and SR5 Fz, DQB1*0602-negative (n = 72) and -positive (n = 27) subjects; for SR1 and SR5 O2, DQB1*0602-negative (n = 72) and -positive (n = 26) subjects.
Polysomnography.
Across B2, SR1, and SR5, DQB1*0602-positive subjects showed significantly more awakenings and stage 2 sleep, less SWS (particularly stage 3 sleep), and a trend toward later sleep onset latency (SOL) (genotype effect across nights; table 2 footnotes). At B2, they had significantly less stage 3 sleep and a tendency for a longer REM sleep latency. At SR1, DQB1*0602-positive subjects displayed more disrupted sleep, with significantly less stage 3 and more stage 2 sleep, and a tendency for more nighttime awakenings. At SR5, disrupted sleep remained apparent in these subjects: they showed significantly more awakenings and wake after sleep onset (WASO), and less stage 3 and more stage 2 sleep (table 2).
Table 2 Polysomnographic sleep measures during B2, SR1, and SR5 for DQB1*0602-negative (−) and DQB1*0602-positive (+) subjects, mean ± SD
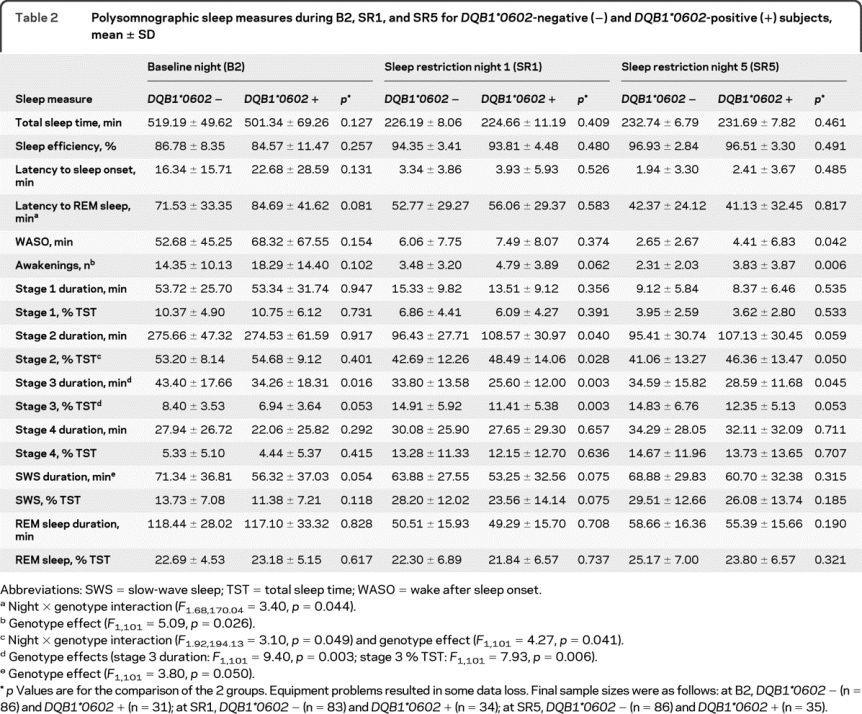
The groups showed differential PSG responses to PSD (night × genotype effect; table 2 footnotes). DQB1*0602-positive subjects showed greater REM sleep latency and smaller stage 2 reductions. Both groups displayed significant responses consistent with sleep loss and homeostatic drive increases: sleep efficiency and SWS increased, while TST, SOL, REM sleep latency and duration, WASO, and stages 1 and 2 sleep decreased.
Subjective sleepiness and fatigue.
PSD produced increases in KSSe3 sleepiness (figure 3A; F2.94,373.09 = 122.63, p < 0.0001) and VASe4 fatigue scores (figure 3B; F2.39,303.83 = 87.36, p < 0.0001) for both groups across days. DQB1*0602-positive subjects had greater sleepiness (F1,127 = 16.77, p < 0.0001) and fatigue (F1,127 = 7.66, p = 0.006) ratings across days, though they showed no differential responses to PSD (KSS: F2.94,373.09 = 0.83, p = 0.475; VAS: F2.39,303.83 = 0.61, p = 0.574). They were more sleepy and fatigued at B2 and across PSD (table e-1 on the Neurology® Web site at www.neurology.org). Similarly, DQB1*0602-positive subjects rated themselves as more fatigued on an unrelated scale (POMS-Fatiguee5) across days (F1,127 = 5.94, p = 0.016), with differentially larger sleep loss responses (F2.17,276.13 = 3.88, p = 0.019; figure 3C). PSD increased POMS-Fatigue ratings across days in both groups (F2.17,276.13 = 84.27, p < 0.0001). POMS-Fatigue scores did not differ during baseline, though DQB1*0602-positive subjects had higher scores during chronic PSD (table e-1).

Figure 3 Neurobehavioral performance during baseline and chronic partial sleep deprivation for the DQB1*0602 groups
Mean (±SEM) scores per trial on the (A) Karolinska Sleepiness Scale (KSS), (B) “fresh-tired” visual analog scale (VAS), (C) Profile of Mood States (POMS)-Fatigue scale, and (D) Psychomotor Vigilance Task (PVT) lapses (>500 msec reaction times) per trial, (E) total number correct per trial on the Digit Symbol Substitution Task (DSST) and on the (F) Digit Span (DS) task, during baseline (B) and each partial sleep deprivation/restriction night (SR1–SR5) for DQB1*0602-negative subjects (open circles) and DQB1*0602-positive subjects (closed circles). Overall, DQB1*0602-positive subjects were more sleepy and fatigued as indicated by higher KSS, VAS, and POMS-Fatigue scores (denoted by **, p < 0.05). These scores all increased across chronic PSD (denoted by *, p < 0.05). Notably, the DQB1*0602-positive subjects also showed differentially larger increases in fatigue across chronic PSD than DQB1*0602-negative subjects (Panel C; denoted by †, p < 0.05). By contrast, although both groups showed increased PVT lapses (denoted by *, p < 0.05) and intersubject variability across chronic PSD, there were no differential responses in lapses nor did one group show more lapses at baseline or during chronic PSD. DSST scores failed to show significant changes across chronic PSD, or differential changes across days or group differences. DS total correct scores declined across chronic PSD (denoted by *, p < 0.05), but did not show significant group differences or differential changes.
Physiologic sleepiness.
Contrasting subjective sleepiness scores, MWT scores15,18 did not differ between groups (F1,88 = 0.76, p = 0.385) or show differential changes to PSD (F1,88 = 0.72, p = 0.398), although both groups were less able to resist sleep following sleep loss (F1,88 = 41.93, p < 0.0001). The groups did not differ at baseline or SR5 (table e-1).
Cognitive performance and executive functioning.
PSD induced significant cognitive performance deficits across days as demonstrated by increases in PVT17 lapses (>500 msec reaction times) and in variability for both groups across PSD (figure 3D). Although both groups increased lapses across days (F2.44,310.38 = 71.75, p < 0.0001), there were no differential responses in lapses (F2.44,310.29 = 1.45, p = 0.234) or group differences across days (F1,127 = 0.03, p = 0.860). Moreover, lapses and other PVT measures—errors, fastest 10% and median reaction times, response speed—did not differ significantly between groups during B2 or PSD (table e-1).
The groups showed no differential changes in DSSTe6 performance across PSD (F2.92,371.02 = 0.91, p = 0.433) nor did scores change across days (F2.92,371.02 = 1.55, p = 0.203) or differ between groups across days (F1,127 = 0.000, p = 0.986; figure 3E). There were no B2 or PSD differences in DSST performance (table e-1). Similarly, there were no differential changes on DSe6 total performance across PSD (F2.79,353.91 = 0.23, p = 0.863) or group differences across days (F1,127 = 0.55, p = 0.460) although scores changed across days (F2.79,353.91 = 3.69, p = 0.014; figure 3F). Moreover, the groups did not differ on DS performance during B2 or PSD (table e-1).
The Hayling,e10 Brixton,e10 COWAT,e11 and TOLe12—executive function tests measured at SR5—showed no group differences (figures e-1 and e-2).
DISCUSSION
DQB1*0602-positive subjects showed decreased sleep homeostatic pressure with differentially steeper declines, and greater sleepiness and fatigue during baseline. During PSD, positive subjects displayed SWE elevation comparable to negative subjects, despite higher sleepiness and fatigue. DQB1*0602-positive subjects also had more fragmented sleep during baseline and PSD and showed differentially greater REM sleep latency reductions and smaller stage 2 reductions, along with differentially greater increases in fatigue. Cumulative decreases in cognitive performance were comparable between groups during PSD. Thus, DQB1*0602 associated with interindividual differences in sleep homeostasis, physiologic sleep, sleepiness, and fatigue, but not cognitive responses, during baseline and PSD. DQB1*0602 may be a genetic marker for predicting such individual differences; moreover, its positivity in healthy subjects may represent a continuum with narcoleptic sleep–wake features.
Both groups showed greater physiologic sleepiness, sleep homeostasis, and self-rated sleepiness and fatigue, and poorer performance on the DS and PVT, across PSD. Thus, PSD produced substantial changes in these measures characteristic of cumulative sleep loss, thereby validating our phenotype.1,4,6,8,22–25
DQB1*0602-positive subjects showed greater sleepiness and fatigue during baseline and PSD. Our results concur with a study that found that positive subjects with insomnia had poorer perceptions of sleep quality and degree of restfulness.26 Such symptoms may be part of a subclinical, but not pathologic continuum of daytime sleepiness (the most debilitating symptom of narcolepsy and a requirement for its diagnosis27), and may have utility for predicting responses in DQB1*0602 carriers in work or operational settings.
Under basal, fully rested homeostatic pressure conditions, DQB1*0602-positive subjects had lower SWE and SWA—putative markers of sleep homeostasis. By contrast, narcoleptic subjects have comparable or higher baseline SWA than controls.28–30 Our baseline differences were not sustained during PSD, indicating that positive subjects possess fully intact, efficient homeostatic responses to sleep loss. Equivalent responses have been reported in DQB1*0602-positive narcoleptic subjects,28,29 and in another study, relatively greater SWA responses were observed in narcoleptic subjects than controls30 (DQB1*0602 typing was not performed). Different genes may modulate basal vs evoked homeostatic responses in healthy sleepers; therefore, other genetic markers may influence differential vulnerability in SWA/SWE responses to PSD.
DQB1*0602-positive subjects showed more fragmented sleep during baseline and PSD—as indicated by more nocturnal awakenings, WASO, and stage 2 sleep, and less SWS, but did not differ in TST or REM sleep latency or duration. Our findings concur with those demonstrating that DQB1*0602-positive subjects with insomnia had more nighttime awakenings.26 Moreover, DQB1*0602-positive narcoleptic subjects showed more disrupted nighttime sleep (reduced SE, increased WASO, awakenings, and stage 1 sleep), less stage 2, shorter nocturnal REM sleep and SOL, more REM sleep, and more daytime objective sleepiness abnormalities (decreased SOL and increased number of sleep-onset REM sleep periods on the MWT and MSLT) than DQB1*0602-negative narcoleptic subjects or controls.27,28,30–33 DQB1*0602 positivity may relate to common sleep changes such as disturbance of sleep maintenance mechanisms found in healthy subjects and narcoleptic subjects.
Our data contrast those from a study that found that DQB1*0602-positive subjects showed shorter REM sleep latency and greater sleep continuity (e.g., better SE, decreased stage 1 sleep and WASO), and no differences in subjective or physiologic sleepiness measures (Stanford and Epworth Sleepiness Scales, MSLT).12 Study design differences might explain these contrasting results. While the aforementioned study employed a large sample (n = 525), because of its epidemiologic design, it did not utilize adaptation/saturation nights, and did not impose prestudy regularized sleep–wake cycles—factors which significantly affect PSG and sleepiness measures.12 Indeed, the reported REM sleep abnormalities12 may be eliminated when DQB1*0602-positive subjects are well-rested during baseline (this study), and may be replaced by increased sleepiness and sleep fragmentation; as such, our results highlight the importance of insuring well-rested conditions in clinical PSG studies to eliminate possible effects on outcome measures. Further studies are needed to resolve these discrepancies.
Since narcolepsy associates with genes other than DQB1*0602,13 including HLA-DR2,34 T-cell receptor α locus,21 and tumor necrosis factor–α,35 it is not surprising that DQB1*0602-positive healthy subjects do not show all the same deficits—even to a lesser degree—than narcoleptic subjects. DQB1*0602 may be involved in common features shared between positive normal sleepers and narcoleptic subjects, whereas other genes may influence disparate features. Alternatively, sleep variables may be mediated by individuals' immune and infectious status, which may differ between positive and negative subjects. HLA alleles modulate susceptibility to many infectious and autoimmune diseases.36
DQB1*0602 does not mediate individual differences in cognitive performance. These findings sharply contrast sleep homeostatic, physiologic sleep, sleepiness, and fatigue differences, and concur with findings that homeostatic sleep responses to deprivation are not reflected in waking neurobehavioral or cognitive responses.1,6,37,38 Which genes mediate individual differences in cognitive performance during PSD remains unknown.
Despite our relatively large sample size compared to other genetic studies using sleep deprivation protocols,9,11,38,39 our results should be considered preliminary. As is true for the aforementioned studies, our findings should be replicated in a separate sample using an identical protocol—replication is critical for validation and avoiding false-positives in candidate gene studies.40
DQB1*0602—closely linked to the neurologic disorder narcolepsy—predicted interindividual differences in sleep homeostasis, physiologic sleep, and sleepiness and fatigue in healthy adults. DQB1*0602, therefore, may be a genetic marker for determining responses in the general population to basal conditions and chronic PSD—a condition associated with significant health consequences and experienced worldwide by millions of individuals frequently due to work and social obligations.
AUTHOR CONTRIBUTIONS
Statistical analysis was conducted by Dr. Namni Goel.
DISCLOSURE
Dr. Goel serves on the editorial boards of Sleep, Chronobiology International, and the Journal of Circadian Rhythms; serves as President and on the Board of Directors of the Society for Light Treatment and Biological Rhythms; has received funding for travel from the Bradley Hospital, the American Association of Anatomists, and the Deutsche Lichttechnische Gesellschaft e.V.; has served as a conflict of interest monitor for a privately funded study conducted at Thomas Jefferson University and as a scientific consultant for a federally funded study conducted at Thomas Jefferson University; and receives research support from the Institute for Translational Medicine and Therapeutics' (ITMAT) Transdisciplinary Program in Translational Medicine and Therapeutics. Dr. Banks serves on the editorial board of Sleep and has received institutional research support from the University of South Australia and through collaboration with the Sleep and Performance Center, Washington State University. Dr. Mignot serves on the editorial boards of PLoS Biology, Biological Psychiatry, and Sleep Medicine, and as a Deputy Editor for Sleep; serves on scientific advisory boards for Jazz Pharmaceuticals, Actelion Pharmaceuticals Ltd., Roche, Cephalon, Inc., Eli Lilly and Company, the Kleine-Levin Syndrome Foundation, the National Academy of Sciences/Institute of Medicine (NAS/IOM), the NIH/NIMH, the Restless Legs Syndrome Foundation, the Klarman Family Foundation, and the American Academy of Sleep Medicine; has received speaker honoraria from Roche; has served as an expert witness in a medico-legal case; has a patent through Stanford University re: narcolepsy; receives royalties from the publication of Narcolepsy and Hypersomnia (Informa Healthcare, 2007); has served as a consultant for Jazz Pharmaceuticals; receives research support from Jazz Pharmaceuticals, the NIH (NS-23724 [PI]), and the Howard Hughes Medical Institute; and owns stock in ResMed. Dr. Dinges serves as Editor-in-Chief of Sleep; serves on the scientific advisory board for Mars, Inc., and has served as a consultant for Sanofi-Aventis, Merck and Company, Eli Lilly and Company, Somaxon Pharmaceuticals, Inc., and Actelion Pharmaceuticals Ltd; and receives/has received research support from Merck and Company, the NIH (NR004281 [PI] and CTRC UL1RR024134 [PI]), NASA, the National Space Biomedical Research Institute, the Air Force Office of Scientific Research, and the Federal Aviation Administration.
Supplementary Material
Address correspondence and reprint requests to Dr. Namni Goel, Division of Sleep and Chronobiology, Unit for Experimental Psychiatry, Department of Psychiatry, University of Pennsylvania School of Medicine, 1013 Blockley Hall, 423 Guardian Drive, Philadelphia, PA 19104-6021 goel@mail.med.upenn.edu
Editorial, page 1492
Supplemental data at www.neurology.org
References e1–e12 are available on the Neurology Web site at www.neurology.org.
Study funding: Supported by the National Space Biomedical Research Institute through NASA (NCC 9-58), NIH NR004281, and CTRC UL1RR024134 (to D.F.D.), the NIH (NS-23724 to E.M.), the Institute for Translational Medicine and Therapeutics' (ITMAT) Transdisciplinary Program in Translational Medicine and Therapeutics (to N.G.), and the National Center for Research Resources (UL1RR024134). E.M. is a Howard Hughes Medical Institute Investigator.
Disclosure: Author disclosures are provided at the end of the article.
The content is solely the responsibility of the authors and does not necessarily represent the official views of the National Center for Research Resources or the National Institutes of Health.
Received December 29, 2009. Accepted in final form June 14, 2010.
REFERENCES
- 1.Van Dongen HPA, Maislin G, Mullington JM, Dinges DF. The cumulative cost of additional wakefulness: dose-response effects on neurobehavioral functions and sleep physiology from chronic sleep restriction and total sleep deprivation. Sleep 2003;26:117–126. [DOI] [PubMed] [Google Scholar]
- 2.Van Dongen HP, Baynard MD, Maislin G, Dinges DF. Systematic interindividual differences in neurobehavioral impairment from sleep loss: evidence of trait-like differential vulnerability. Sleep 2004;27:423–433. [PubMed] [Google Scholar]
- 3.Van Dongen HP, Maislin G, Dinges DF. Dealing with interindividual differences in the temporal dynamics of fatigue and performance: importance and techniques. Aviat Space Environ Med 2004;75:A147–154. [PubMed] [Google Scholar]
- 4.Van Dongen HPA, Dinges DF. Sleep, circadian rhythms, and psychomotor vigilance performance. Clin Sports Med 2005;24:237–249. [DOI] [PubMed] [Google Scholar]
- 5.Leproult R, Colecchia EF, Berardi AM, Stickgold R, Kosslyn SM, Van Cauter E. Individual differences in subjective and objective alertness during sleep deprivation are stable and unrelated. Am J Physiol Regulat Integr Comp Physiol 2003;284:R280–R290. [DOI] [PubMed] [Google Scholar]
- 6.Goel N, Banks S, Mignot E, Dinges DF. PER3 polymorphism predicts cumulative sleep homeostatic but not neurobehavioral changes to chronic sleep restriction. PLoS ONE 2009;4:e5874. [DOI] [PMC free article] [PubMed] [Google Scholar]
- 7.Landolt HP. Genotype-dependent differences in sleep, vigilance, and response to stimulants. Curr Pharm Des 2008;14:3396–3407. [DOI] [PubMed] [Google Scholar]
- 8.Goel N, Rao H, Durmer JS, Dinges DF. Neurocognitive consequences of sleep deprivation. Semin Neurol 2009;29:320–339. [DOI] [PMC free article] [PubMed] [Google Scholar]
- 9.Bodenmann S, Rusterholz T, Dürr R, et al. The functional Val158Met polymorphism of COMT predicts interindividual differences in brain α oscillations in young men. J Neurosci 2009;29:10855–10862. [DOI] [PMC free article] [PubMed] [Google Scholar]
- 10.Rétey JV, Adam M, Honegger E, et al. A functional genetic variation of adenosine deaminase affects the duration and intensity of deep sleep in humans. Proc Natl Acad Sci USA 2005;102:15676–15681. [DOI] [PMC free article] [PubMed] [Google Scholar]
- 11.Viola AU, Archer SN, James LM, et al. PER3 polymorphism predicts sleep structure and waking performance. Curr Biol 2007;17:613–618. [DOI] [PubMed] [Google Scholar]
- 12.Mignot E, Young T, Lin L, Finn L. Nocturnal sleep and daytime sleepiness in normal subjects with HLA-DQB1*0602. Sleep 1999;22:347–352. [PubMed] [Google Scholar]
- 13.Dauvilliers Y, Tafti M. Molecular genetics and treatment of narcolepsy. Ann Med 2006;38:252–262. [DOI] [PubMed] [Google Scholar]
- 14.Mignot E, Lin L, Finn L, et al. Correlates of sleep-onset REM periods during the Multiple Sleep Latency Test in community adults. Brain 2006;129:1609–1623. [DOI] [PubMed] [Google Scholar]
- 15.Banks S, Dinges DF. Behavioral and physiological consequences of sleep restriction. J Clin Sleep Med 2007;3:519–528. [PMC free article] [PubMed] [Google Scholar]
- 16.Mignot E, Hayduk R, Black J, Grumet FC, Guilleminault C. HLA DQB1*0602 is associated with cataplexy in 509 narcoleptic patients. Sleep 1997;20:1012–1020. [PubMed] [Google Scholar]
- 17.Lim J, Dinges DF. Sleep deprivation and vigilant attention. Ann NY Acad Sci 2008;1129:305–322. [DOI] [PubMed] [Google Scholar]
- 18.Mitler MM, Gujavarty KS, Browman CP. Maintenance of wakefulness test: a polysomnographic technique for evaluation treatment efficacy in patients with excessive somnolence. Electroencephalogr Clin Neurophysiol 1982;53:658–661. [DOI] [PMC free article] [PubMed] [Google Scholar]
- 19.Banks S, Barnes M, Tarquinio N, Pierce RJ, Lack LC, McEvoy RD. The maintenance of wakefulness test in normal healthy subjects. Sleep 2004;27:799–802. [PubMed] [Google Scholar]
- 20.Rechtschaffen A, Kales AA. Manual of Standardized Terminology, Techniques and Scoring System for Sleep Stages of Human Subjects. Los Angeles: UCLA Brain Information Service; 1968. [Google Scholar]
- 21.Hallmayer J, Faraco J, Lin L, et al. Narcolepsy is strongly associated with the T-cell receptor alpha locus. Nat Genet 2009;41:708–711. [DOI] [PMC free article] [PubMed] [Google Scholar]
- 22.Dinges DF, Pack F, Williams K, et al. Cumulative sleepiness, mood disturbance, and psychomotor vigilance performance decrements during a week of sleep restricted to 4–5 hours per night. Sleep 1997;20:267–277. [PubMed] [Google Scholar]
- 23.Drake CL, Roehrs TA, Burduvali E, Bonahoom A, Rosekind M, Roth T. Effects of rapid versus slow accumulation of eight hours of sleep loss. Psychophysiology 2001;38:979–987. [DOI] [PubMed] [Google Scholar]
- 24.Carskadon MA, Dement WC. Cumulative effects of sleep restriction on daytime sleepiness. Psychophysiology 1981;18:107–113. [DOI] [PubMed] [Google Scholar]
- 25.Belenky G, Wesensten NJ, Thorne DR, et al. Patterns of performance degradation and restoration during sleep restriction and subsequent recovery: a sleep dose-response study. J Sleep Res 2003;12:1–12. [DOI] [PubMed] [Google Scholar]
- 26.Zeitzer J, Grove ME, Mignot E, Yesavage JA, Friedman L. HLA DQB1*0602 is associated with sleep perception in older individuals with insomnia. Sleep 2009;32(suppl):A262. Abstract.
- 27.Hong SC, Hayduk R, Lim J, Mignot E. Clinical and polysomnographic features in DQB1*0602 positive and negative narcolepsy patients: results from the modafinil clinical trial. Sleep Med 2000;1:33–39. [DOI] [PubMed] [Google Scholar]
- 28.Mukai J, Uchida S, Miyazaki S, Nishihara K, Honda Y. Spectral analysis of all-night human sleep EEG in narcoleptic patients and normal subjects. J Sleep Res 2003;12:63–71. [DOI] [PubMed] [Google Scholar]
- 29.Nobili L, Besset A, Ferrillo F, Rosadini G, Schiavi G, Billiard M. Dynamics of slow wave activity in narcoleptic patients under bed rest conditions. Electroencephalogr Clin Neurophysiol 1995;95:414–425. [DOI] [PubMed] [Google Scholar]
- 30.Tafti M, Rondouin G, Besset A, Billiard M. Sleep deprivation in narcoleptic subjects: effect on sleep stages and EEG power density. Electroencephalogr Clin Neurophysiol 1992;83:339–349. [DOI] [PubMed] [Google Scholar]
- 31.Ferri R, Miano S, Bruni O, et al. NREM sleep alterations in narcolepsy/cataplexy. Clin Neurophysiol 2005;116:2675–2684. [DOI] [PubMed] [Google Scholar]
- 32.Montplaisir J, Billiard M, Takahashi S, Bell IR, Guilleminault C, Dement WC. Twenty-four-hour recording in REM-narcoleptics with special reference to nocturnal sleep disruption. Biol Psychiatry 1978;13:73–89. [PubMed] [Google Scholar]
- 33.Sasai T, Inoue Y, Komada Y, Sugiura T, Matsushima E. Comparison of clinical characteristics among narcolepsy with and without cataplexy and idiopathic hypersomnia without long sleep time, focusing on HLA-DRB1*1501/DQB1*0602 finding. Sleep Med 2009;10:961–966. [DOI] [PubMed] [Google Scholar]
- 34.Juji T, Satake M, Honda Y, Doi Y. HLA antigens in Japanese patients with narcolepsy: all the patients were DR2 positive. Tissue Antigens 1984;24:316–319. [DOI] [PubMed] [Google Scholar]
- 35.Hohjoh H, Nakayama T, Ohashi J, et al. Significant association of a single nucleotide polymorphism in the tumor necrosis factor-alpha (TNF-alpha) gene promoter with human narcolepsy. Tissue Antigens 1999;54:138–145. [DOI] [PubMed] [Google Scholar]
- 36.Aran A, Lin L, Nevsimalova S, et al. Elevated anti-streptococcal antibodies in patients with recent narcolepsy onset. Sleep 2009;32:979–983. [DOI] [PMC free article] [PubMed] [Google Scholar]
- 37.Galliaud E, Taillard J, Sagaspe P, Valtat C, Bioulac B, Philip P. Sharp and sleepy: evidence for dissociation between sleep pressure and nocturnal performance. J Sleep Res 2008;17:11–15. [DOI] [PubMed] [Google Scholar]
- 38.Bodenmann S, Xu S, Luhmann U, et al. Pharmacogenetics of modafinil after sleep loss: Catechol-O-Methyltransferase genotype modulates waking functions but not recovery sleep. Clin Pharmacol Ther 2009;85:296–304. [DOI] [PubMed] [Google Scholar]
- 39.Rétey JV, Adam M, Khatami R, et al. A genetic variation in the adenosine A2A receptor gene (ADORA2A) contributes to individual sensitivity to caffeine effects on sleep. Clin Pharmacol Ther 2007;81:692–698. [DOI] [PubMed] [Google Scholar]
- 40.Faraco J, Mignot E. Genetics of sleep and sleep disorders in humans. In: Kryger MH, Roth T, Dement WC, eds. Principles and Practice of Sleep Medicine, 5th ed. Philadelphia: Elsevier; 2010. [Google Scholar]
Associated Data
This section collects any data citations, data availability statements, or supplementary materials included in this article.