Figure 7.
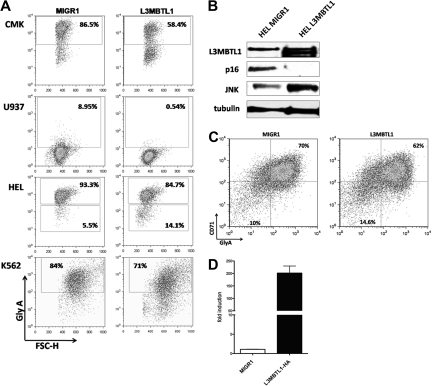
L3MBTL1 restricts erythroid differentiation. (A) GlyA expression was assessed by FACS in the L3MBTL1-HA expressing CMK, U937, HEL, and K562 cells compared with the MIGR1 (empty vector) transduced cells. (B) p16 protein expression levels were determined by Western blot analysis in L3MBTL1-HA HEL cells versus the MIGR1 (empty vector) control HEL cells. JNK and L3MBTL1 levels are also shown. Tubulin served as the loading control. (C) GlyA expression in L3MBTL1-HA expressing CD34+ cells after 3 days of culture with SCF 100 ng/mL and Epo 6 IU/mL, compared with the MIGR1 (empty vector) transduced cells. (D) L3MBTL1 mRNA expression levels in retrovirally infected CD34+ cells, quantified by quantitative PCR (n = 3).

