Abstract
Protein functional sites control most biological processes and are important targets for drug design and protein engineering. To characterize them, the evolutionary trace (ET) ranks the relative importance of residues according to their evolutionary variations. Generally, top-ranked residues cluster spatially to define evolutionary hotspots that predict functional sites in structures. Here, various functions that measure the physical continuity of ET ranks among neighboring residues in the structure, or in the sequence, are shown to inform sequence selection and to improve functional site resolution. This is shown first, in 110 proteins, for which the overlap between top-ranked residues and actual functional sites rose by 8% in significance. Then, on a structural proteomic scale, optimized ET led to better 3D structure-function motifs (3D templates) and, in turn, to enzyme function prediction by the Evolutionary Trace Annotation (ETA) method with better sensitivity of (40% to 53%) and positive predictive value (93% to 94%). This suggests that the similarity of evolutionary importance among neighboring residues in the sequence and in the structure is a universal feature of protein evolution. In practice, this yields a tool for optimizing sequence selections for comparative analysis and, via ET, for better predictions of functional site and function. This should prove useful for the efficient mutational redesign of protein function and for pharmaceutical targeting.
Keywords: binding site prediction, sequence selection, functional annotation, evolutionary trace
Introduction
The knowledge of which amino acids mediate protein function is necessary to unravel molecular mechanisms,1,2 to redesign function rationally,3,4 and to target drugs.5 The gold standard to identify these residues remains systematic mutational analysis,6–8 but this approach has some high throughput limitations. Inadequate choice and availability of assays reduce sensitivity while the promiscuity of binding9 or catalysis,10 as well as poor reproducibility of the relevant cellular context,11 reduce specificity.
This prompts complementary computational methods to discover functional sites, their residues and their biological roles. Approaches based on pre-existing structure may be grouped broadly into those using energetics,12–15 and others using structural and geometric analysis.16–19 Here, we focus on comparative, or evolutionary approaches,20–26 and specifically on the evolutionary trace (ET).27,28
ET maps functional hotspots on protein structures: areas of the protein where amino acids that impact function concentrate. In large-scale analyses, ET ranked amino acids by evolutionary importance8,29 such that the top-ranked ones formed structural clusters30–32 that overlapped and predicted functional sites.33,34 Case studies further showed that bona fide ET-guided mutants could then block, separate and even swap functions in vitro and in vivo.35–38 ET thus predicts key functional determinants and enables their rational perturbation.
With the goal to optimize accuracy for high throughput automated ET, this study now aims to increase the functional consistency among ET's input sequences. On the one hand, this is not trivial. Simply relying on BLAST39,40 to pool homologous sequence often leads to functionally heterogeneous sequence selections,41–43 and, in turn, since ET identifies the functional sites that are common to all the proteins which it analyzes, such functional heterogeneity reduces accuracy. On the other hand, it is possible to optimize the selection of sequences. When some of these homologous sequences are pruned away so as to improve either the structural clustering of ET ranks,44,45 or their information content46 in the sequence, then the overlap between top-ranked residues and the functional site increases. Building on these results, the hypothesis of this work is that basic features of the ET rank distribution can be found that inform the selection of sequences and improve ET accuracy.
This article presents evidence that continuity of ET ranks across adjacent residues is one such fundamental characteristic of evolutionary forces. One type of test for successful ET improvement will be whether top-ranked ET residues overlap better with known functional sites. As this involves just a small fraction of the known structural proteome, however, a second, high throughput test will be whether these improvements carry over to protein function predictions via ET Annotation (ETA).47,48 In this approach, without any prior knowledge of functional or catalytic sites, ET guides the selection, in a query protein of unknown function, of a structural motif of (six) top-ranked, neighboring, surface residues that together define a 3D template. ETA then matches the 3D templates to previously annotated proteins across the PDB. Matches identify analog substructures with similar geometric and evolutionary features that may therefore mediate identical functions, and this is the basis for function predictions with ETA, or with related approaches.49 Predictably, an improved assignment of ET ranks yields better templates for functional annotation. For example, replacing 3D template residues by presumed catalytic site residues lowered prediction accuracy from 96% to 81%.50 Thus, ETA annotations depend sensitively on an all-against-all comparisons of ET ranks, and their improvement will confirm broad gains in accuracy across the structural proteome.
Results
Quantitative features of the rank distribution
To probe features of the ET rank distributions that are universal and that correlate with accuracy, we define in the “Materials and Methods” section seven quality measures, Qm, where the subscript m reflects the choice in measure, see Table 1. We show below that all of them fulfill three conditions that are necessary and sufficient to guide the selection of input sequences for ET: (1) they are computable without reference to prior known functional sites; (2) they correlate with the overlap between high ranked residues and the known functional site, Aoverlap; (3) and sequence selections that increase their value also improve Aoverlap. Accordingly, each Qm can guide the selection of sequences in order to improve functional site detection without prior knowledge of that site. Notably, some of these different Qm depend on the structure and others on the sequence, but most focus on the similarity of physically neighboring ET ranks, that is, their continuity in the sequence or in the structure (Fig. 1). This common theme suggests that many other derivative quality measures also related to continuity could be devised easily.
Tabel 1.
Summary of Quality Measures
| Qm | Formula | Description |
|---|---|---|
| z-score based measures | ||
| Qstructure,1 | f(i,j) = (j − i) | Structural clustering |
| Qstructure,2 |  |
Structural clustering |
| Qstructure,3 | f(i,j) = 1 | Structural clustering |
| Qsurface |  |
Surface clustering |
| Qsequence | f(i,j) = δj−i,1 | Neighbors in sequence |
| non z-score based measures | ||
| Qcontrast |  |
Contact rank difference |
| QRI | TI × RE | Information content of ranks |
There are five z-score based Qm's that measure the statistical significance of the clustering among ET top-ranked residues within structure and sequence. The measures are a function of z-scores,  where
where  . The quantity w measures the top-ranked residues in contact spatially. The difference lies in the weighting term f(i,j), which weighs the contribution of residues i and j differently based on their relative position in the structure and sequence. The last two measures (Qcontrast and QRI) are unique in formula. Qcontrast is a measure of the rank gradient over the structure. QRI is structureless measure of the information content of the rank distribution. Further detail of the Qm's can be found in “Materials and Methods” section.
Figure 1.
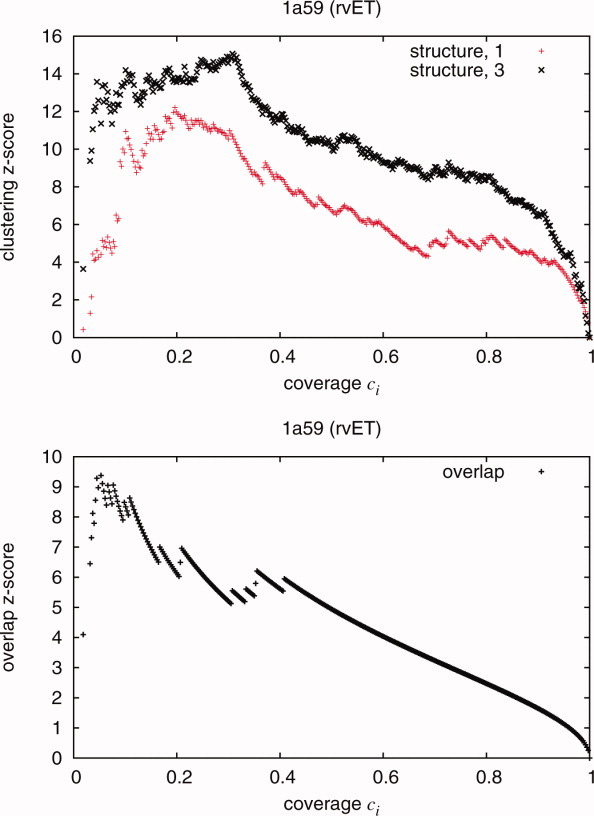
(a) The clustering z-score measures the nonrandomness of the clustering of top-ranked residues in space. The z-scores are a direct result of the ranking of the residues in a protein structure. This diagram shows an example of the clustering z-scores as a function of ci using the rvET method for a cold-active citrate synthase [Antarctic bacterium, PDB 1a59]. The high clustering z-scores would indicate similarly ranked residues proximate in the structure and would be considered a positive result. Quality measures Qstructure,1 and Qstructure,3 are variants of the clustering z-scores. (b) To represent a method's ability to predict a known site, the overlap z-score is also calculated using a simple hypergeometric distribution. An example of the overlap z-scores as a function of ci can be seen in bottom figure. The overlap measure Aoverlap is derived from the these z-scores.
Correlations with deleterious sequence perturbations
To test condition 2, Qm perturbations were introduced in ET's input and a correlation was assessed between spatial clusters of top-ranked residues and known functional sites, that is, between the quality measure Qm and the overlap Aoverlap. Different ranking methods were used each time to control for method-specific bias: the integer value ET27 (ivET), Shannon Entropy51 and the current standard real value ET28 (rvET), which is resilient to errors like entropy, but exploits the phylogenetic information like ivET. Each method is reviewed in “Materials and Methods” section.
The first type of perturbation was to add more sequences to the input to ET, starting from just the query and two homologs. The sequences were taken at random from an initial BLAST52 search. A representative example shows that Qcontrast and Aoverlap were well correlated (>0.9) (see Fig. 2) and this generally irrespective of the ranking method (Fig. 3). There was one sole outlier Qstructure,3, that had a poor correlation for ivET. Also note that one method, ivET, had more proteins with little or no correlation. This is consistent with the high sensitivity of ivET to errors, gaps, misalignments or polymorphisms that break the perfect match between sequence variations and phylogenetic divergences that is the hallmark of ivET rankings. Once such a sequence was added to the input, it decreased the overlap to a known site irretrievably, yielding traces with lower quality and lower correlations overall.
Figure 2.
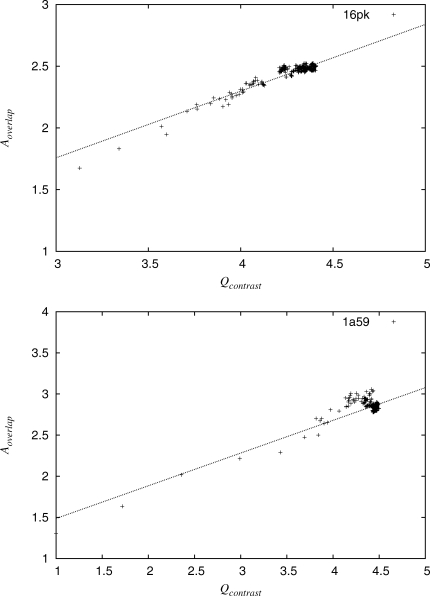
A correlation between quality measures and overlap of known site was found when variations were considered in alignment. The quality measures are a result of the ranking of the sequences in an alignment. These diagrams show examples of the values of quality measure Qcontrast and overlap measure Aoverlap as sequences are added into the analysis randomly. The values for the first 30 sequences added to the analysis were used to calculate correlation.
Figure 3.
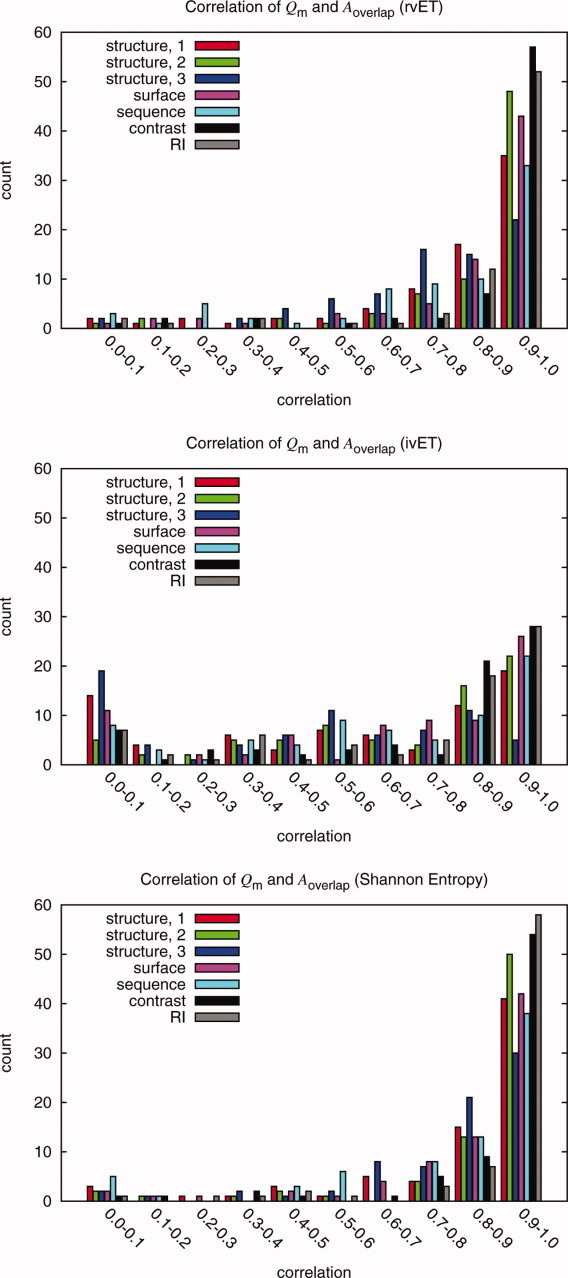
Distribution of Pearson correlations between quality measure variations and overlap measure variations in 74 proteins when sequences are added randomly added to an alignment. The purpose of the study was to test the methods and quality measures as a function of sequence selection. The histograms show the correlations of the possible quality measures and functional site measure Aoverlap for the rvET, ivET, and Shannon Entropy method when 30 sequences are randomly added to the ranking analysis. The Qcontrast (labeled EC), QRI and Qstructure,2 had the highest correlations amongst the quality measures for the ranking methods though all measures where found to have some correlation. Note that one method, ivET, had more proteins with little or no correlation. This is consistent with the high sensitivity of ivET to errors, gaps, misalignments or polymorphisms that break a perfect match between sequence variations and phylogenetic divergences. Once such a sequence was added to the input, it decreased the overlap to a known site irretrievably, yielding traces with lower quality and lower correlation.
A second type of perturbation (Fig. 4) was introduced to further test these correlations. To corrupt the alignments, an increasing number of mutations were introduced to simulate errors (in steps of 0.25% and up to a 5% error). Each time, a sequence and residue location was randomly picked and replaced with another residue or a gap, also picked randomly (each had an equal chance of occurring). The procedure was repeated 10 times to find how the average quality measure Qm correlated with the average functional site overlap, Aoverlap, as a function of errors. Again, Qm's and Aoverlap were both strongly correlated for most proteins and ranking methods (Fig. 5). This time, Qstructure,3 was comparable to Qstructure,2, and even outperformed it with integer value ET. These observations suggest that Qm's are adequate surrogate markers of the impact of input sequence perturbations on the accuracy of ET hotspots.
Figure 4.
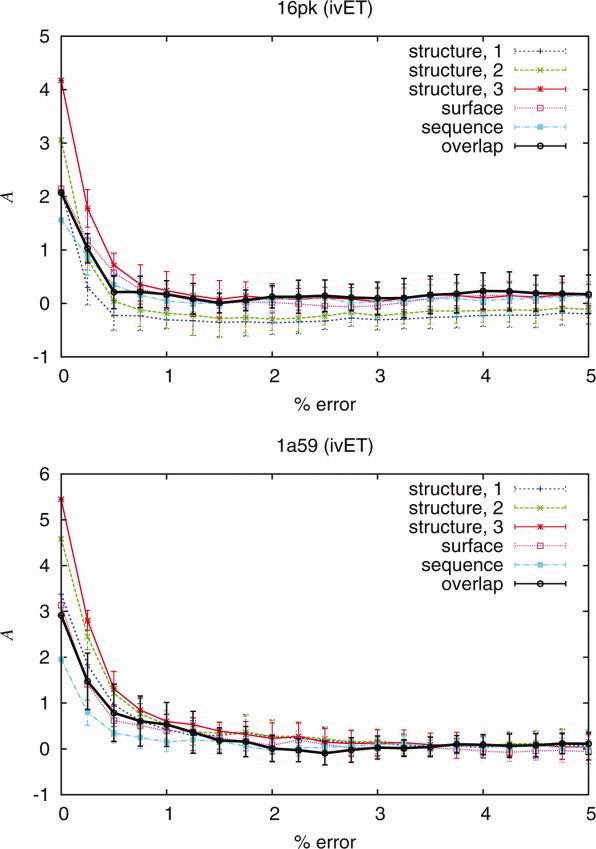
Analysis was performed to study the performance of the quality measures and the ranking methods as errors were introduced. The deterioration of the quality measures and overlap measure Aoverlap as a function of random mutations in the analysis is observed in protein 16pk and 1a59. Correlation was determined from the values of the quality measures and overlap measure Aoverlap.
Figure 5.
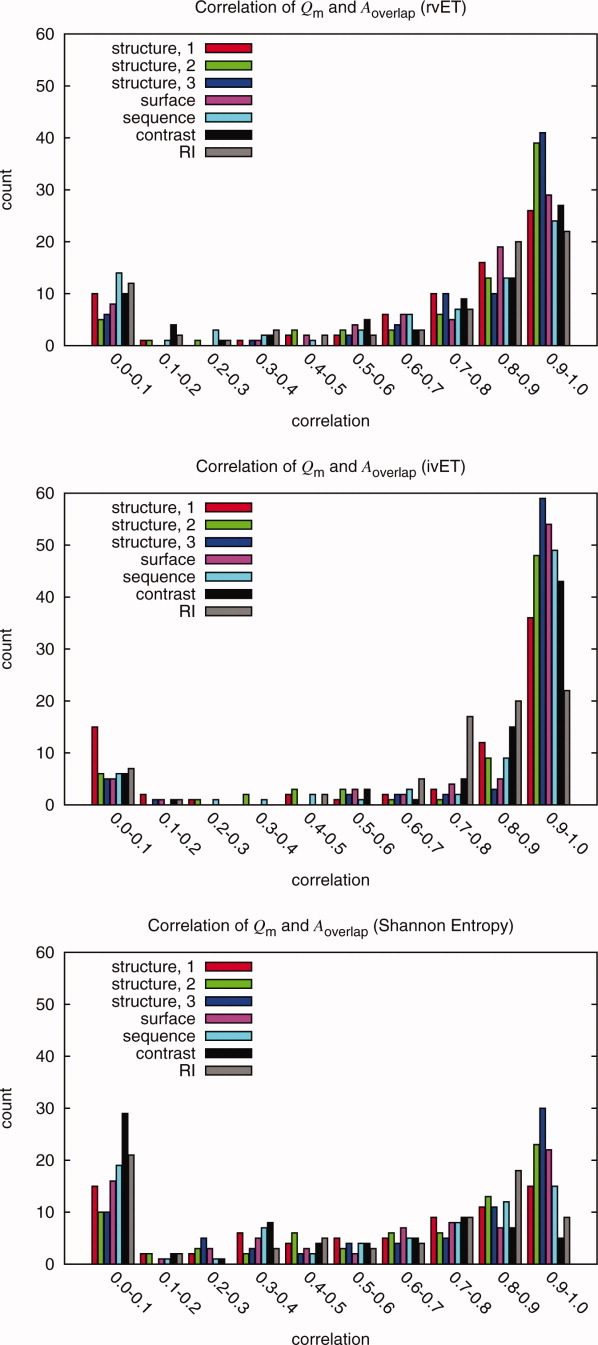
To test ranking methods and quality measures, random mutations were inserted into the alignment. These histograms show the correlations of the possible quality measures and functional site measure Aoverlap for the rvET, ivET, and Shannon Entropy method. The Qstructure,2 and Qstructure,3 measures consistently have the best correlations in all three methods for the majority of the proteins. All measures were shown to have some correlation. The Shannon Entropy and the rvET methods had a significant number of proteins with low correlation when compared to the ivET method. This is because ivET is very sensitive to errors while the other methods are more resilient. Thus, as errors were added, ivET rapidly lost accuracy and showed better correlations than the two other, more robust methods for which the overlap with the known site would not change dramatically up until the alignment had 20% error. Though this decreased correlation may impair optimization, it is desirable for good initial functional site prediction.
Test set: Individual quality measures
Next, we tested whether sequence selections that maximized Qm also improved ET predictions. An optimization algorithm described in Materials and Methods added, or removed, sequences or whole evolutionary tree branches from ET's input depending on whether Qm values rose, or fell. It was then applied to 74 diverse proteins (that variously bind substrates, cofactors, DNA or proteins). In each case, an initial BLAST52 search gathered sequences; those with obvious gaps and fragments were removed (a step referred to as coarse heuristic pruning); and the remaining sequence selections were refined with the optimization algorithm.
Consistent with the hypothesis, most sequence selections could be manipulated to increase Qm and, in turn, lead to better overlap with the known functional sites (see Table 2). Optimized ET improved on coarse heuristic pruning, which itself had improved on the naive ET result taken over the initial, raw set of sequence homologs. This held for every Qm, independent of the ranking method. Specifically, the robust rvET method yielded the best final overlap between top-ranked residues and known functional sites, with z-scores rising as much as 9% (see Table 2). The ivET method, which is sensitive to sequence perturbations, gained the most (up to 15% z-score increases) but still lagged behind rvET. Strikingly, similarity among sequence neighbors alone, measured via the Qsequence measure, was sufficient to improve overlap of known site (〈zo〉 increased 7%). Thus, ET rank similarities among neighbors computed without knowledge of the 3D structure are significant in their own right. Overall, the rank distribution features measured by Qm are sufficiently correlated with ET accuracy to inform sequence selection and to optimize ET results.
Tabel 2.
Training Set Optimized to Find a Better Sequence Selection Using the rvET, ivET, and Shannon Entropy Methods for the Individual Quality Measures
| 〈zo〉 | |||
|---|---|---|---|
| Q | rvET | ivET | Shannon Entropy |
| No pruning | 3.14 | 1.08 | 3.28 |
| Pruning only | 3.71 | 2.98 | 3.61 |
| Cluster, 1 | 3.75 (+1.1%) | 3.39 (+13.8%) | 3.65 (+1.1%) |
| Cluster, 2 | 3.89 (+4.9%) | 3.38 (+13.4%) | 3.69 (+2.2%) |
| Cluster, 3 | 4.06 (+9.4%) | 3.45 (+15.8%) | 3.70 (+2.5%) |
| Surface | 4.05 (+9.2%) | 3.45 (+15.8%) | 3.64 (+0.8%) |
| Sequence | 3.96 (+6.7%) | 3.35 (+12.4%) | 3.76 (+4.2%) |
| Contrast | 4.07 (+9.7%) | 3.45 (+15.8%) | 3.71 (+2.8%) |
| RI | 3.68 (−0.8%) | 3.08 (+3.4%) | 3.58 (−0.8%) |
| Combined measure | 4.16 (+12.1%) | — | — |
All quality measures were shown to improve the overlap except the QRI which decreased the overlap measure 〈zo〉 in the case of the rvET and Shannon Entropy methods. The small decrease of 〈zo〉 due to QRI optimized may be because the value of the measure is already near maximized. The optimization with the ivET method had a larger improvement due to a new sequence selection but did not give the equivalent results of the rvET method before optimization. The 〈zo〉 for the pruned set is considered the original/starting value for the alignments described in “Materials and Methods” section.
In practice, the human Rac/p67phox complex [PDB 1e96]53 illustrates these gains (Fig. 6). The GTPase Rac and p67phox assemble to form an active enzyme complex, the NADPH oxidase, which generates superoxide in the phagosome of neutrophils as part of their attempts to kill bacteria during infection. After collecting BLAST hits [Fig. 6(a)], culling sequences with blatant problems [Fig. 6(b)] and further Qcontrast optimization [Fig. 6(c)], the top 25% ranked residues are shown in rainbow coloring (Red is most important and yellow is 25th percentile rank). The bound protein p67phox is shown in green [Fig. 6(d)]. Optimization specifically improved the resolution of the protein-protein interface, with the additional recovery of 5 interfacial residues (I21, T24, T25, F28, D29). Likewise, the receiver-operator curve (ROC) of sensitivity versus specificity [Fig. 6(e)] and the overlap z-scores [Fig. 6(f)] improved with the optimized ranks.
Figure 6.
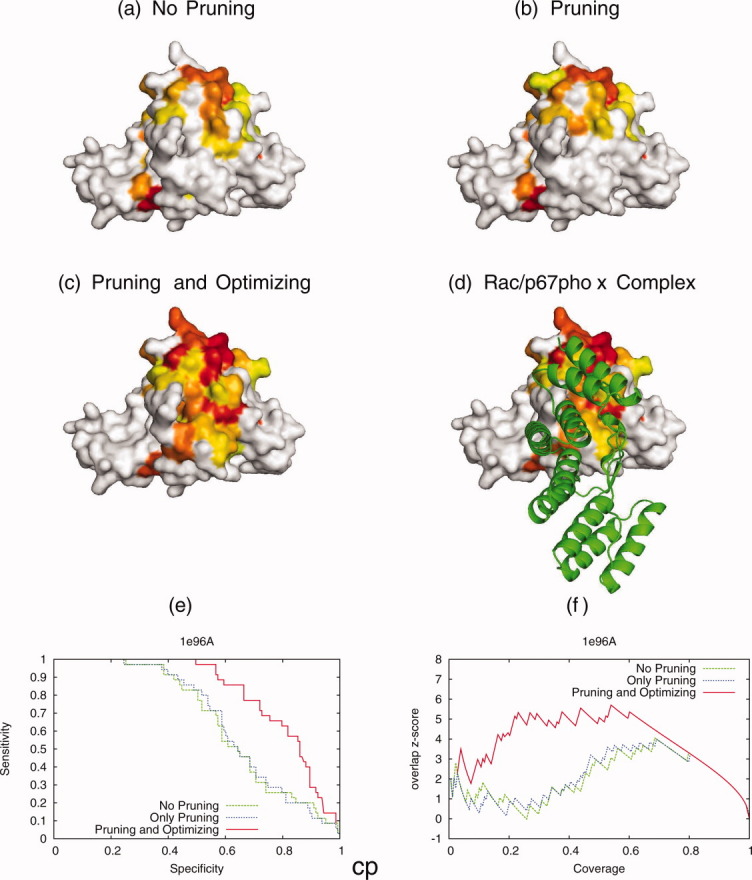
The sequence selection was optimized with quality measure Qcontrast for human Rac/p67phox complex [PDB 1e96]. The top 25% ranked residues before and after the optimization are shown here. The individual rankings with no pruning (a), only pruning (b) and after optimization (c) are shown. (d) shows the actual protein–protein interface. The bound protein p67phox is shown in green. Before optimization the average overlap z-score 〈zo〉 after pruning is 0.96 while the optimization improves 〈zo〉 to 2.76. The new alignment predicts more residues proximate to the known protein-protein interface. The optimization of the sequence selection dramatically improves the ability to predict the interfaces. An interactive view is available in the electronic version of the article.
Similar observations held in the human growth hormone and receptor complex (Fig. 7, PDB 3hhr).54 This complex comprises the growth hormone (Chain A) bound asymmetrically to two receptor molecules (Chain B & C) and it is essential for growth and development and a potential drug target.55,56 This time, the new selection of sequences illustrated in Figure 7 was guided by Qsurface and it enabled the ET recovery of the protein–protein interface with the receptor (Chain B). The color-coding is as before.
Figure 7.
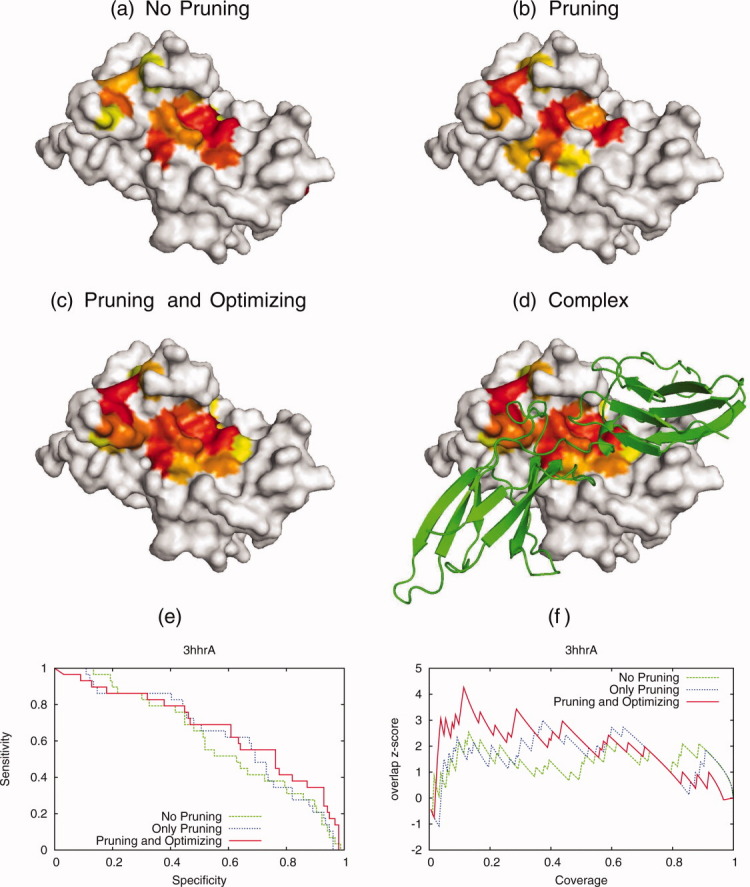
The optimization was performed with the Qsurface quality measure for the human growth hormone and receptor complex [PDB 3hhr]. The individual rankings with no pruning (a), only pruning (b) and after optimization (c) are shown (Red is most important and yellow is 25th percentile rank). The new selection of sequences enables the ranking method to recover the protein–protein interface with the receptor (shown in green). The average overlap z-scores starts 〈zo〉 = 1.30 (no pruning), after pruning 〈zo〉 is 1.48 and after quality measure optimization the 〈zo〉 = 3.14. The new sequence selection improves the ability to the predict the protein interface.
Test set: Combined quality measures
Next, we asked whether the Qm's might be combined together. This is plausibly useful since each Qm responds slightly differently to different perturbations and, in turn, optimizes different ranking methods to different extents. After trial and error, a single composite score Qcomposite for the ET ranks emerged. It combined the standard scores of Qsurface, Qstructure,2, Qsequence, and Qcontrast and it improved the average z-score 〈zo〉 of the 74 test proteins (on which it was trained) from 3.71 to 4.16 (+12%) (shown in Fig. 8). This suggested that, independent of the ranking method, functional site prediction improved the most when sequence selection led to ET ranks that are the most evenly smoothed out and concentrated over the whole structure, its surface, or the sequence.
Figure 8.
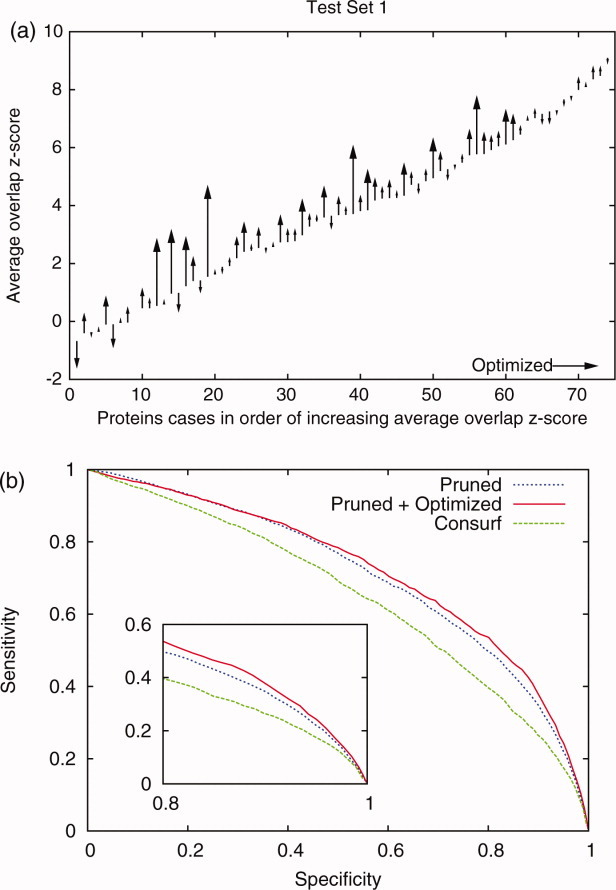
Optimization of the sequence selection using the combined quality measure further improved functional site prediction. Best results were obtained by first pruning the alignment and then followed by quality measure optimization with a combination of the standard score of the quality measures, Qsurface, Qstructure,2, Qsequence, and Qcontrast. (a) The diagram shows the functional site measure 〈zo〉 before and after the optimization of the pruned alignments is compared for the 74 individual proteins. The average overlap z-scores increased by 12% when rankings depend the optimized alignments compared to the pruned only. (b) The differences in methods can also be seen in receiver-operator curve. The pruned traces and pruned/optimized out performed the Consurf20 results.
To confirm these results are free of circular bias, ET optimization guided by this composite score Qcomposite was next tested in 110 unrelated proteins taken from the literature.57,58 Their known ligands defined the gold standard functional sites from PDBsite.59 The optimized ET overlap z-score 〈zo〉 improved was 3.75, and 8% improvement on the standard ET server (3.46) [Fig. 9(a)], at percentile ranks within 20%. For reference, another functional site detection method, Consurf,20 yielded overlaps with average z-scores 〈zo〉 of 2.17. Receiver-operator curve further illustrate the gain in sensitivity and specificity after ET optimization [Fig. 9(b)]. The equivalent results (standard ET, optimized ET and Consurf) for each proteins are in Supporting Information. The average overlap z-scores decreased in a few cases, those proteins typically had multiple ion-binding sites. The prediction would then improve for one site but lose overlap with respect to the secondary sites
Figure 9.
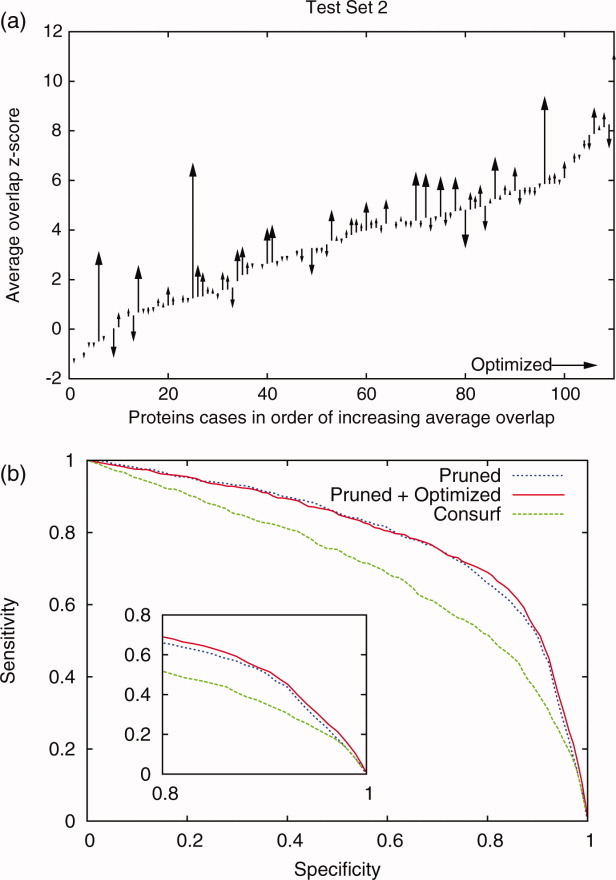
To test quality measure optimization method a second set was optimized for improvement in site prediction. The average z-score before and after the optimization for the 110 proteins was compared. (a) We found that after optimized sequence selection the dataset improved site prediction (average z-score improved from 3.46 to 3.75, an 8% increase). (b) The pruned traces and pruned/optimized out performed the Consurf results.
Bovine ribonuclease A [PDB 7rsa]60 illustrates the gain accuracy. The enzyme has four catalytic residues (H12, K41, H119, and F120). Figure 10 shows the catalytic residues (spheres) and the ET top-ranked residues (colored by rank, red is most important evolutionarily and yellow is at the 20% ET rank). To recover all four catalytic residues the standard ET needed a coverage reaching as far as a percentile rank of 52%. By contrast, the optimized ET identified all of them with a scant coverage of only the 20th percentile rank. Thus, maximizing Qcomposite significantly improved the resolution of the functional sites.
Figure 10.
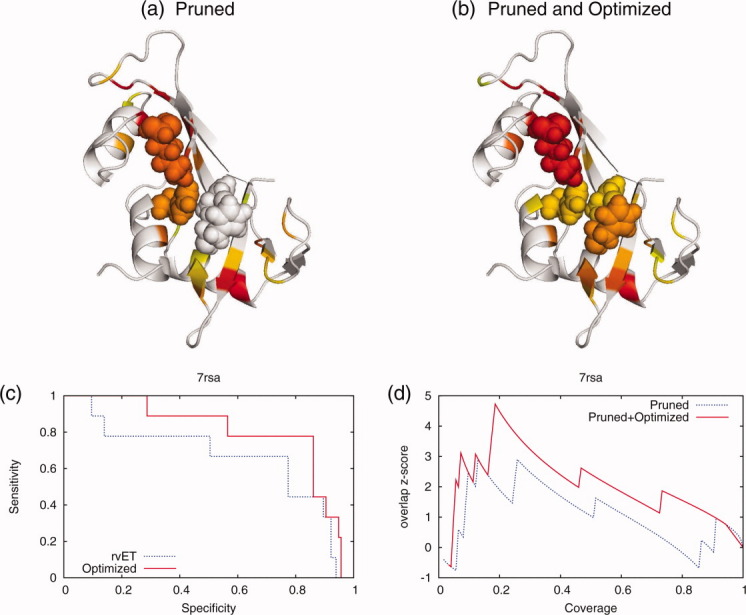
The example of the optimized sequence selection for phosphate-free bovine ribonuclease [PDB 7rsa] known to have an active site with catalytic residues. The top 20% ranked residues before (a) and after the optimization (b) are shown in both diagram. Residues marked red are most important and yellow are the 20th percentile rank. The overlap z-scores (c) and sensitivity/specifity (d) had significant improvement with a new selection of sequences based on quality measures.
Application: Annotation set
To assess more generally the meaning of an of 8% increase in the z-score of functional site overlap, we asked next whether it improved function prediction via 3D-templates. This is a stringent test for two reasons: it requires large-scale comparisons of traces over a representative subset of the PDB; and it focuses specifically on molecular determinants of function as defined by a few of the very best ranked residues, so accurate ET rank order is paramount.
In more details, 3D templates are small structural motifs made up of just a few (six) of the most functionally important neighboring surface residues in a (query) structure. Ideally, they embody the key residues that are necessary and sufficient to determine function, and a classic example is the catalytic triad of serine proteases. When such templates can be matched in other (target) structures in terms of geometry and evolutionary importance, repeatedly and reversibly,47,48,50 then such matches are likely to be relevant, rather than random, and to indicate that the query and the target have the same enzymatic activity and hence the same Enzyme Commission (EC) number.
The challenge is that for most proteins, the functional sites are not known a priori. Hence there are no obvious templates. The Evolutionary Trace Annotation (ETA) server61 obviates the need for any prior knowledge of function, functional site location, and functional site composition by building templates solely on the basis of residue rank order and distribution: it picks a six residue template from clusters of top-ranked surface residues. Then it searches and finds matches across the PDB as described above to suggest likely functions. Recently, when ETA was controlled with the standard rvET analysis on 1217 structural genomics enzymes that were already annotated with EC numbers, the positive predictive value (PPV) was 93%, but the sensitivity was much lower, 43%.47 A prediction is correct if the first three digits of the EC annotation are correct. Typically, this defines the chemical reaction, although not its substrate, which would require the fourth digit.
Here, ETA was run again on the same set, but this time using optimized traces to create templates for both the 1217 control queries and the target set of all annotated 2006 PDB90 protein structures. Overall, for 1217 proteins, the three digit EC PPV rose to 94% from 93% (Table 3). More strikingly, sensitivity rose to 53% from 40%, where PPV = correct predictions/(correct predictions + incorrect predictions) and sensitivity = correct predictions/number of proteins in the test set.
Tabel 3.
Protein Set Annotated by the ETA Method Using Default Alignment and the Optimized Sequence Selection Alignment
| Pruned | Optimized | |
|---|---|---|
| Number of proteins | 1217 | 1217 |
| Number of predictions | 522/1217 (43%) | 690/1217 (57%) |
| Correct predictions | 483/522 (93%) | 648/690 (94%) |
The new selection of sequence made a dramatic improvement in the number of prediction without compromising accuracy. The sensitivity increased to 53% from 40%. The quality measure optimization will contribute considerably to prediction for functional annotation.
This trend was robust, even when trivial matches to proteins of high sequence identity are progressively removed from consideration. For example, at the 40% threshold (meaning that all annotations are based on matches to other structures with less than 40% identity), the three digit EC PPV rose to 92% from 89%, and sensitivity rose to 30% from 25% (Fig. 11). ETA with optimized ET added 243 predictions, where 227 were correct and 16 were not. Conversely, optimized ETA missed prediction for 75 cases that unoptimized ETA analysis alone had recovered. Thus, overall, optimized traces improve the rank distribution sufficiently to raise the quality of picked templates, the relevance of their matches and overall net predictions of enzyme function.
Figure 11.
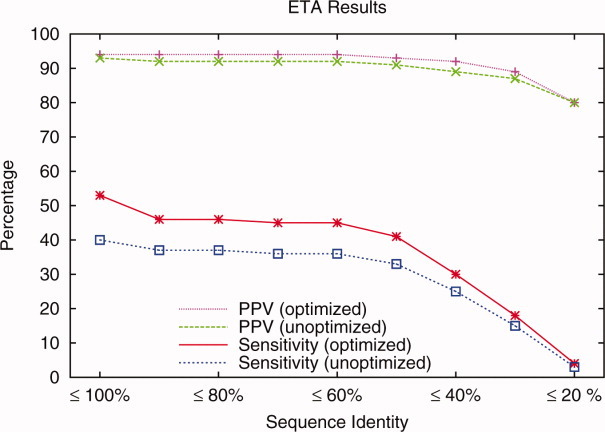
ETAs performance for 1217 enzymes with optimized and unoptimized ET. Positive predictive value (PPV) and sensitivity are calculated removing matches above a sequence identity threshold.
As an example, standard unoptimized ETA found no matches for the template it extracted from Dephospho-CoA kinase (EC 2.7.1.24) (Dephosphocoenzyme A kinase) (tm1387) from Thermotoga maritima at 2.60  resolution [PDB 2grj; chain A]. That template consisted of residues: 12G, 13K, 113G, 142L, 134R, 139D and 142L. The optimized ETA, however, created a different template (see Fig. 12) in which four of six residues were different: 6T (old ET percentile rank 10.3% → new percentile rank 2.9%), 84H (7.4% → 5.1%), 85P (10.9% → 4.0%), 107A (8.0% → 3.4%) while 12G (1.7% → 2.9%) and 13K (1.7% → 2.9%) were unchanged. The average percentile rank of the optimized template improved from 6.7% to 3.5%, and ETA was able to match a dephospho-coenzyme A kinase from Haemophilus influenzae [PDB 1jjv; chain A] of 29% sequence identity with 2grj (chain A), leading to a correct prediction of EC 2.7.1.24.
Figure 12.
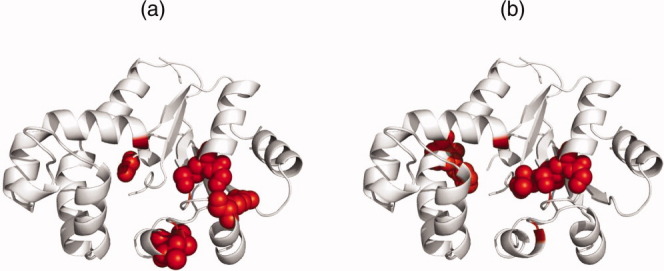
Pictures show the ETA templates as spheres on the PDB 2grj (chain A) structure. Both templates are taken at 5.14% ET percentile rank. Left structure (a) shows the template from unoptimized ET while the right (b) is the template from quality measure optimized ET.
Discussion
This study is part of a long-term effort to identify evolutionary hotspots27 in proteins in order to design functional variants62 or peptidomimetics63 that selectively perturb pathways involved in signaling,38,63,64 transcription,65,66 or genomic stability.34 The approach relies on the Evolutionary Trace, a method that integrates sequence, structure and function analyses into a single framework to characterize structural sites and functional residues. Some recurrent features of top-ranked ET ranks residues27 are that: these top-ranked residues (in the 10th, 20th, 30th top-percentile rank) cluster non-randomly in protein structures30; and these clusters overlap significantly with, and therefore reveal, functional sites.31,67 These observations are highly reliable and can efficiently guide experiments, for example, to separate functions,8,34 rewire specificity,29 design peptide inhibitors,63 or reveal the conformational trigger of an allosteric pathway and recode it to respond to a different ligand.68 Beyond these varied experimental case studies, ETA function prediction further validated the basic premise that clusters of top-ranked ET residues point to functionally essential residues, but this time on a large scale.
These prior results suggest that ET ranks highlight fundamental, general and useful patterns linking the distribution of evolutionary importance in sequence residues to their structural location and to their biological roles. The question posed here, is whether other quantifiable features can be defined to improve the resolution of this evolutionary relationship, and to lead to more accurate ranks, more accurate functional sites, and more accurate function predictions.
All seven of the quality measures proposed here do so, as does the 8th composite one. They guided sequence selections that improved the match between top-ranked residues and functional sites, independent of the precise ranking algorithm. The rise in statistical significance, the z-score of overlap, with the composite quality measure was 8% in 110 proteins unrelated to the training set. This gain translated into better resolution of the functional sites in both individual case studies and on a proteome-wide scale for function prediction. ETA sensitivity rose sharply (a 13% gain from 40% to 53%, which is a 33% relative increase) with no loss of specificity (positive predictive value rose 1% from 93% to 94%). The results reflect the large impact of even subtle improvements in ET ranks.
These data also confirm the hypothesis: for most, if not all proteins, quantifiable features of ET rank distributions can be optimized towards more accurate views of the sequence-structure-function evolutionary relationship. But the multiplicity of Qm, their complementarity, and the better performance of the ad hoc, composite quality measure Qcomposite, suggest that a deeper, more general and more basic feature of the distribution of evolutionary importance in proteins is at play.
It is therefore noteworthy that a common theme among the Qm is to focus on neighboring residues and rate whether they have similar evolutionary importance. The more this is so, the more top-ranked residues will cluster,30 and ET accuracy measures will increase. This suggests two related broader reformulation of our results: First, that ET ranks should distribute continuously, that is, such that from one neighbor to the next the change in evolutionary importance is as small, or smooth as possible. Second, that ET ranks should be most ordered, that is, their distribution entropy is least. Both statements hold for sequence neighbors, or spatial neighbors in the structure, and suggest, most simply that over time, molecular evolution operates in sequence and structure in an orderly and continuous fashion.
In this light, mutations are still random events, but the physical and function constraints that lead to natural selection lead to the apparent order and continuity of evolutionary importance. The different quality measures reflect different ideas of what organization of evolutionary ranks best reflects nature: how to measure the continuity or the entropy of a distribution of evolutionary importance in the discrete context of a sequence or structure? In practice, the suitability of aligned sequences for site prediction analysis can be measured and optimized to improve the statistical significance of functional site predictions. These gains are scalable to the proteome and carry over to the prediction of functional determinants since these translate to improved function prediction by 3D templates.
In summary, the results suggests that a finer definition of the “clustering” property that ties top-ranked residues with function is the continuity and order of ET ranks distributions in sequence and in space. The generality of this statement is supported by all the correlations between Qm and ET accuracy, which is so reliable and so general that it guides sequence selections that optimize ET, and ETA, on a proteomic scale. The maximal rank continuity suggests a more succinct formulation than the phenomenological (ad hoc) nature of the quality measures themselves. It remains to be tested in the future whether other, and more general means to improve rank continuity can further improve ET, and in so doing point to a more definitive ET rank order quality than Qcomposite. For now, this study provides significant improvements to the automated, large-scale functional site identification and the annotation of their key residues and functions.
Materials and Method
Quality measures
The first group focuses on the notion of “clusters” of top-ranked residues. These are residues that are in contact and are evolutionarily important, given ET rank threshold. The more such residues are in contact at a given threshold, the greater Qcluster will be. Qcluster is an accumulative value derived from the clustering z-scores at each unique rank,
| (1) |
where zc(i) is the clustering z-score of the residues within a threshold based on the rank of residue i and ci is the fraction of the residues falling within this threshold. The term 1 − ci weighs more heavily z-scores arising from top-ranked residues. L is the residue length of the protein structure. The clustering z-score zc is the distance of w, the actual clustering of top-ranked residues, from its average expected value 〈w〉, measured in units of standard deviation σ and is expressed
| (2) |
Finally, the quantity w is defined by the top-ranked residues in contact and can be expressed
| (3) |
Here, the adjacency matrix A(i,j) assigns 1 to any pair of residues i and j if they are defined as neighbors (within 4  ), and is 0 otherwise. Si is the selection threshold which assigns the value of 1 if the residue i falls into a given ci. Detailed explanations of the methods used to calculate 〈w〉 and σ can be found in Mihalek et al.32
Of note, the function f(i,j) weighs the contribution of residues that are near in the structure but not in the sequence. Until now contacts between residues that were further apart in the sequence were weighed (f(i,j) = j − i, where i and j is the residue numbering) more heavily.44,45 But other choices (referred to as Qstructure,1) are possible including no special weight Qstructure,3, or a drop-off such as the square root is taken as the weight Qstructure,2. This gives rise to three quality measures.
Moreover, clustering among surface residues may be more relevant to identify functional sites for protein ligand interactions. This is the purpose of Qsurface, constructed as shown in Eqs. (1) to (3) where now f(i,j) is equal 1 if both i and j are on the surface residues (solvent accessibility > 5  according to DSSP69) and equal f(i,j) = 0 otherwise. This yields a two-dimensional measure of quality.
One may further reduce dimensionality and consider sequence clustering only. This yields Qsequence, akin to the previous Qcluster measures but with the adjacency matrix A(i,j) set at 1 only for residues that are next to each other in sequence, and set to 0 otherwise. This quality measure is structure independent.
We also consider the previously defined Rank Information (QRI)46 which does not explicitly rely on clustering, and which is also structure independent. (QRI) is a product of two expressions related to the information content of the ET rank distribution
| (4) |
where TI is the trace integral and RE is the rank entropy. The trace integral sums ET ranks over all possible positions and is written
| (5) |
where fr is the frequency a rank appears in the analysis and N is the number of sequences. The value r is an integer position based on the score from the ranking method, where it is the integer value modified by leaving gaps before the sets of equally ranked items. For example, if four residues have the evolutionary scores 1.0, 1.1, 1.1, and 1.3 then r is equal to 1, 3, 3, and 4, respectively. This transformation was necessary to compare methods. The rank entropy measures the diversity of the rank values over the possible positions as shown
| (6) |
The origin of QRI is the following. First, the fewer data are corrupted or inconsistent, the better the ranks of functional residues should be. So TI should be as large as possible. However, in the extreme, this process leads to sequences that are identical to each other so that every residue is top-ranked. RE balances this process by requiring that the rank distribution remains as diverse as possible.
Last, a partially related view of clustering among top-ranked residues is that the relative rank difference between contact pairs of the individual atoms in the residues should be minimized. This observation introduces the notion of smoothness within the distribution of ranked residues and it is quantified by Qcontrast. Qcontrast measures the rank difference between residues within the structure. Qcontrast is calculated as follows
| (7) |
The adjacency matrix A(ai,aj) = 1 if the atoms ai and aj are within a minimum distance of 4  (otherwise A(ai,aj) = 0). n is the number of atoms within the structure. The value of ci contains the evolutionary rank information as a fraction of residues with the evolutionary rank of residue i or better. The reciprocal is taken since we want the function to be maximized similar to the other quality measures. In this study, Qcontrast will only be considered across the whole structure, but it can be narrowed to surface residues only.
Finally, to assess the recovery of known sites, we use Aoverlap which is the measure of overlap with the “gold standard” functional site. This function is derived from the overlap z-scores zo, which are based on the hypergeometric distribution describing the overlap between the “gold standard” residues and the ranked residue (Fig. 1). The measure Aoverlap similar to Qcluster is defined as
| (8) |
where zo(i) is referred to as the overlap z-score corresponding to the residues within ci.
Note that in order to normalize the gains in functional site overlap among many different proteins, they are expressed in terms of 〈zo〉, the average statistical z-score of overlap between the functional site and the trace residues at the percentile ranks within the top 20%. We focus on the residues in the top 20% because the performance of the method at top ranks is more relevant when guiding experiments.
Residue ranking methods
The focus of our studies will be integer value ET, Shannon Entropy and a hybrid method (real value ET). Mihalek, et al. discuss a comparative study of the ability of these methods to predict important residues.28
The integer value ET rank27 (ivET) for the residue position i in the query protein can be expressed
| (9) |
The summation considers all the nodes N (branches) in the evolutionary tree. The value δ = 0 if residue position i is conserved within the sequences that make up the node in the evolutionary tree, and δ = 1 otherwise. The ranking method ignores the groups that are not completely conserved at position i. Assigning a rank ri to each of the residues leads to a relative ranking scheme: given any two residues, the one with smaller rank ri is considered more important. The magnitude of ri for residue position i is not important except relative to the ranks at other residue positions in the query protein. Each method we consider shares this idea.
Shannon Entropy is a measure of variability at a given position in a set of aligned sequences.51 The rank si for residue position i is defined as
| (10) |
where fia is the frequency that amino acid a appears in the column containing residue position i.
Real value ET (rvET) method28 ranks the evolutionary importance of residues in a protein family, which is based on the column variation in multiple sequence alignments and evolutionary information extracted from the phylogenetic tree. Shannon Entropy is calculated for the entire alignment, and then recalculated for all the subgroups of the alignment selected by the phylogenetic tree. The rank ρi of residue i is calculated as follows:
| (11) |
where fiag is the frequency of the amino acid of type a within the sub-alignment of group g. The number of possible nodes in the evolutionary tree is N − 1 where N is the number of sequences in the alignment. The nodes in the phylogenetic tree are numbered in the order of increasing distance from the root. Note that the node n = 1 term would be Shannon Entropy.
Training set
The dataset used to determine best set of quality measures consists of 74 proteins with protein–ligand and/or protein–protein interactions. The set was chosen to be diverse in function and to include proteins with more then one functional site. The protein data bank IDs are: 16pk, 1a09, 1a0oE, 1a22A, 1a22B, 1a2kA, 1a2kD, 1a3k, 1a48, 1a4mA, 1a53, 1a59, 1a6m, 1a6q, 1a80, 1aca, 1ad3A, 1ai2, 1aj2, 1aj8A, 1aky, 1am1, 1amk, 1aonF, 1ars, 1aru, 1ast, 1axn, 1b54, 1bag, 1bqk, 1bto, 1c1bA, 1cg0, 1cio, 1cvjA, 1cxzA, 1dam, 1dig, 1dqr, 1dqx, 1e96A, 1e96B, 1ee9, 1efaB, 1eg2, 1eje, 1elrA, 1elwA, 1f6mA, 1f88A, 1finA 1finB, 1fjmA, 1fqjB, 1gnjA, 1jfiB, 1k7vA, 1ng1, 1nzcA, 1pvdA, 1qumA, 1qupA, 1rrpA, 1rrpB, 1vh4A, 1w1uA, 1ycsA, 1ycsB, 2bif, 2mjpA, 2msbA, 3hhrA, 6gst. The “gold standard” functional sites of the protein–ligand interactions are defined by the database PDBsum.70 The protein–protein functional sites are defined as the residues within five angstroms distance of the residues in the second protein.
Pruning algorithm
For each query protein, a set of sequences were obtained with the default settings of the ETviewer.71 The set was retrieved with BLAST52 (using NCBI's non-redundant protein sequence database, the blosum62 substitution matrix, and default parameters). The top 500 homologs with an e-value better than 0.05 were retrieved from NCBI's Protein database. CLUSTALW72 (using the default parameters) was used to generate a multiple sequence alignment for the query structure. The set was pruned to remove evolutionary outliers and sequence fragments (referred to as Pruned set): sequences were removed if sequence identity was less then 26% with the query and less then 70% of the query sequence length. The sequences were then re-aligned. The set of alignments was used to test performance of the quality measures and ranking methods.
Feedback optimization algorithm
The sequence selection algorithm aims to eliminate problem sequences rather than to pinpoint a single best set. The reason is that many similarly good selections differ only by any number of combinations of close homologs, which would have no impact on the distribution of top-ranked residues. Starting from the sequences collected as described in previous section, the algorithm identifies a reasonable initial selection in the first two steps, and then adds new sequences in the third step, guided each time by the quality score measure Qm. Specifically:
The evolutionary tree nodes that contain the query protein as a leaf are used to define nested sequence selection and each one is traced. The node with the best Qm value defines the starting selection, thus initially removing outlying homologs that may conflict with closer homologs to the query.
Each of the smaller nodes of this new tree is then removed, in turn and one at a time, and the remaining sequences are retraced. If the value of the quality measure increases then the node is removed from the analysis. Thus as the tree, and sequence selection shrinks, Qm increases further.
Finally, all individual sequences are then added/removed from analysis and the Qm is evaluated based on the new rankings due to the change in sequence selection. Thus, any one of the sequences removed in earlier steps may be incorporated back into the tree. The sequences are added/removed in the order of the value of the quality measures Qm, each time retesting the sequence against the new evolutionary tree. The sequences not selected are repeatedly tested until the subset of sequences is left unchanged. The algorithm allows for five iterations to insure convergence but in a majority of the cases the selection converges after no more then three iterations.
Composite quality measure
Qcomposite is a single score made up of the standard scores of a subset of the quality measures. Qcomposite is formulated
| (12) |
where the sum is over subset of quality measures chosen. The expected average of a quality measures 〈Qm〉 and standard deviation σQm are evaluated from the values of the quality measures obtained during the steps of the Feedback Optimization Algorithm.
Sensitivity and specifity
The receiver-operator curve (ROC) was calculated on the test sets as follows: sensitivity is found as  , where a true positive (TP) is the number of residues defined to be part of the “gold standard” functional site and predicted by the ranking method, while a false negative (FN) is the “gold standard” residues that the method misses. The specificity is equal to
  , where the true negative (TN) is neither “gold standard” nor predicted by the ranking method, while the false positive (FP) is the residues not listed as part of the “gold standard” site but still predicted by the ranking method. The ROC curve was calculated with the total TP, FN, TN, and FP found as the rank coverage increased in the test sets.
Comparison to Consurf
The amino acid conservation scores were taken from the pre-calculated results obtained from the Consurf website20 We were unable to obtain a pre-calculated result for PDB ID 1cxzA. For the 73 proteins we found Consurf results, we found the average z-scores for predictions within the top 20% ranked for Consurf (〈zo〉 = 2.75), were lower then our standard ET server (〈zo〉 = 3.89), and the optimized ET (〈zo〉 = 4.20). We were also unable to obtain a pre-calculated result for PDB 1iyu. After adjusting for the missing protein, the standard ET server traces (〈zo〉 = 3.49) and optimized ET traces (〈zo〉 = 3.84) out-performed the Consurf results (〈zo〉 = 2.17). A complete comparison of the individual proteins making up the test set can be found in Supporting Information.
Acknowledgments
The authors thank Panos Katsonis and and Dan Morgan for helpful discussions contributing to the article. A.D.W., S.E. and R.M.W. were also supported by training fellowships from the National Library of Medicine to the Keck Center for Interdisciplinary Bioscience Training of the Gulf Coast Consortia.
Supplementary material
References
- 1.Lee D, Redfern O, Orengo C. Predicting protein function from sequence and structure. Nat Rev Mol Cell Biol. 2007;8:995–1005. doi: 10.1038/nrm2281. [DOI] [PubMed] [Google Scholar]
- 2.Laskowski RA, Thornton JM. Understanding the molecular machinery of genetics through 3D structures. Nat Rev Genet. 2008;9:141–145. doi: 10.1038/nrg2273. [DOI] [PubMed] [Google Scholar]
- 3.Jiang L, Althoff EA, Clemente FR, Doyle L, Röthlisberger D, Zanghellini A, Gallaher JL, Betker JL, Tanaka F, Barbas CF, Hilvert D, Houk KN, Stoddard BL, Baker D. De novo computational design of retro-aldol enzymes. Science. 2008;319:1387–1391. doi: 10.1126/science.1152692. [DOI] [PMC free article] [PubMed] [Google Scholar]
- 4.Thyme SB, Jarjour J, Takeuchi R, Havranek JJ, Ashworth J, Scharenberg AM, Stoddard BL, Baker D. Exploitation of binding energy for catalysis and design. Nature. 2009;461:1300–1304. doi: 10.1038/nature08508. [DOI] [PMC free article] [PubMed] [Google Scholar]
- 5.Hardy JA, Wells J. Searching for new allosteric sites in enzymes. Curr Opin Struct Biol. 2004;14:706–715. doi: 10.1016/j.sbi.2004.10.009. [DOI] [PubMed] [Google Scholar]
- 6.Matsumura M, Matthews B. Control of enzyme activity by an engineered disulfide bond. Science. 1989;243:792–794. doi: 10.1126/science.2916125. [DOI] [PubMed] [Google Scholar]
- 7.Clackson T, Wells JA. A hot spot of binding energy in a hormone-receptor interface. Science. 1995;267:383–386. doi: 10.1126/science.7529940. [DOI] [PubMed] [Google Scholar]
- 8.Onrust R, Herzmark P, Chi P, Garcia PD, Lichtarge O, Kingsley C, Bourne HR. Receptor and betagamma binding sites in the alpha subunit of the retinal G protein transducin. Science. 1997;275:381–384. doi: 10.1126/science.275.5298.381. [DOI] [PubMed] [Google Scholar]
- 9.Nobeli I, Favia AD, Thornton JM. Protein promiscuity and its implications for biotechnology. Nat Biotechnol. 2009;27:157–167. doi: 10.1038/nbt1519. [DOI] [PubMed] [Google Scholar]
- 10.Ota M, Kinoshita K, Nishikawa K. Prediction of catalytic residues in enzymes based on known tertiary structure, stability profile, and sequence conservation. J Mol Biol. 2003;327:1053–1064. doi: 10.1016/s0022-2836(03)00207-9. [DOI] [PubMed] [Google Scholar]
- 11.Marklund U, Lightfoot K, Cantrell D. Intracellular Location and Cell Context-Dependent Function of Protein Kinase D. Immunity. 2003;19:491–501. doi: 10.1016/s1074-7613(03)00260-7. [DOI] [PubMed] [Google Scholar]
- 12.Elcock A. Prediction of functionally important residues based solely on the computed energetics of protein structure. J Mol Biol. 2001;312:885–896. doi: 10.1006/jmbi.2001.5009. [DOI] [PubMed] [Google Scholar]
- 13.Ondrechen MJ, Clifton JG, Ringe D. THEMATICS: A simple computational predictor of enzyme function from structure. Proc Natl Acad Sci USA. 2001;98:12473–12478. doi: 10.1073/pnas.211436698. [DOI] [PMC free article] [PubMed] [Google Scholar]
- 14.Jones S, Shanahan H, Berman H, Thornton J. Using electrostatic potentials to predict DNA-binding sites on DNA-binding proteins. Nucleic Acids Res. 2003;31:7189–7198. doi: 10.1093/nar/gkg922. [DOI] [PMC free article] [PubMed] [Google Scholar]
- 15.Keskin O, Ma B, Nussinov R. Hot regions in protein–protein interactions: the organization and contribution of structurally conserved hot spot residues. J Mol Biol. 2005;345:1281–1294. doi: 10.1016/j.jmb.2004.10.077. [DOI] [PubMed] [Google Scholar]
- 16.Gutteridge A, Bartlett G, Thornton J. Using a neural network and spatial clustering to predict the location of active sites in enzymes. J Mol Biol. 2003;330:719–734. doi: 10.1016/s0022-2836(03)00515-1. [DOI] [PubMed] [Google Scholar]
- 17.delSol A, O'Meara P. Small-world network approach to identify key residues in protein-protein interaction. Proteins. 2005;58:672–682. doi: 10.1002/prot.20348. [DOI] [PubMed] [Google Scholar]
- 18.Lisewski AM, Lichtarge O. Rapid detection of similarity in protein structure and function through contact metric distances. Nucleic Acids Res. 2006;34:e152. doi: 10.1093/nar/gkl788. [DOI] [PMC free article] [PubMed] [Google Scholar]
- 19.Glaser F, Morris RJ, Najmanovich RJ, Laskowski RA, Thornton JM. A method for localizing ligand binding pockets in protein structures. Proteins. 2006;62:479–488. doi: 10.1002/prot.20769. [DOI] [PubMed] [Google Scholar]
- 20.Glaser F, Pupko T, Paz I, Bell R, Bechor-Shental D, Martz E, Ben-Tal N. ConSurf: identification of functional regions in proteins by surface-mapping of phylogenetic information. Bioinformatics. 2003;19:163–164. doi: 10.1093/bioinformatics/19.1.163. http://consurftauacil/ Available at. [DOI] [PubMed] [Google Scholar]
- 21.Pupko T, Bell RE, Mayrose I, Glaser F, Ben-Tal N. Rate4Site: an algorithmic tool for the identification of functional regions in proteins by surface mapping of evolutionary determinants within their homologues. Bioinformatics. 2002;18:S71–S77. doi: 10.1093/bioinformatics/18.suppl_1.s71. [DOI] [PubMed] [Google Scholar]
- 22.Valdar W. Scoring Residue Conservation. Proteins. 2002;43:227–241. doi: 10.1002/prot.10146. http://wwwebiacuk/thornton-srv/databases/cgi-bin/valdar/scorecons_serverpl Available at. [DOI] [PubMed] [Google Scholar]
- 23.Innis CA. siteFiNDER—3D: a web-based tool for predicting the location of functional sites in proteins. Nucleic Acids Res. 2007;35:W489–W494. doi: 10.1093/nar/gkm422. [DOI] [PMC free article] [PubMed] [Google Scholar]
- 24.Sankararaman S, Sjölander K. INTREPID–INformation-theoretic TREe traversal for Protein functional site IDentification. Bioinformatics. 2008;24:2445–2452. doi: 10.1093/bioinformatics/btn474. [DOI] [PMC free article] [PubMed] [Google Scholar]
- 25.Engelen S, Trojan LA, Sacquin-Mora S, Lavery R, Carbone A. Joint evolutionary trees: a large-scale method to predict protein interfaces based on sequence sampling. PLoS Comput Biol. 2009;5:e1000267. doi: 10.1371/journal.pcbi.1000267. [DOI] [PMC free article] [PubMed] [Google Scholar]
- 26.Halabi N, Rivoire O, Leibler S, Ranganathan R. Protein sectors: evolutionary units of three-dimensional structure. Cell. 2009;138:774–786. doi: 10.1016/j.cell.2009.07.038. [DOI] [PMC free article] [PubMed] [Google Scholar]
- 27.Lichtarge O, Bourne H, Cohen F. An evolutionary trace method defines binding surfaces common to protein families. J Mol Biol. 1996;257:342–358. doi: 10.1006/jmbi.1996.0167. [DOI] [PubMed] [Google Scholar]
- 28.Mihalek I, Reš I, Lichtarge O. A family of evolution-entropy hybrid methods for ranking protein residues by importance. J Mol Biol. 2004;336:1265–1282. doi: 10.1016/j.jmb.2003.12.078. [DOI] [PubMed] [Google Scholar]
- 29.Sowa M, He W, Slep K, Kercher A, Lichtarge O, Wensel T. Prediction and confirmation of a site critical for effector regulation of RGS domain activity. Nat Struct Biol. 2001;8:234–237. doi: 10.1038/84974. [DOI] [PubMed] [Google Scholar]
- 30.Madabushi S, Yao H, Marsh M, Kristensen D, Philippi A, Sowa M, Lichtarge O. Structural clusters of evolutionary trace residues are statistically significant and common in proteins. J Mol Biol. 2002;316:139–154. doi: 10.1006/jmbi.2001.5327. [DOI] [PubMed] [Google Scholar]
- 31.Yao H, Kristensen D, Mihalek I, Sowa M, Shaw C, Kavraki L, Kimmel M, Lichtarge O. An accurate, sensitive, and scalable method to identify functional sites in protein structures. J Mol Biol. 2003;326:255–261. doi: 10.1016/s0022-2836(02)01336-0. [DOI] [PubMed] [Google Scholar]
- 32.Mihalek I, Reš I, Yao H, Lichtarge O. Combining inference from evolution and geometric probability in protein structure evaluation. J Mol Biol. 2003;331:263–279. doi: 10.1016/s0022-2836(03)00663-6. [DOI] [PubMed] [Google Scholar]
- 33.Madabushi S, Gross A, Philippi A, Meng E, Wensel T, Lichtarge O. Evolutionary trace of G protein-coupled receptors reveals clusters of residues that determine global and class-specific functions. J Biol Chem. 2004;279:8126–8132. doi: 10.1074/jbc.M312671200. [DOI] [PubMed] [Google Scholar]
- 34.Ribes-Zamora A, Mihalek I, Lichtarge O, Bertuch AA. Distinct faces of the ku heterodimer mediate DNA repair versus telomeric functions. Nat Struct Mol Biol. 2007;14:301–307. doi: 10.1038/nsmb1214. [DOI] [PubMed] [Google Scholar]
- 35.Sowa ME, He W, Wensel T, Lichtarge O. A regulator of G protein signaling interaction surface linked to effector specificity. Proc Natl Acad Sci USA. 2000;97:1483–1488. doi: 10.1073/pnas.030409597. [DOI] [PMC free article] [PubMed] [Google Scholar]
- 36.Shenoy S, Drake M, Nelson C, Houtz D, Xiao K, Madabushi S, Reiter E, Premont R, Lichtarge O, Lefkowitz R. Beta-arrestin-dependent, G protein-independent ERK1/2 activation by the beta2 adrenergic receptor. J Biol Chem. 2006;281:261–273. doi: 10.1074/jbc.M506576200. [DOI] [PubMed] [Google Scholar]
- 37.Rajagopalan L, Patel N, Madabushi S, Goddard JA, Anjan V, Lin F, Shope C, Farrell B, Lichtarge O, Davidson AL, Brownell WE, Pereira FA. Essential helix interactions in the anion transporter domain of prestin revealed by evolutionary trace analysis. J Neurosci. 2006;26:12727–12734. doi: 10.1523/JNEUROSCI.2734-06.2006. [DOI] [PMC free article] [PubMed] [Google Scholar]
- 38.Kobayashi H, Ogawa K, Yao R, Lichtarge O, Bouvier M. Functional rescue of beta-adrenoceptor dimerization and trafficking by pharmacological chaperones. Traffic. 2009;10:1019–1033. doi: 10.1111/j.1600-0854.2009.00932.x. [DOI] [PMC free article] [PubMed] [Google Scholar]
- 39.Rost B. Twilight zone of protein sequence alignment. Protein Eng. 1999;12:85–94. doi: 10.1093/protein/12.2.85. [DOI] [PubMed] [Google Scholar]
- 40.Wilson C, Kreychman J, Gerstein M. Assessing annotation transfer for genomics: quantifying the relations between protein sequence, structure and function through traditional and probabilistic scores. J Mol Biol. 2000;297:233–249. doi: 10.1006/jmbi.2000.3550. [DOI] [PubMed] [Google Scholar]
- 41.Rost B. Enzyme function less conserved than anticipated. J Mol Biol. 2002;318:595–608. doi: 10.1016/S0022-2836(02)00016-5. [DOI] [PubMed] [Google Scholar]
- 42.Tian W, Skolnick J. How well is enzyme function conserved as a function of pairwise sequence identity. J Mol Biol. 2003;333:863–882. doi: 10.1016/j.jmb.2003.08.057. [DOI] [PubMed] [Google Scholar]
- 43.He Y, Chen Y, Bryan PN, Orban J. NMR structures of two designed proteins with high sequence identity but different fold and function. Proc Natl Acad Sci USA. 2008;105:14412–14417. doi: 10.1073/pnas.0805857105. [DOI] [PMC free article] [PubMed] [Google Scholar]
- 44.Mihalek I, Reš I, Lichtarge O. Evolutionary and structural feedback on selection of sequences for comparative analysis of proteins. Proteins. 2006;63:87–99. doi: 10.1002/prot.20866. [DOI] [PubMed] [Google Scholar]
- 45.Mihalek I, Reš I, Lichtarge O. A structure and evolution guided Monte Carlo sequence selection strategy for multiple alignment-based analysis of proteins. Bioinformatics. 2006;22:149–156. doi: 10.1093/bioinformatics/bti791. [DOI] [PubMed] [Google Scholar]
- 46.Yao H, Mihalek I, Lichtarge O. Rank information: a structure-independent measure of evolutionary trace quality that improves identification of protein functional sites. Proteins. 2006;65:111–123. doi: 10.1002/prot.21101. [DOI] [PubMed] [Google Scholar]
- 47.Ward RM, Erdin S, Tran TA, Kristensen DM, Lisewski AM, Erdin S, Lichtarge O. De-orphaning the structural proteome through reciprocal comparison of evolutionarily important structural features. PLoS ONE. 2008;3:e2136. doi: 10.1371/journal.pone.0002136. [DOI] [PMC free article] [PubMed] [Google Scholar]
- 48.Kristensen DM, Ward RM, Lisewski AM, Erdin S, Chen BY, Fofanov VY, Kimmel M, Kavraki LE, Lichtarge O. Prediction of enzyme function based on 3D templates of evolutionarily important amino acids. BCM Bioinformatics. 2008;9:17. doi: 10.1186/1471-2105-9-17. [DOI] [PMC free article] [PubMed] [Google Scholar]
- 49.Polacco BJ, Babbitt PC. Automated discovery of 3D motifs for protein function annotation. Bioinformatics. 2006;22:723–730. doi: 10.1093/bioinformatics/btk038. [DOI] [PubMed] [Google Scholar]
- 50.Erdin S, Ward RM, Venner E, Lichtarge O. Evolutionary trace annotation of protein function in the structural proteome. J Mol Biol. 2010;396:1451–1473. doi: 10.1016/j.jmb.2009.12.037. [DOI] [PMC free article] [PubMed] [Google Scholar]
- 51.Shenkin P, Erman B, Mastrandrea L. Information-theoretical entropy as a measure of sequence variability. Proteins. 1991;11:297–313. doi: 10.1002/prot.340110408. [DOI] [PubMed] [Google Scholar]
- 52.Altschul S, Madden T, Schaffer A, Zhang J, Zhang Z, Miller W, Lipman D. Gapped BLAST and PSI-BLAST: a new generation of protein database search programs. Nucleic Acids Res. 1997;25:3389–3402. doi: 10.1093/nar/25.17.3389. [DOI] [PMC free article] [PubMed] [Google Scholar]
- 53.Lapouge K, Smith SJ, Walker PA, Gamblin SJ, Smerdon SJ, Rittinger K. Structure of the TPR domain of p67phox in complex with RacGTP. Mol Cell. 2000;6:899–907. doi: 10.1016/s1097-2765(05)00091-2. [DOI] [PubMed] [Google Scholar]
- 54.de Vos AM, Ultsch M, Kossiakoff AA. Human growth hormone and extracellular domain of its receptor: crystal structure of the complex. Science. 1992;255:306–312. doi: 10.1126/science.1549776. [DOI] [PubMed] [Google Scholar]
- 55.Benedini S, Terruzzi I, Lazzarin A, Luzi L. Recombinant human growth hormone: rationale for use in the treatment of HIV-associated lipodystrophy. BioDrugs. 2008;22:101–112. doi: 10.2165/00063030-200822020-00003. [DOI] [PubMed] [Google Scholar]
- 56.Tallet E, Rouet V, Jomain JB, Kelly PA, Bernichtein S, Goffin V. Rational design of competitive prolactin/growth hormone receptor antagonists. J Mammary Gland Biol Neoplasia. 2008;13:105–117. doi: 10.1007/s10911-008-9066-8. [DOI] [PubMed] [Google Scholar]
- 57.delSol A, Pazos F, Valencia A. Automatic Methods for Predicting Functionally Important Residues. J Mol Biol. 2003;326:1289–1302. doi: 10.1016/s0022-2836(02)01451-1. [DOI] [PubMed] [Google Scholar]
- 58.Nimrod G, Schushan M, Steinberg DM, Ben-Tal N. Detection of functionally important regions in “hypothetical proteins” of known structure. Structure. 2008;16:1755–1763. doi: 10.1016/j.str.2008.10.017. [DOI] [PubMed] [Google Scholar]
- 59.Ivanisenko VA, Grigorovich DA, Kolchanov NA. 2000. pp. 171–174. PDBSite: a database on biologically active sites and their spatial surroundings in proteins with known tertiary structure. The Second International Conference on Bioinformatics of Genome Regulation and Structure (BGRS'2000), Novosibirsk, Russia, August 7–11, 2000, Vol. 2.
- 60.Wlodawer A, Svensson LA, Sjolin L, Gilliland GL. Structure of phosphate-free ribonuclease A refined at 126 A. Biochemistry. 1988;27:2705–2717. doi: 10.1021/bi00408a010. [DOI] [PubMed] [Google Scholar]
- 61.Ward RM, Venner E, Daines B, Murray S, Erdin S, Kristensen DM, Lichtarge O. Evolutionary trace annotation server: automated enzyme function prediction in protein structures using 3D templates. Bioinformatics. 2009;25:1426–1427. doi: 10.1093/bioinformatics/btp160. [DOI] [PMC free article] [PubMed] [Google Scholar]
- 62.Sheikh S, Zvyaga T, Lichtarge O, Sakmar T, Bourne H. Rhodopsin activation blocked by metal-ion-binding sites linking transmembrane helices C and F. Nature. 1996;383:347–350. doi: 10.1038/383347a0. [DOI] [PubMed] [Google Scholar]
- 63.Baameur F, Morgan D, Yao H, Tran T, Hammitt R, Sabui S, McMurray J, Lichtarge O, Clark R. Role for the RH Domain of GRK5 and 6 in beta2-adrenergic receptor and rhodopsin phosphorylation. Mol Pharmacol. 2010;77:405–415. doi: 10.1124/mol.109.058115. [DOI] [PMC free article] [PubMed] [Google Scholar]
- 64.Sheikh SP, Vilardarga J, Baranski T, Lichtarge O, Iiri T, Meng E, Nissenson R, Bourne H. Similar structures and shared switch mechanisms of the beta2-adrenoceptor and the parathyroid hormone receptor. zn(II) bridges between helices III and VI block activation. J Biol Chem. 1999;274:17033–17041. doi: 10.1074/jbc.274.24.17033. [DOI] [PubMed] [Google Scholar]
- 65.Quan X, Denayer T, Yan J, Jafar-Nejad H, Philippi A, Lichtarge O, Vleminckx K, Hassan B. Evolution of neural precursor selection: functional divergence of proneural proteins. Development. 2004;131:1679–1689. doi: 10.1242/dev.01055. [DOI] [PubMed] [Google Scholar]
- 66.Raviscioni M, Gu P, Sattar M, Cooney A, Lichtarge O. Correlated evolutionary pressure at interacting transcription factors and DNA response elements can guide the rational engineering of DNA binding specificity. J Mol Biol. 2005;350:402–415. doi: 10.1016/j.jmb.2005.04.054. [DOI] [PubMed] [Google Scholar]
- 67.Lichtarge O, Bourne H, Cohen F. Evolutionarily conserved Galphabetagamma binding surfaces support a model of the G protein-receptor complex. Proc Natl Acad Sci USA. 1996;93:1483–1488. doi: 10.1073/pnas.93.15.7507. [DOI] [PMC free article] [PubMed] [Google Scholar]
- 68.Rodriguez GJ, Yao R, Lichtarge O, Wensel T. Proc Natl Acad Sci. 17. Vol. 107. USA: 2010. Evolution-guided discovery and recoding of allosteric pathway specificity determinants in psychoactive bioamine receptors; pp. 7787–92. Apr 27. [DOI] [PMC free article] [PubMed] [Google Scholar]
- 69.Kabsch W, Sander C. Dictionary of protein secondary structure: pattern recognition of hydrogen-bonded and geometrical features. Biopolymers. 1993;22:2577–2637. doi: 10.1002/bip.360221211. [DOI] [PubMed] [Google Scholar]
- 70.Laskowski R, Chistyakov V, Thornton J. PDBSum more: new summaries and analyses of the known 3D structures of proteins and nucleic acids. Nucleic Acids Res. 2005;33:D266–D268. doi: 10.1093/nar/gki001. [DOI] [PMC free article] [PubMed] [Google Scholar]
- 71.Morgan DH, Kristensen DM, Mittleman D, Lichtarge O. ET viewer: an application for predicting and visualizing functional sites in protein structures. Bioinformatics. 2006;22(16):2049–50. doi: 10.1093/bioinformatics/btl285. Aug 15. [DOI] [PubMed] [Google Scholar]
- 72.Thompson J, Higgins D, Gibson T. CLUSTAL W: improving the sensitivity of progressive multiple sequence alignment through sequence weighting, position-specific gap penalties and weight matrix choice. Nucleic Acids Res. 1994;22:4673–4680. doi: 10.1093/nar/22.22.4673. [DOI] [PMC free article] [PubMed] [Google Scholar]
Associated Data
This section collects any data citations, data availability statements, or supplementary materials included in this article.


