Abstract
Since Cajal's early drawings, the characterization of neuronal architecture has been paramount in understanding neuronal function. With the development of electrophysiological techniques that provide unprecedented access to the physiology of these cells, experimental questions of neuronal function have also become more tractable. Fluorescent tracers that can label the anatomy of individual or populations of neurons have opened the door to linking anatomy with physiology. Experimentally however, current techniques for bulk labeling of cells in vitro often affect neuronal function creating a barrier for exploring structure-function questions. Here we describe a new technique for highly localized electroporation within a cell or cell population that enables the introduction of membrane impermeable charged dyes including dextran-conjugated fluorophores, hydrazide tracers, and calcium indicator dyes in vitro. We demonstrate that this technique is highly versatile, allowing for labeling of large or small areas of tissue, allowing for the investigation of both cellular morphology and physiological activity in identified neuronal circuits in acute brain slices. Furthermore, this approach allows subsequent targeted whole-cell patch recording based on well-defined connectivity as well as assessment of physiological activity in targeted circuits on a fast time scale.
Keywords: Electroporation, Electrophysiology, Immunohistochemistry, Neuroanatomy, Calcium Imaging, Circuit Reconstruction, Connectivity, Connectome, Networks, Neuronal Tracing
1. Introduction (584 Words)
Understanding neural circuit function is greatly facilitated by the simultaneous analysis of anatomical and physiological properties of the elements in these circuits. Previous approaches to this problem have focused mostly on simultaneous recordings of random pairs or triples of neurons (Le Be and Markram, 2006; Wang, Markram et al., 2006). Although powerful, this approach is limited in that the number of cells being recorded from is low, particularly when the specific neurons one wants to analyze are sparse and not easily identified by somatic position and shape. Alternative techniques enabling the examination of neural circuits and pathway tracing in vitro have several limitations, especially for slice electrophysiology.
In vivo bolus or electroporation loading techniques prior to brain removal (Bonnot, Mentis et al., 2005; Nagayama, Zeng et al., 2007; Stosiek, Garaschuk et al., 2003), are inefficient for targeted labeling of specific neuronal populations. Additionally, some individual neurons in particular circuits may be impossible to load, especially in deep brain areas. Alternative approaches in vitro carry with them their own limitations. Lipophilic carbocyanine dye traces can readily be taken up by nearby neurons in vitro, and have been widely used to label and trace individual neuronal morphology (Del Punta, Puche et al., 2002; Honig and Hume, 1986; Honig and Hume, 1989; Vonbartheld, Cunningham et al., 1990). However, these dyes have relatively slow diffusion rates and can often take several hours to label an entire neuron, which limits their ability to be used in targeted patch clamp recording experiments and also excludes the possibility of calcium dye loading and imaging of physiological activity.
The development of electroporation techniques that allow for the delivery of marcromolecules through the creation of transient pores in the plasma membrane, have been used in several brain preparations such as the whole cerebellum (Yang, Appleby et al., 2004), cerebellar organotypic slice cultures (Murphy and Messer, 2001), the spinal cord (Bonnot, Mentis et al., 2005), the brainstem (Barker, Billups et al., 2009), and the thalamic reticular nucleus (Pinault, 1996). However, these techniques often require the use of complex electroporation/pressure ejection machinery (Barker, Billups et al., 2009) or the placing of the slice between electrode plates (Bonnot, Mentis et al., 2005), platinum wires (Murphy and Messer, 2001), or in an electroporation chamber (Bright, Kuo et al., 1996), all of which can affect neuronal health, and accessibility for subsequent recording.
Here we describe a technique, adapted from previous in vivo work (Nagayama, Zeng et al. 2007) for labeling neurons that allows for subsequent targeting of the labeled cell for physiological analysis without the use of complex electroporation chambers or apparatuses. Specifically, we show that a local electroporation technique using a simple glass electrode filled with a charged dye can be used in in vitro brain slices to target and load a wide range of tissue areas to label either large or small populations of neurons that have overlapping axons and/or dendrites. This technique can be used to deliver virtually any charged dye into populations of neurons for visualization of specific neuronal subtypes and circuits, targeted whole-cell patch clamp recordings, and calcium imaging within a given circuit. Dye uptake and diffusion is rapid over long distances allowing for visualization and calcium imaging of processes hundreds of microns away from the electroporation site within the duration of a typical acute slice experiment. This approach will facilitate recording from pairs and even groups of neurons that are connected anatomically, allowing experimenters to sidestep labor intensive recording techniques to find connected pairs in slice, and rapidly identify microcircuits of interest.
2. Materials and Methods
2.1 Dye Solution Preparation
Several charged dyes were successfully used with our protocol (Table 1) such as dextran-conjugated dyes (Invitrogen) including Alexa Fluor 488, 594, and 647, Rhodamine Ruby Red and Oregon Green Bapta. We also used several hydrazide tracers (Invitrogen) such as Alexa Fluor 350, 488, 594 and 647. All dextran-conjugated dyes were generally soluble in aqueous buffers in 0.1M phosphate buffer (pH = 7.2). Given that their solubility decreases as their molecular weight increases, solutions were made for maximum solubility according to their molecular weight (50mg/ml for 10,000 MW dextrans, 25mg/ml for 70,000 MW dextrans, etc.) Solutions were then vortexed and sonicated and in some cases heated to increase solubility. If insoluble particles were seen at the tip of the electrode, the solution was centrifuged at 12,000 × g for 5 minutes before filling the electrode. Hydrazide dyes were made at 1mM in internal buffer solutions containing the following (in mM): 150 D-gluconic acid, 10 HEPES, 2 KCl – pH adjusted to 8.05 with KOH.
Table 1.
Comparison of Dyes Used
| Dextran Dyes | Concentration | Vortexed | Sonicated | Centrifuged |
|---|---|---|---|---|
| Rhodamine Ruby Red | 12% in PBS |

|

|
|
| Oregon Green Bapta | 5% in PBS |

|

|
|
| Alexa Fluor 594 | 7% in PBS |

|

|

|
| Hydrazide Dyes | Concentration | Vortexed | Sonicated | Centrifuged |
|---|---|---|---|---|
| Alexa Fluor 350 | 1mM in IBS |

|
||
| Alexa Fluor 488 | 1mM in IBS |

|
||
| Alexa Fluor 594 | 1mM in IBS |

|
||
| Alexa Fluor 647 | 1mM in IBS |

|
2.2 Electroporation protocol
Glass electrodes were pulled to a tip size of 1-5 μm and filled with 8-10 μl of dye solution and held with an MXP-Probe Holder (Siskiyou Design Instruments, Grant Pass, OR). A silver wire was inserted into the electrode so that the end of the wire was close (< 1 mm) to the tip of the electrode and immersed within the dye solution. The silver wire was connected to an SIU (stimulus isolation unit) (AMPI, Israel) controlled by TTL (transistor-transistor logic) pulses from an ITC-18 data acquisition board (Instrutech, Port Washington, NY) and the ground wire was connected to the bath ground. The electrode was then placed in the brain slice (~ 10 - 20 μm deep) in an area of interest. Different stimulus protocols were developed depending on experimental requirements. A high intensity stimulus protocol optimal for large scale loading of many neurons in a given area consisted of 1200 current pulses, given at 2 Hz, each 25 msec in duration at 30 to 40 μA each. Low intensity protocols, ideal for preserving the health of individual cells for electrophysiological recordings consisted of 100 current pulses, given at 2 Hz, each 25 msec in duration at 1-2 μA each.
2.3 Electrophysiology
Slices sectioned from young mice (post-natal day 12 to 30) were superfused with oxygenated Ringer's solution containing the following (in mM): 125 NaCl, 2.5 KCl, 25 NaHCO3, 1.25 NaH2PO4, 1MgCl2, 25 glucose, 2 CaCl2, warmed to 34-36° C. Whole-cell voltage recordings were obtained from the somata of identified filled cells and recordings were established using pipettes (resistances of 2-(in mM): 120 potassium gluconate, 2 KCl, 10 HEPES, 10 sodium phosphocreatine, 4 Mg-ATP, and 0.3 Na3GTP, adjusted to pH 7.3 with KOH. Voltage and current clamp recordings were performed using a MultiClamp 700A amplifier (Molecular Devices, Union City, CA). Data were filtered (4 kHz low pass) and digitized at 10 kHz using an ITC-18 (Instrutech, Mineola, NY) controlled by custom software written in Igor Pro (Wavemetrics, Lake Oswego, OR). Noisy stimulus pulses (DC = 400 pA, variance = 40 pA) were generated by convolving frozen white noise with an alpha function (Galan, 2008;Galan, Ermentrout et al., 2008;Mainen and Sejnowski, 1995).
2.4 Immunohistochemistry
After electroporation, each 300 μm section was fixed for 24 hours in 4% PFA and transferred to a 30% (in 0.1 M phosphate buffer) sucrose solution. Slices were then sectioned at 50 μm using a Leica cryostat SM2000R (Germany). Sections were transferred to 1 ml of 0.1 M phosphate buffer (PB). The solution was then replaced with 300 μl of PB with 2% normal donkey serum and 0.1% Triton X-100 at room temperature for 1hr. The sections were then washed 3X with PB incubating for 5 minutes each wash. The solution was then aspirated and replaced with the primary antibody (300 μl of 1:1000 Kv. 1.2 mouse antibody, NeuroMAB) in PB with 2% normal donkey serum and 0.05% Tween 20. After washing 3X again in PB, the solution was aspirated and replaced with the secondary antibody (300 μl of 1:600 donkey antibody mouse conjugated 488, Invitrogen) with 2% normal donkey serum and 0.05% Tween 20 and incubated for 1 hr in the dark and finally washed 3X in PB. The sections were then mounted in gelvatol for confocal imaging.
2.5 Calcium and Confocal Imaging
After electroporation and uptake of a calcium dye, extracellular stimulation of a nearby region was elicited using a theta glass electrode connected to an SIU box controlled by TTL pulses. Increases in fluorescence in loaded cell were visualized by a back-illuminated, cooled CCD camera (Princeton Instruments, Cascade 512B) in 3-s-long movies acquired using custom software written in Igor Pro. Movies were analyzed by calculating the ΔF/F versus time and analyzed to identify individually activated cells. Slices were then fixed in 4% paraformalydehyde for 24 hours and mounted for later confocal imaging. Confocal image stacks were acquired using a Zeiss LSM 610 Meta (1024 × 1024, 12-bit images) using 488, 561, and 633 lasers and BP 500-550IR, BP 575-630 IR, and 672-704 filters. Images were then processed and stacked using the Zen 2007 Software (Zeiss).
3. Results
3.1 Electroporation Enables Uptake of Various Dyes in Multiple Different Circuits
Slices containing either the cortex, the hippocampus, the main olfactory bulb, or the accessory olfactory bulb from mice were used to test the local electroporation method. Dextran-conjugated dyes were initially used to test the protocol in each brain area. Immediately after completion of the protocol, dye was present throughout the tissue in a larger area surrounding the electrode location, which eventually dissipated leaving only the area of tissue which had taken up the dye. The number of loaded cells varied greatly with the number of pulses given and with stimulation intensities. We eventually established two protocols, one with a greater number of pulses with higher amplitudes for loading large areas and numerous cells and another with much fewer pulses with smaller amplitudes for more focal targeting and labeling of a single or a few cells (see methods).
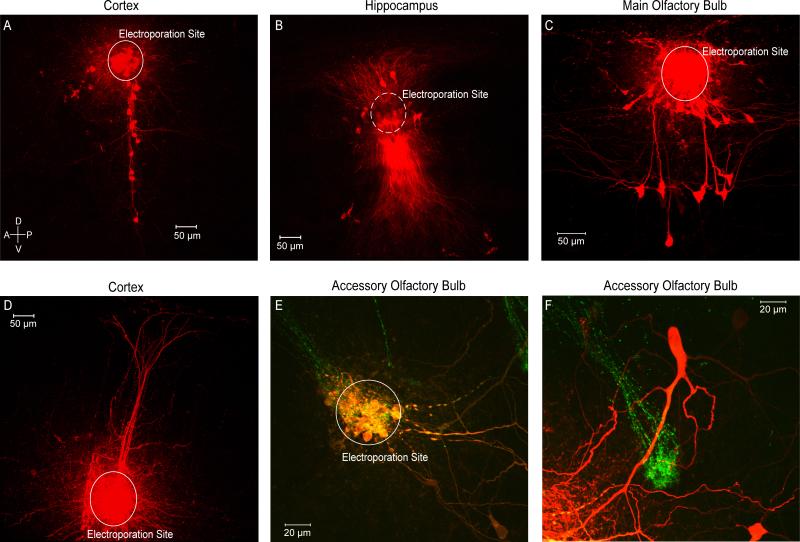
As a result, we were able to electroporate both large areas of the cortex, hippocampus and main olfactory bulb (Figure 1A-D), and also target loading to a fairly small and well-defined area using the low intensity protocol. As an example, we found that we could electroporate a single glomerulus (25 μm) as seen via a GFP-transgenic mouse line (Del Punta, Puche et al., 2002) in which sensory neurons expressing the V2r1b receptor type also express tau-GFP allowing us to observe axonal terminations in individual glomeruli in the accessory olfactory bulb (Figure 1E). In some instances, many cells deep to the stimulation electrode were labeled following electroporation. For example, in the CA3 region of the hippocampus, a confocal stack acquired starting just below the site of electroporation showed dense labeling of many cells (Figure 1B). Anterograde and retrograde projections were clearly visible in all circuits. Indeed we were able to visualize processes from loaded cells up to several hundred microns away from the site of electroporation (Figure 1D) as well as visualize the distinct morphology of individually loaded cells and their processes (Figure 1F). In all these examples, dye loading was complete within 25 – 30 minutes following the beginning of the electroporation.
Figure 1. Electroporation of Various Circuits.
A) Coronal slice containing barrel cortex was electroporated in layer 2/3 labeling the processes of several neurons in other cortical layers. B) Coronal slice containing hippocampus was electroporated in area CA1 labeling multiple pyramidal cells and their projections. C) Sagital slice containing the main olfactory bulb. A single glomerulus was electroporated labeling periglomerular, external tufted, and mitral cells all innervating the electroporated glomerulus. D) Coronal slice containing somatosensory cortex was electroporated in layer 5 labeling pyramidal cells and their projections towards layer 1. E) Sagittal slice containing the accessory olfactory bulb in a GFP-transgenic mouse line. A GFP-positive glomerulus was targeted and electroporated. F) A mitral cell labeled by electroporating the glomerulus in E shown beside a second GFP-positive glomerulus.
3.2 Electroporation Can Provide for Discrete Labeling of Specific Neuronal Circuits
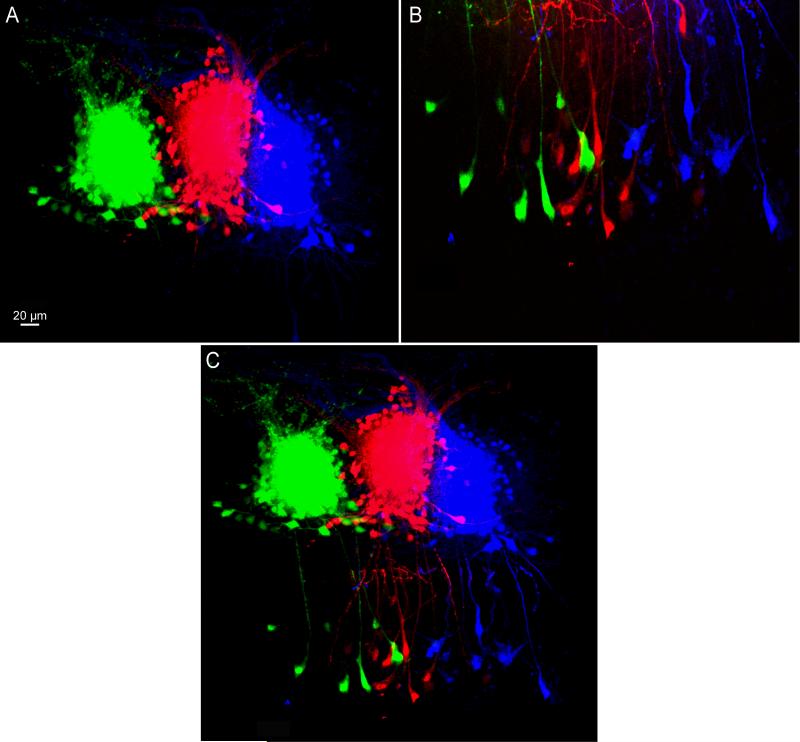
We used acute coronal brain slices to test whether this technique was capable of targeted electroporation of specific processing units, for instance the mitral cell to glomerular layer connections within the olfactory bulb. Three consecutive glomeruli were identified under DIC and targeted for electroporation using three separable hydrazide dyes (Alexa Fluor 488, 594, and 647). Each glomerulus was electroporated separately with a different electrode using the high intensity stimulation protocol (see methods). High intensity protocols typically labeled 3 - 10 mitral cells per glomerulus whereas low intensity protocols typically labeled only 1 - 2 (see Figure 5 and 6).
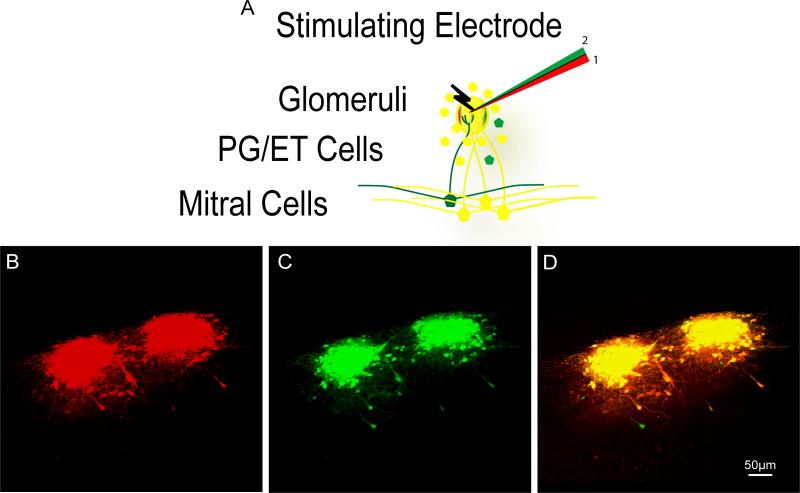
Figure 5. Completeness of Electroporation Protocol.
A) Schematic illustrating the experimental design using a theta glass electrode, each chamber filled with a differently colored dye. A given glomerulus was electroporated first with the red chamber and second with the green chamber. B) Confocal image stack of the red channel from two adjacent glomeruli which had been electroporated labeling many periglomerular, external tufted, and mitral cells. C) Confocal image stack of the green channel from the same two glomeruli in panel B. D) Overlap of both channels to observe the number of cells labeled only after the second electroporation protocol was given (green cells) and those labeled by both (yellow).
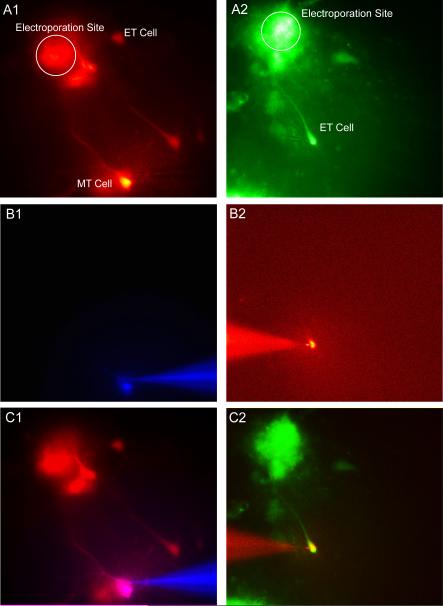
Figure 6. Targeted Whole-Cell Patch Clamp via Electroporation.
A1 & A2) Fluorescent images of two separate slices in which a single glomerulus was electroporated with Rhodamine Ruby Red (A1) and Oregon Green Bapta 488 (A2) labeling external tufted and mitral cells. B1 & B2) Fluorescence enabled targeted whole-cell patch clamping and filling with a second fluorescent dye, Alexa 350 (B1) and Alexa 594 (B2). C1 & C2) Overlay of A1 vs B1 and A2 vs B2 confirm cell identify.
We found that each glomerulus was individually labeled with surrounding periglomerular and external tufted cells (Figure 2A) as well as connected mitral cells for each glomerulus (Figure 2B). We found little to no overlap between electroporated glomeruli at the level of the glomerular layer for each labeled glomerulus (Figure 2A) consistent with the known anatomy of this system (Schoppa and Urban, 2003). The resultant mitral cell loading labeled unique populations with each population connecting exclusively to the corresponding electroporated glomerulus (Figure 2C). As a result, this technique allowed us to fluorescently identify individual processing units in the olfactory bulb.
Figure 2. Specificity of Electroporated Circuits.
A) A coronal slice showing three consecutive glomeruli electroporated with Alexa 448, 594, and 647 hydrazides respectively. B) Confocal image of the mitral cell layer with each representative population of mitral cells innervating each glomerulus from A labeled separately. C) Confocal image stitched from A and B displaying both the glomerular and mitral cell layers of the section. High intensity stimulation protocols were used for each glomerulus (1200 current pulses, 25 msec in duration at 2 Hz, 30 to 40 μA).
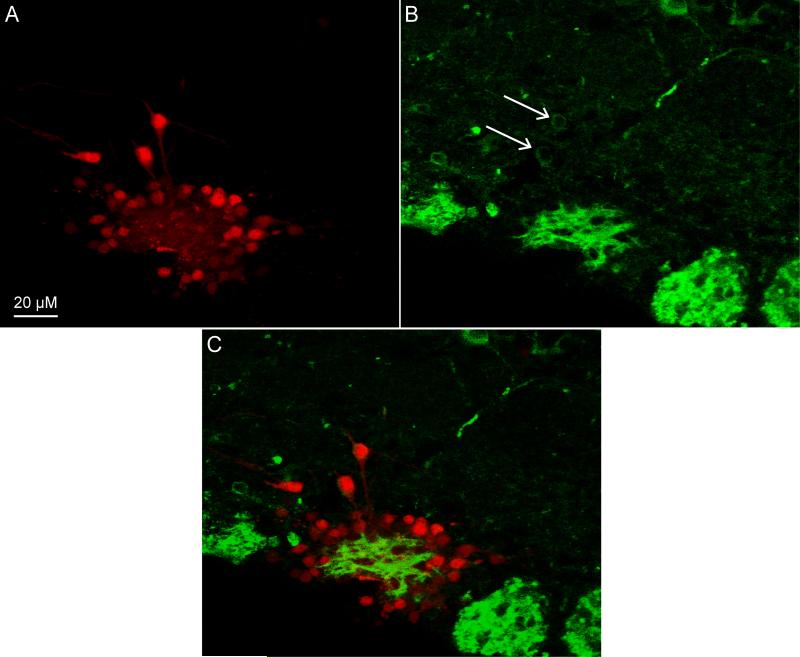
Following electroporation, we also performed immunohistochemistry on sections containing labeled cells. After staining for the potassium channel Kv. 1.2, we found that we could examine the expression of local potassium channels in specific populations of neurons by observing the overlap between labeled neurons via electroporation (Figure 3A) with immunohistochemistry (Figure 3B). Indeed, we observed overlap between labeled cells and Kv. 1.2 staining as seen in Figure 3C, where two electroporated external tufted cells also stained positive for Kv. 1.2 (arrows). This illustrates that this technique provides a useful tool for examining the overlap of the expression of individual proteins within local neuronal circuits of interest.
Figure 3. Electroporation-Coupled Immunohistochemistry.
A) Confocal images stack of a coronal slice containing the main olfactory bulb in which one glomerulus was electroporated labeling several periglomerular and external tufted cells. B) Confocal image stack of the same slice in A which was also stained for Kv. 1.2 potassium channels. Arrows indicated two nearby Kv. 1.2-positive cells. C) Overlay of A & B illustrating the expression of Kv. 1.2 potassium channels by these two external tufted cells which were also labeled via electroporation.
3.3 Rapid Uptake and Diffusion of Dye After Electroporation
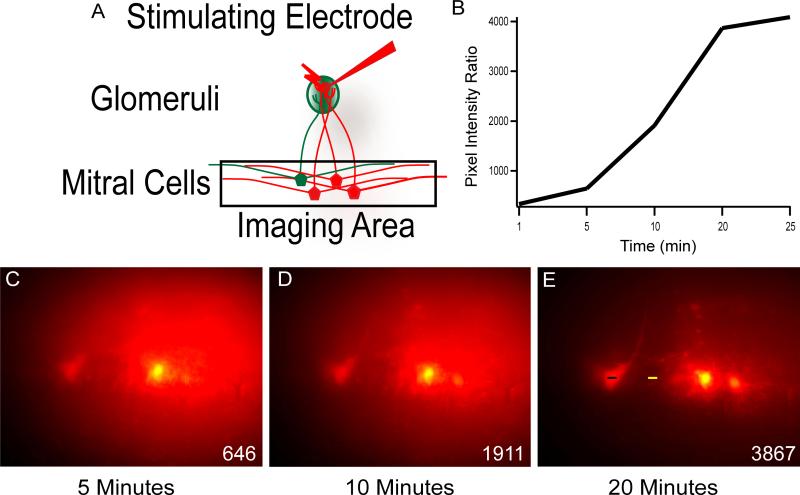
One of the major limitations of previous dye loading techniques such as the use of lipophilic dyes, including DiI, is the relatively slow uptake of dye and subsequent loading of somata and processes. For imaging approaches to be useful in slice electrophysiology experiments, both rapid uptake and diffusion of excess dye are essential for overall slice quality, the quality of whole-cell recordings, and calcium imaging of cellular activity. To assess the time required for dye uptake we acquired images at a series of time points following electroporation.
Immediately after the electroporation protocol we observed bright fluorescence through the tissue in the region in which the electrode had been placed. In a few minutes following electroporation, the fluorescence became less uniform presumably as the dye in the extracellular space diffused away, leaving behind labeled processes. Detectable levels of dye were seen in the somata of cells ≈200 μm away immediately after the completion of the electroporation protocol (data not shown). Sufficient levels for targeted whole-cell patch recordings were seen at 5 minutes post-hoc (Figure 4B & C).
Figure 4. Rapid Uptake and Diffusion of Dye.
A) Schematic illustrating the experimental design to observe and evaluate loading at various time intervals in the main olfactory bulb. The mitral cell layer was imaged after electroporating a single glomerulus. B) Graph of the ratio of pixel intensities measured at the soma divided by the background plotted against time after completion of the electroporation protocol. C-D) Fluorescent images of the mitral cell layer taken at 5, 10, and 20 minutes after electroporation of a glomerulus. Inset) The difference in pixel intensities between the cell body (black bar), and the surrounding tissue (yellow bar) was calculated for each time point.
We quantified this observation by calculating the ratio of pixel intensities across the cell body over the pixel intensities at a fixed point in the surrounding tissue. This ratio increased dramatically at each time point (Figure 4B) as the dye diffused towards the cell body, and the dye in the surround tissue was cleared. We found nearly complete diffusion of dye by 20 minutes after electroporation (Figure 4C-D). All experiments including calcium imaging and targeted whole-cell patch clamp recording were performed 15-25 minutes post electroporation.
For usefulness of this technique purely for anatomical purposes, we also wondered what fraction of the cells from the population projecting to a target region were labeled after a single electroporation protocol. As before, the glomerular system provided a perfect setting to answer this question by electroporating the same glomerulus twice with two differently colored dyes. To do this, we used a theta glass electrode, filling one chamber with Alexa 594 hydrazide, and the other chamber with Alexa 488 hydrazide (Figure 5A). We then electroporated a random glomerulus using the high intensity protocol with the red chamber only and observed the number of labeled periglomerular, external tufted, and mitral cells (Figure 5B).
Without moving the electrode, we then electroporated the same glomerulus with the same protocol using the green chamber to then observe the labeled cells from the second electroporation epoch (Figure 5C). If each electroporation protocol was 100% effective in labeling all cells projecting to a given glomerulus, we would expect all yellow cells. In fact, when we counted the number of labeled cells in each channel, we saw that, on average, 93% percent of labeled cells (29 Red, 32 Green in Glomerulus 1, 39 Red, 41 Green in Glomerulus 2), were labeled during the first electroporating epoch while the second electroporation epoch only labeled a combined 5 additional cells in both glomeruli (Figure 5D). This suggests that, at least for the high intensity protocol, each electroporation epoch is effective in labeling the vast majority of cells projecting into a target region.
3.4 Electroporation Enables Targeted Whole-Cell Patch Clamp While Preserving Cell Viability
Many slice electrophysiology experiments require the ability to target and record from cells based on their connectivity. This includes single cells or pairs of cells that innervate a particular layer or which send their dendrites to a particular layer. One example of such a system is the mouse olfactory system where the primary output neurons of the olfactory bulb, mitral cells, target a single primary dendrite typically to one glomerulus. Individual glomeruli are innervated by olfactory sensory neurons expressing a single receptor gene (Mombaerts, Wang et al., 1996; Ressler, Sullivan et al., 1994) such that all mitral cells innervating a given glomerulus receive homotypic input. Thus targeting cells based on the glomerular termination of their dendrites allow analysis of neurons that receive the same inputs and should have comparable receptive fields.
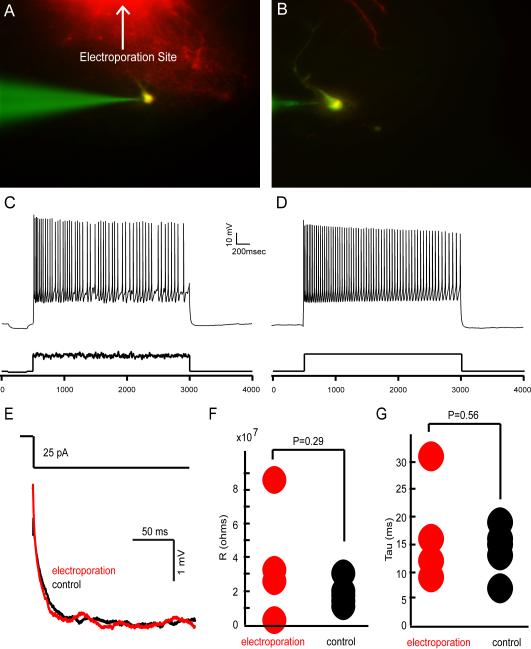
To determine if this technique would enable us to not only label multiple mitral cells innervating a given glomerulus, but to also use this fluorescence to target and record from those cells, we first electroporated random glomeruli in the main olfactory bulb using the low intensity stimulation protocol. We observed loading of (in most cases) surrounding periglomerular cells, external tufted cells, and typically 1 -2 mitral cells (Figure 6A1 & A2, Figure 7A & B). We used fluorescence to target labeled mitral cells/tufted cells for whole-cell patch clamp to record and fill these cells with a second fluorescent dye (Figure 6C1 & C2, Figure 7A & B). For patched mitral cells, we injected both square current pulses and filtered white noise current pulses (generated by convolving white noise with a 3 msec alpha function), to probe the responses of electroporated cells to various inputs (Figure 7C & D).
Figure 7. Electrophysiological Recordings from Electroporated Cells.
A & B) Two neurons which were electroporated and filled using a low intensity stimulus protocol (100 current pulses, 25 msec in duration at 2 Hz, 1-2 μA). Fluorescence was used to target individually labeled cells for whole-cell recordings. C & D) Cells were injected with noisy (C) or plain (D) current pulses (see methods) to evaluate the health of electroporated cells. E – G) The intrinsic properties of electroporated mitral cells were compared to control mitral cells. 25 pA hyperpolarizing currents were given and compared to control cells (E) and used to calculate and compare input resistances (F - control R=19±7 MΩ, electroporated R=37±34 MΩ, P=0.29 ANOVA) and the membrane time constants (G - control T=14±4.5 ms, electroporated T=7±9.8 ms, P=0.56 ANOVA).
To assess the effect of electroporation on the intrinsic properties of these mitral cells, we recorded the changes in membrane potentials in current clamp to 25 pA hyperpolarizing currents for 500 ms (Figure 7E). Input resistances were calculated when the membrane potential reached steady state (Figure 7F). Th fitting the membrane potential trace between the initial potential and the steady state potential using a mean-square error function (Figure 7G). We found no significant differences in the input resistance (control R=19±7 MΩ, electroporated R=37±34 MΩ, P=0.29 ANOVA) or membrane time constants (control T=14±4.5 ms, electroporated T=17±9.8 ms, P=0.56 ANOVA) between mitral cells recorded under control conditions (N=5) and those recorded after they had been electroporated (N=4). In addition, these values are consistent with previously reported values in vitro (Margrie, Sakmann et al., 2001).
3.5 Electroporation of Calcium Indicators Enables Calcium Imaging of Local Neuronal Circuits
We found that both high and low intensity protocols worked well with multiple dextran conjugated dyes and hydrazide dyes (see Table 1) and allowed for multi-dye loading within a given circuit. However, these fluorescent dyes only allow for morphological reconstruction and targeted whole-cell patch clamp recording of labeled neurons. To determine if our technique would also allow for the examination of physiological activity of multiple neurons within a circuit, we proceeded to label populations of neurons with a calcium indicator dye that serves as a proxy for neuronal activity via calcium imaging (Kerr, Greenberg et al., 2005; Ohki, Chung et al., 2005; Tank, Sugimori et al., 1988).
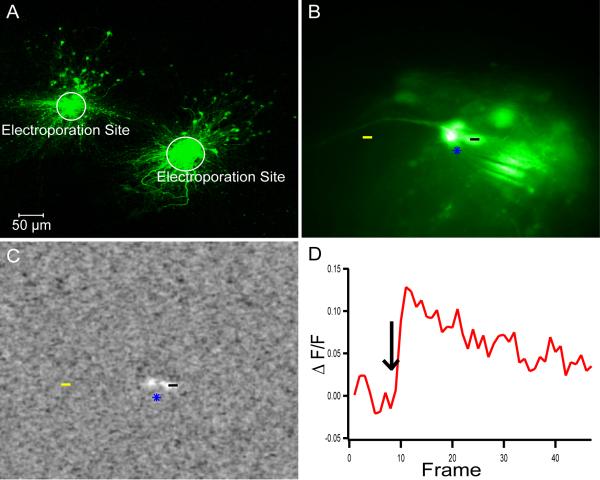
We choose dextran-conjugated Oregon Green Bapta as a calcium indicator and electroporated within the mitral cell layer in the accessory olfactory bulb. We found intense labeling of both mitral cells and granule cells within the bulb as a result (Figure 8A). In order to evoke activity within these neurons and to test whether the electroporated calcium indicator retained its calcium sensitivity, we placed a theta glass stimulation electrode nearby labeled mitral and granule cells (Figure 8B). Stimulation evoked calcium transients in nearby cells that had been loaded with Dextran-OGB (Figure 8C & D) indicating that electroporation of calcium-sensitive dyes could be used to study the physiological activity of targeted populations of neurons.
Figure 8. Calcium Activity in Local Neuronal Circuit.
A) Sagittal slices containing the accessory olfactory bulb were electroporated using Oregon Green Bapta in two separate locations in the mitral cells layer labeling both mitral cells and granule cells. B) Fluorescent image of a stimulating electrode (blue star) nearby several labeled mitral cells. C) Image stack of the average delta F/F at frame 11 during stimulation showing the increase in fluorescence of nearby mitral cells. D) The average delta F/F as a function of time calculated by subtracting the delta F/F of the background (yellow line) from the cell body (black line).
4. Discussion (1045 Words)
In summary, we provide a powerful technique for linking anatomical study of microcircuits with physiological exploration of the properties of the cells within those circuits. The paucity of tools available to slice electrophysiologists for the simple and efficient introduction of fluorescent dyes into specific groups of neurons within a circuit without compromising the cellular function of the neurons has rendered some questions in slice electrophysiology out of reach. We have shown that using simple glass electrodes and small current pulses, we could effectively expel a given dye while simultaneously electroporating local cell membranes to label and identify neurons in any given neural circuit. Furthermore, we demonstrate that the described method is highly versatile with regard to the brain areas that can be electroporated and also with regard to the diverse sets of fluorescent dyes and indicators that can be used. In addition, this technique provides a high degree of specificity of neurons targeted in a wide variety of circuits enabling the rapid identification of neurons while preserving cell viability for whole-cell recording of individual neurons. Taken together, this method provides the ability to examine neuronal morphology, target specific neurons for whole-cell patch clamp recording, and assess the physiological activity of groups of neurons using calcium sensitive dyes.
4.1 Current Electroporation Techniques
Electroporation is a widely used technique which has been used both in vitro and in vivo for rapid delivery of large macromolecules in the cell population such as DNA and siRNA (Boudes, Pieraut et al., 2008; Chu, Hayakawa et al., 1987; Haas, Sin et al., 2001; Potter, Weir et al., 1984; Tabata and Nakajima, 2001), fluorescent dyes (Lodovichi, Belluscio et al., 2003; Pinault, 1996), and calcium indicators (Bonnot, Mentis et al., 2005; Fujiwara, Kazawa et al., 2009; Nagayama, Zeng et al., 2007). However, as described previously, they are limited in their ability to target specific populations and require cumbersome and complex apparatuses. Others have used single-cell electroporation techniques for the loading of calcium indicators in individual neurons and also found they could preserve cell viability as seen via whole-cell recordings and evoked calcium transients (Nevian and Helmchen, 2007). Although this technique is useful for individual or small subsets of cells, it prevents the experimenter from labeling large populations of cells based on connectivity.
We have developed a technique that utilizes relatively low current injections from a simple electrode which not only eliminates the need for chambers or metal plates, but also enables targeted electroporation of small or large areas and structures in brain slices. This technique did not require building a complex electroporation apparatus and instead used equipment already used by electrophysiologists, namely glass electrodes and a bath ground used for slice electrophysiology. We have described two primary uses for this technique in slice electrophysiology; targeted labeling with hydrazide and dextran-conjugated fluorescent fluorophores for slice physiology and anatomical examination only, and targeted labeling of calcium dye indicators for evaluation of physiological activity of multiple neurons within a given circuit. There are several advantages to each of these methods over previously described recording, neuronal tracing, and calcium imaging techniques.
4.2 Comparison with Previous Electrophysiological Techniques
Throughout the nervous system, investigations into cell-specific changes in facilitation, depression, synchronization, activity-dependant gating of information, and many others, have gleaned information gained by utilizing techniques involving pairs and triple recordings of neurons in areas such as prefrontal cortex, hippocampus, somatosensory cortex and the olfactory bulb (Arevian, Kapoor et al., 2008; Hu, Vervaeke et al., 2009; Pelkey and Mcbain, 2007; Wang, Zhang et al., 2009). This often requires recording from connected pairs of neurons or neurons projecting or receiving input from common areas.
The technique described here provides several advantages to blind paired, triple, and even quadruple recordings from random neurons within a circuit. Electroporation of a given area of tissue provides the ability to identify neurons with overlapping axons and dendrites increasing the probability of identifying connected pairs of cells. Similarly, it provides the ability to identify even groups of neurons innervating a particular area, for example a particular layer of cortex or neurons which project to a particular region of CA1. Finally, it also provides the ability to target and record from neurons receiving the same input, for example from a particular glomerulus or alternatively to record from a nearby cell which has not been labeled, thus allowing for recordings from cells receiving input from two different glomeruli.
This technique also provides several advantages to current cellular tracing techniques. Whereas biocytin tracers fill the entire cell allowing for the reconstruction and analysis of morphology post-hoc, they prevent the ability to target recording based on fluorescence. DiI traces have been widely used to study the morphology of neurons which readily take up dye in a given region of tissue, and thereby label neurons which have overlapping axons and/or dendrites. However, this technique also prevents the targeted recording of labeled neurons via fluorescence, as complete loading of individual cells is extremely slow, compromising cell viability in acute slice experiments. Electroporation provides the best of each of these techniques, ensuring rapid uptake and dye diffusion for targeted recording from labeled cells while also providing for a variety of tracers for the reconstruction and analysis of morphology of electroporated cells.
In addition to characterizing neurons based on their structure, certain indicators can link neuronal activity to changes in fluorescence through intracellular reporter molecules. Calcium indicators are one such family of reporters, acting as a versatile tool in both in vivo and in vitro preparations to examine physiological activity of specific neuronal circuits. Particularly in slice electrophysiological experiments, calcium selective chelators which are temporarily made membrane permeable via masking of their carboxylates with ester groups have been widely used (Grynkiewicz, Poenie et al., 1985; Tsien, 1981) and provide widespread, surface loading of many cells within a given slice. However, these techniques often require long incubation times in detergents (Kapoor and Urban, 2006; Thomas, Tovey et al., 2000), which can compromise slice viability and prevents these techniques from being used on older animals. In addition, this technique only provides for non-specific loading of superficial cells. In contrast, the technique described here eliminates the need for long incubation times, enables loading of circuits even in older animals, and provides the possibility of penetration and loading of many deep cells in a specific population of interest.
Footnotes
Publisher's Disclaimer: This is a PDF file of an unedited manuscript that has been accepted for publication. As a service to our customers we are providing this early version of the manuscript. The manuscript will undergo copyediting, typesetting, and review of the resulting proof before it is published in its final citable form. Please note that during the production process errors may be discovered which could affect the content, and all legal disclaimers that apply to the journal pertain.
Reference List
- Arevian AC, Kapoor V, Urban NN. Activity-dependent gating of lateral inhibition in the mouse olfactory bulb. Nature neuroscience. 2008;11:80–7. doi: 10.1038/nn2030. [DOI] [PMC free article] [PubMed] [Google Scholar]
- Barker M, Billups B, Hamann M. Focal macromolecule delivery in neuronal tissue using simultaneous pressure ejection and local electroporation. Journal of Neuroscience Methods. 2009;177:273–84. doi: 10.1016/j.jneumeth.2008.10.021. [DOI] [PMC free article] [PubMed] [Google Scholar]
- Bonnot AS, Mentis GZ, Skoch J, O'Donovan MJ. Electroporation loading of calcium-sensitive dyes into the CNS. Journal of neurophysiology. 2005;93:1793–808. doi: 10.1152/jn.00923.2004. [DOI] [PubMed] [Google Scholar]
- Boudes M, Pieraut S, Valmier J, Carroll P, Scamps F. Single-cell electroporation of adult sensory neurons for gene screening with RNA interference mechanism. Journal of Neuroscience Methods. 2008;170:204–11. doi: 10.1016/j.jneumeth.2008.01.018. [DOI] [PubMed] [Google Scholar]
- Bright GR, Kuo NT, Chow D, Burden S, Dowe C, Przybylski RJ. Delivery of macromolecules into adherent cells via electroporation for use in fluorescence spectroscopic imaging and metabolic studies. Cytometry. 1996;24:226–33. doi: 10.1002/(SICI)1097-0320(19960701)24:3<226::AID-CYTO5>3.0.CO;2-F. [DOI] [PubMed] [Google Scholar]
- Chu G, Hayakawa H, Berg P. Electroporation for the Efficient Transfection of Mammalian-Cells with Dna. Nucleic Acids Research. 1987;15:1311–26. doi: 10.1093/nar/15.3.1311. [DOI] [PMC free article] [PubMed] [Google Scholar]
- Del Punta K, Puche A, Adams NC, Rodriguez I, Mombaerts P. A divergent pattern of sensory axonal projections is rendered convergent by second-order neurons in the accessory olfactory bulb. Neuron. 2002;35:1057–66. doi: 10.1016/s0896-6273(02)00904-2. [DOI] [PubMed] [Google Scholar]
- Fujiwara T, Kazawa T, Haupt SS, Kanzaki R. Ca2+ imaging of identifiable neurons labeled by electroporation in insect brains. Neuroreport. 2009;20:1061–5. doi: 10.1097/WNR.0b013e32832e7d93. [DOI] [PubMed] [Google Scholar]
- Galan RF. On How Network Architecture Determines the Dominant Patterns of Spontaneous Neural Activity. Plos One. 2008:3. doi: 10.1371/journal.pone.0002148. [DOI] [PMC free article] [PubMed] [Google Scholar]
- Galan RF, Ermentrout GB, Urban NN. Optimal time scale for spike-time reliability: Theory, simulations, and experiments. Journal of Neurophysiology. 2008;99:277–83. doi: 10.1152/jn.00563.2007. [DOI] [PMC free article] [PubMed] [Google Scholar]
- Grynkiewicz G, Poenie M, Tsien RY. A New Generation of Ca-2+ Indicators with Greatly Improved Fluorescence Properties. Journal of Biological Chemistry. 1985;260:3440–50. [PubMed] [Google Scholar]
- Haas K, Sin WC, Javaherian A, Li Z, Cline HT. Single-cell electroporation for gene transfer in vivo. Neuron. 2001;29:583–91. doi: 10.1016/s0896-6273(01)00235-5. [DOI] [PubMed] [Google Scholar]
- Honig MG, Hume RI. Fluorescent Carbocyanine Dyes Allow Living Neurons of Identified Origin to be Studied in Long-Term Cultures. Journal of Cell Biology. 1986;103:171–87. doi: 10.1083/jcb.103.1.171. [DOI] [PMC free article] [PubMed] [Google Scholar]
- Honig MG, Hume RI. Dil and Dio - Versatile Fluorescent Dyes for Neuronal Labeling and Pathway Tracing. Trends in neurosciences. 1989;12:333–&. [PubMed] [Google Scholar]
- Hu H, Vervaeke K, Graham LJ, Storm JF. Complementary Theta Resonance Filtering by Two Spatially Segregated Mechanisms in CA1 Hippocampal Pyramidal Neurons. Journal of Neuroscience. 2009;29:14472–83. doi: 10.1523/JNEUROSCI.0187-09.2009. [DOI] [PMC free article] [PubMed] [Google Scholar]
- Kapoor V, Urban NN. Glomerulus-specific, long-latency activity in the olfactory bulb granule cell network. J Neurosci. 2006;26:11709–19. doi: 10.1523/JNEUROSCI.3371-06.2006. [DOI] [PMC free article] [PubMed] [Google Scholar]
- Kerr JND, Greenberg D, Helmchen F. Imaging input and output of neocortical networks in vivo. Proceedings of the National Academy of Sciences of the United States of America. 2005;102:14063–8. doi: 10.1073/pnas.0506029102. [DOI] [PMC free article] [PubMed] [Google Scholar]
- Le Be JV, Markram H. Spontaneous and evoked synaptic rewiring in the neonatal neocortex. Proceedings of the National Academy of Sciences of the United States of America. 2006;103:13214–9. doi: 10.1073/pnas.0604691103. [DOI] [PMC free article] [PubMed] [Google Scholar]
- Lodovichi C, Belluscio L, Katz LC. Functional topography of connections linking mirror-symmetric maps in the mouse olfactory bulb. Neuron. 2003;38:265–76. doi: 10.1016/s0896-6273(03)00194-6. [DOI] [PubMed] [Google Scholar]
- Mainen ZF, Sejnowski TJ. Reliability of Spike Timing in Neocortical Neurons. Science. 1995;268:1503–6. doi: 10.1126/science.7770778. [DOI] [PubMed] [Google Scholar]
- Margrie TW, Sakmann B, Urban NN. Action potential propagation in mitral cell lateral dendrites is decremental and controls recurrent and lateral inhibition in the mammalian olfactory bulb. Proceedings of the National Academy of Sciences of the United States of America. 2001;98:319–24. doi: 10.1073/pnas.011523098. [DOI] [PMC free article] [PubMed] [Google Scholar]
- Mombaerts P, Wang F, Dulac C, Chao SK, Nemes A, Mendelsohn M, Edmondson J, Axel R. Visualizing an olfactory sensory map. Cell. 1996;87:675–86. doi: 10.1016/s0092-8674(00)81387-2. [DOI] [PubMed] [Google Scholar]
- Murphy RC, Messer A. Gene transfer methods for CNS organotypic cultures: A comparison of three nonviral methods. Molecular Therapy. 2001;3:113–21. doi: 10.1006/mthe.2000.0235. [DOI] [PubMed] [Google Scholar]
- Nagayama S, Zeng S, Xiong W, Fletcher ML, Masurkar AV, Davis DJ, Pieribone VA, Chen WR. In vivo simultaneous tracing and Ca(2+) imaging of local neuronal circuits. Neuron. 2007;53:789–803. doi: 10.1016/j.neuron.2007.02.018. [DOI] [PMC free article] [PubMed] [Google Scholar]
- Nevian T, Helmchen F. Calcium indicator loading of neurons using single-cell electroporation. Pflugers Archiv-European Journal of Physiology. 2007;454:675–88. doi: 10.1007/s00424-007-0234-2. [DOI] [PubMed] [Google Scholar]
- Ohki K, Chung S, Ch'Ng YH, Kara P, Reid RC. Functional imaging with cellular resolution reveals precise micro-architecture in visual cortex. Nature. 2005;433:597–603. doi: 10.1038/nature03274. [DOI] [PubMed] [Google Scholar]
- Pelkey KA, Mcbain CJ. Differential regulation at functionally divergent release sites along a common axon. Current opinion in neurobiology. 2007;17:366–73. doi: 10.1016/j.conb.2007.04.008. [DOI] [PubMed] [Google Scholar]
- Pinault D. A novel single-cell staining procedure performed in vivo under electrophysiological control: Morpho-functional features of juxtacellularly labeled thalamic cells and other central neurons with biocytin or Neurobiotin. Journal of Neuroscience Methods. 1996;65:113–36. doi: 10.1016/0165-0270(95)00144-1. [DOI] [PubMed] [Google Scholar]
- Potter H, Weir L, Leder P. Enhancer-Dependent Expression of Human Kappa-Immunoglobulin Genes Introduced Into Mouse Pre-B Lymphocytes by Electroporation. Proceedings of the National Academy of Sciences of the United States of America-Biological Sciences. 1984;81:7161–5. doi: 10.1073/pnas.81.22.7161. [DOI] [PMC free article] [PubMed] [Google Scholar]
- Ressler KJ, Sullivan SL, Buck LB. Information coding in the olfactory system: evidence for a stereotyped and highly organized epitope map in the olfactory bulb. Cell. 1994;79:1245–55. doi: 10.1016/0092-8674(94)90015-9. [DOI] [PubMed] [Google Scholar]
- Schoppa NE, Urban NN. Dendritic processing within olfactory bulb circuits. Trends in neurosciences. 2003;26:501–6. doi: 10.1016/S0166-2236(03)00228-5. [DOI] [PubMed] [Google Scholar]
- Stosiek C, Garaschuk O, Holthoff K, Konnerth A. In vivo two-photon calcium imaging of neuronal networks. Proceedings of the National Academy of Sciences of the United States of America. 2003;100:7319–24. doi: 10.1073/pnas.1232232100. [DOI] [PMC free article] [PubMed] [Google Scholar]
- Tabata H, Nakajima K. Efficient in utero gene transfer system to the developing mouse brain using electroporation: Visualization of neuronal migration in the developing cortex. Neuroscience. 2001;103:865–72. doi: 10.1016/s0306-4522(01)00016-1. [DOI] [PubMed] [Google Scholar]
- Tank DW, Sugimori M, Connor JA, Llinas RR. Spatially Resolved Calcium Dynamics of Mammalian Purkinje-Cells in Cerebellar Slice. Science. 1988;242:773–7. doi: 10.1126/science.2847315. [DOI] [PubMed] [Google Scholar]
- Thomas D, Tovey SC, Collins TJ, Bootman MD, Berridge MJ, Lipp P. A comparison of fluorescent Ca2+ indicator properties and their use in measuring elementary and global Ca2+ signals. Cell Calcium. 2000;28:213–23. doi: 10.1054/ceca.2000.0152. [DOI] [PubMed] [Google Scholar]
- Tsien RY. A Non-Disruptive Technique for Loading Calcium Buffers and Indicators Into Cells. Nature. 1981;290:527–8. doi: 10.1038/290527a0. [DOI] [PubMed] [Google Scholar]
- Vonbartheld CS, Cunningham DE, Rubel EW. Neuronal Tracing with Dii - Decalcification, Cryosectioning, and Photoconversion for Light and Electron-Microscopic Analysis. Journal of Histochemistry & Cytochemistry. 1990;38:725–33. doi: 10.1177/38.5.2185313. [DOI] [PubMed] [Google Scholar]
- Wang Y, Markram H, Goodman PH, Berger TK, Ma JY, Goldman-Rakic PS. Heterogeneity in the pyramidal network of the medial prefrontal cortex. Nature neuroscience. 2006;9:534–42. doi: 10.1038/nn1670. [DOI] [PubMed] [Google Scholar]
- Wang Y, Zhang GP, Zhou HW, Barakat A, Querfurth H. Opposite Effects of Low and High Doses of A beta 42 on Electrical Network and Neuronal Excitability in the Rat Prefrontal Cortex. Plos One. 2009:4. doi: 10.1371/journal.pone.0008366. [DOI] [PMC free article] [PubMed] [Google Scholar]
- Yang ZJ, Appleby VJ, Coyle B, Chan WI, Tahmaseb M, Wigmore PM, Scotting PJ. Novel strategy to study gene expression and function in developing cerebellar granule cells. Journal of Neuroscience Methods. 2004;132:149–60. doi: 10.1016/j.jneumeth.2003.09.031. [DOI] [PubMed] [Google Scholar]


