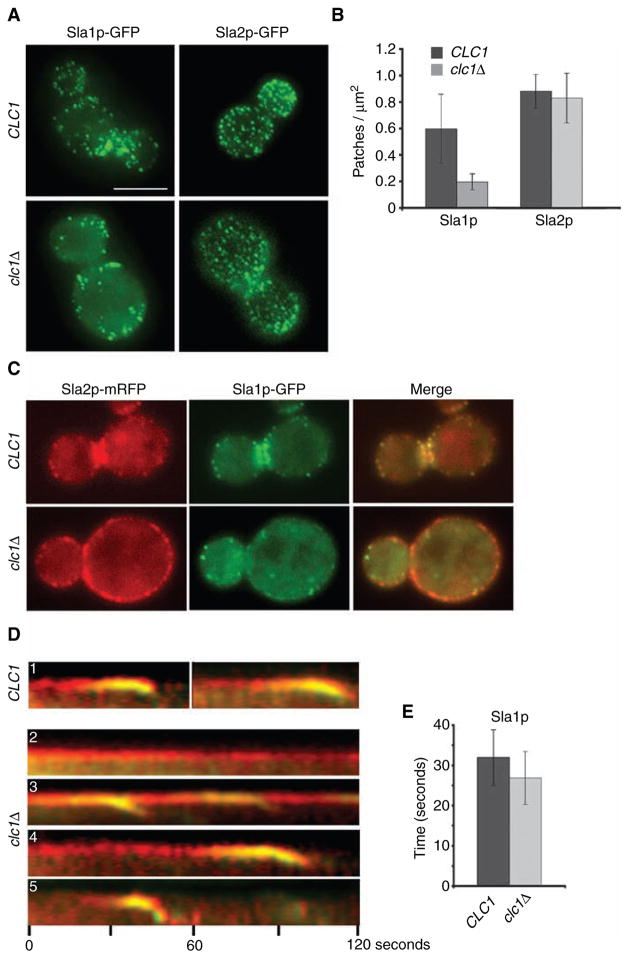
Figure 6. Sla1p, but not Sla2p, shows decreased patch lifetime and cortical recruitment in clathrin mutants.
(A) WT SLA1-GFP (SL5318), clc1Δ SLA1-GFP (SL5317), WT SLA2-GFP (SL4781) and clc1Δ SLA2-GFP (SL4782) were viewed using wide-field microscopy. Z stacks were collected at an interval of 0.25 μm, and the maximum intensity projection is shown in all panels, except for clc1Δ SLA2-GFP, as the presence of large Sla2p-GFP patches led to the exclusion of weak intensity Sla2p-GFP patches in the projection image. In this case, a single plane from the z-axis focused on the cell surface is shown. (B) Quantification of Sla1p-GFP and Sla2p-GFP patches/μm2 in WT and clc1Δ cells from (A). Note the difference between WT and clc1Δ for Sla1p-GFP (p < 0.001) but not Sla2p-GFP (p > 0.2) (n ≈ 17 cells per strain). (C–D) WT SLA1-GFP SLA2-mRFP (SL5318) and clc1Δ SLA1-GFP SLA2-mRFP (SL5317) were viewed using wide-field microscopy, and time-lapse images were collected every 2 seconds. Note different types of patch dynamics in clathrin mutants: (D1) Sla2p and Sla1p in WT cells; (D2) immobile Sla2p patches without Sla1p; (D3) Sla2p patches recruiting Sla1p and repeated patch internalization from the same site; (D4) Sla2p patches with extended lifetimes that acquire Sla1p and internalize and (D5) relatively normal Sla2p lifetime with shortened Sla1p lifetime. (E) Bar graph showing difference in patch lifetimes of Sla1p-GFP between WT (SL5318, n = 30) and clc1Δ (SL5317, n = 37) (p < 0.005). Scale bar = 5 μm.

