Abstract
Intracellular trafficking of the glucose transporter GLUT4 from storage compartments to the plasma membrane is triggered in muscle and fat during the body’s response to insulin. Clathrin is involved in intracellular trafficking and the CHC22 isoform is highly expressed in skeletal muscle. Here we found a role for CHC22 in formation of insulin-responsive GLUT4 compartments in human muscle and adipocytes. CHC22 also associated with expanded GLUT4 compartments in muscle from type 2 diabetic patients. Tissue-specific introduction of CHC22 in mice, which have only a pseudogene for this protein, caused aberrant localization of GLUT4 transport pathway components in their muscle, as well as features of diabetes. Thus CHC22-dependent membrane trafficking constitutes a species-restricted pathway in human muscle and fat with potential significance for type 2 diabetes.
Insulin signaling in skeletal muscle and fat stimulates export of the GLUT4 glucose transporter from intracellular storage compartments to the plasma membrane to clear glucose from the bloodstream (1–4). GLUT4 membrane trafficking is disrupted in some forms of human type 2 diabetes leading to increased intracellular sequestration (5, 6). Clathrin forms a protein coat on intracellular membrane vesicles and facilitates selective transport of proteins during membrane trafficking. There are two isoforms of clathrin heavy chain in humans, each named for the encoding human chromosome. The CHC22 isoform is highly expressed in skeletal muscle relative to other tissues, suggesting a potential role in GLUT4 transport (7). The more uniformly expressed CHC17 isoform participates in endocytosis and lysosome biogenesis in all cells and some aspects of GLUT4 transport (3, 4, 8, 9). The two clathrin isoforms have distinct intracellular distributions and biochemical properties (10, 11) and there is evolutionary conservation of sequence differences between isoforms in the vertebrate lineage. However, the gene encoding CHC22 is a pseudogene in mice (12).
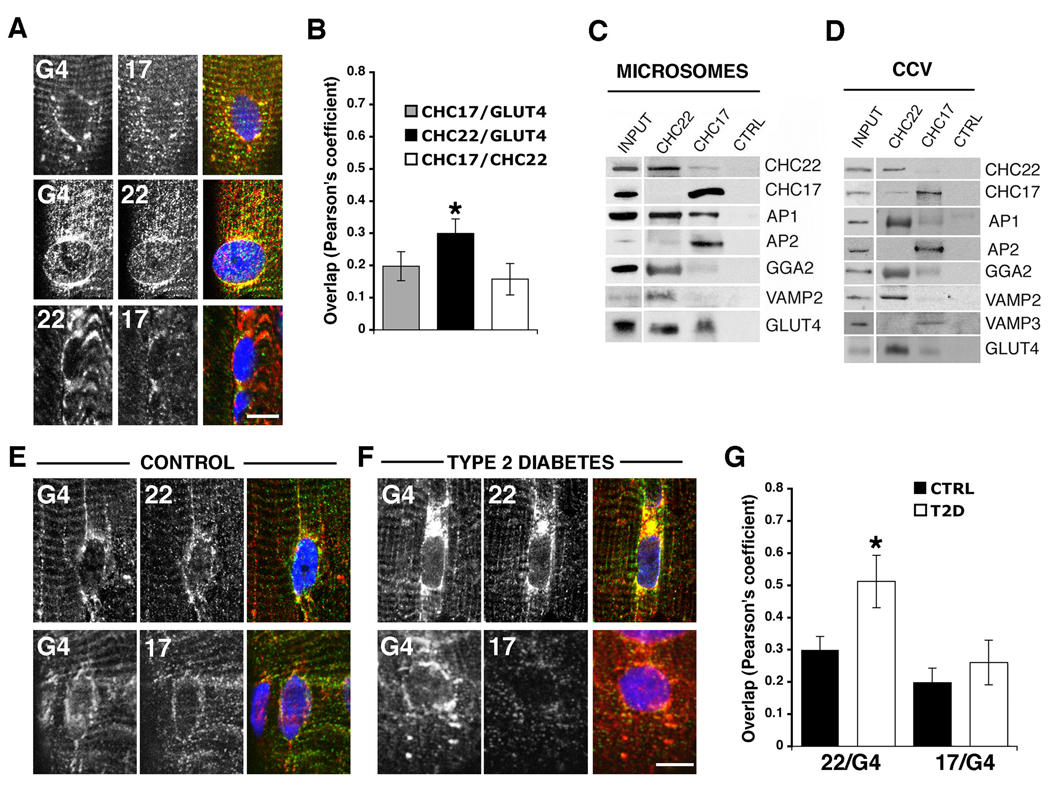
To investigate the hypothesized role for CHC22 in human GLUT4 transport and whether it is distinct from that of CHC17, both clathrins and markers of the GLUT4 storage compartment (GSC) were localized in skeletal muscle (Fig. 1). Using new antibodies against GLUT4 and CHC22 we were able to extend earlier inconclusive analyses (11, 13) and found higher co-localization between CHC22 and GLUT4 than between CHC17 and GLUT4 (Fig. 1, A and B). Adaptor proteins link clathrin to membranes and to vesicle cargo (14), which includes vesicle-associated membrane proteins (VAMPs) involved in vesicle fusion (15), as well as transporters and receptors. The two clathrins showed differential binding to adaptors and cargo involved in GLUT4 transport when immunoisolated from solubilized muscle membrane preparations (Fig. 1, C and D). CHC22 bound the adaptor protein GGA2 (Golgi-associated, gamma adaptin ear-containing, ADP ribosylation factor (ARF)-binding protein 2) implicated in targeting intracellular GLUT4 to the GSC (16) and VAMP2, which mediates fusion of GLUT4-containing vesicles with the plasma membrane (17). Association of these proteins with CHC17 was barely detectable in muscle, which clearly co-precipitated VAMP3 and the plasma membrane adaptor protein complex AP2, neither of which associated with CHC22. Lack of CHC22 interaction with AP2 was observed in earlier studies that showed no function for CHC22 in endocytosis (10). The adaptor protein complex AP1, which is implicated in intracellular GLUT4 targeting to the GSC (18) and in CHC17 function in the trans-Golgi network (TGN) (14) was associated with both clathrins, as was GLUT4. Protein interactions and localization of each clathrin were supported by immunofluorescence, which also revealed co-localization of CHC22 with the insulin-regulated amino peptidase (IRAP), another marker of the GSC (19) (fig. S1, A to D).
Fig. 1.
Association of CHC22 with components of the GLUT4 transport pathway. (A) GLUT4 (G4, red) and CHC17 (17, green) or CHC22 (22, green) in human skeletal muscle (top rows). CHC22 (red) and CHC17 (green), bottom. (B) Overlap between red and green illustrated in A (N=5–10). (C) Immunoblot of proteins associated with CHC22, CHC17 or isotype-matched control (CTRL) immunoprecipitates from human muscle microsomes and 1–5% microsome input. (D) Immunoblot of proteins associated with CHC22, CHC17 or CTRL immunoprecipitates from muscle clathrin-coated vesicles (CCV) and 10% CCV input. (E) GLUT4 (G4, red) and CHC22 (22, green) or CHC17 (17, green) in skeletal muscle from a control healthy subject. (F) GLUT4 (red) and CHC22 (22, green) or CHC17 (17, green) in skeletal muscle from patient 1 with type 2 diabetes (T2D) (patient and control details in fig. S1E). (G) Overlap between red and green illustrated in E and F (N=5–10). For panels A, E, and F, each row shows individual antibody labeling (grayscale) and the merge (color). Yellow indicates co-localization. Scale bars, 10µm. Asterisks (B and G) indicate statistical significance (p<0.05, (13)).
In muscle sections from three type 2 diabetic patients, CHC22 was associated with GLUT4 compartments that were expanded compared to non-diabetic samples (Fig. 1, E to G and fig. S2, A and B). Co-localization between GLUT4 and CHC22 was increased in the muscle of diabetic patients to a greater extent than observed between CHC17 and GLUT4. Thus, CHC22 associates with GLUT4 and trafficking components involved in intracellular biogenesis and function of the GSC. In contrast, CHC17 clathrin associates with the AP2 adaptor that mediates endocytic GLUT4 traffic (9).
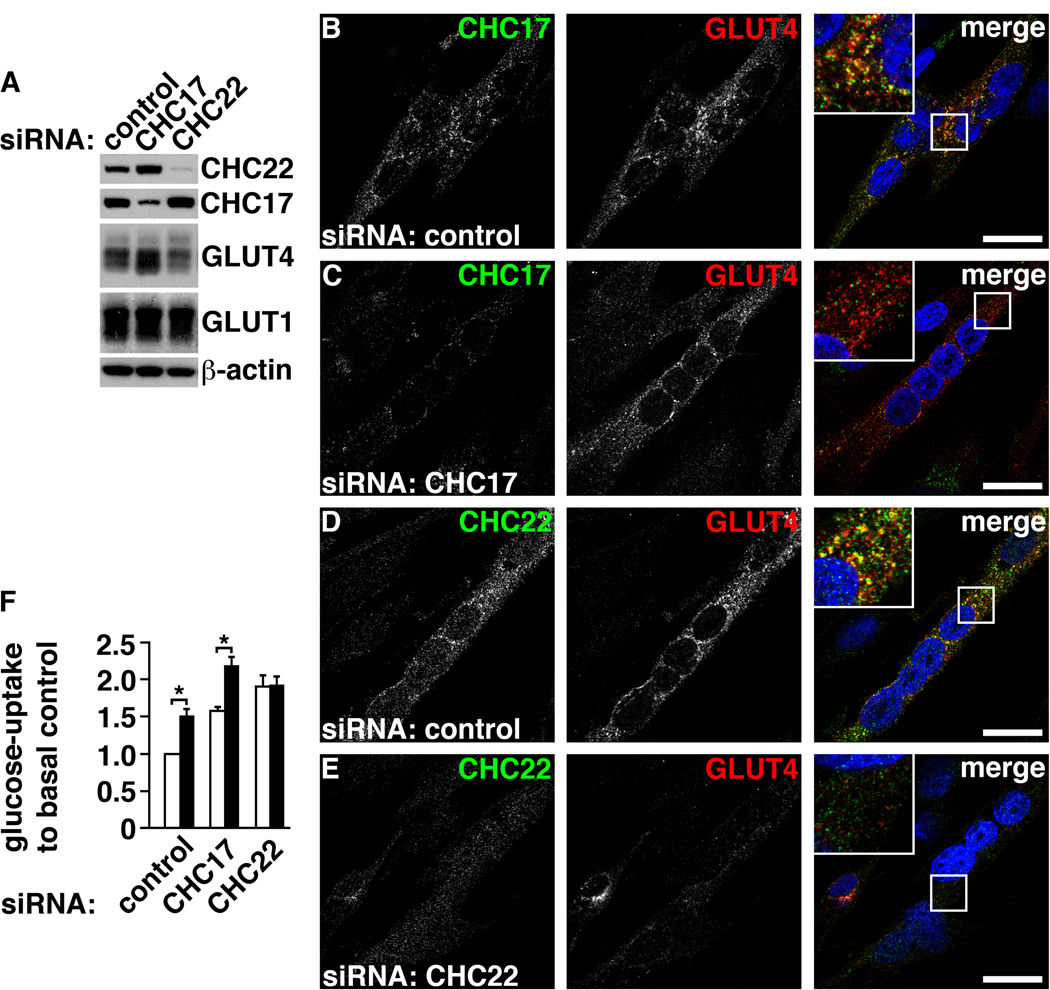
A role for CHC22 in GSC formation was assessed in the human myoblast cell line LHCNM2 (20) and in primary human adipocytes, representing the two tissues that form an insulin-responsive GSC. As observed for myoblast differentiation (10), CHC22 levels increased during adipocyte differentiation (fig. S3A). Co-localization of GLUT4 with both clathrins was evident in differentiated cultures when LHCNM2 cells had formed multinucleated myotubes and when lipid droplets were visible in primary adipocytes (Fig. 2, B to E and fig. S3, C and D). Both cell types were differentiated and treated with siRNA to knock down CHC22 or CHC17 (Fig. 2, C and E and fig. S3, D and E). CHC22 depletion was more efficient than CHC17 depletion (Fig. 2A and fig. S3B). In both cell types, CHC22 downregulation led to strong reduction of GLUT4 staining and apparent loss of the GSC (Fig. 2E, fig. S3E and S4, D and F). Levels of GLUT4 protein were partially reduced in CHC22-depleted cells (Fig. 2A and fig. S3B) but this effect was not as dramatic as the reduction of intracellular staining, suggesting dispersion of GLUT4 protein, as well as diversion to lysosomes. In contrast, depletion of CHC17 had no clear effect on the level of intracellular GLUT4 staining or its localization (Fig. 2C, fig. S3D, and fig. S4, C and E), but for LHCNM2 cells, an increase of GLUT4 protein level was observed (Fig. 2A), consistent with some inhibition of GLUT4 endocytosis. Depletion of either CHC did not affect the localization or levels of the GLUT1 glucose transporter, which is constitutively expressed without intracellular sequestration and has a wider tissue distribution than GLUT4 (21) (fig. S4, E and F).
Fig. 2.
CHC22 expression in cultured human myotubes and function in GSC formation. (A) Differentiated LHCNM2 skeletal muscle cells were treated with siRNA targeting proteins indicated at the top and cell lysates immunoblotted for proteins indicated at the right. Protein levels were reduced by 88.1±4.2% for CHC22 and 79.8±4% for CHC17 (N=5) compared to control siRNA-treated cells. (B to E) CHC17 or CHC22 (green) and GLUT4 (red) in differentiated LHCNM2 skeletal muscle cells treated with (B and D) control siRNA or siRNA targeting (C) CHC17 or (E) CHC22. DNA staining (DAPI, blue) identifies differentiated, multinucleated myotubes. Boxed region in merged images is magnified in inset (scale bars, 20 µm). (F) Glucose-uptake in differentiated LHCNM2 skeletal muscle cells treated with siRNA against indicated targets. White bars, ratio of basal glucose uptake to basal glucose uptake of control culture. Black bars, ratio of glucose-uptake after insulin stimulation to basal uptake of control culture. Asterisks indicate statistical significance (N=5, p<0.01).
Differentiated LHCNM2 cells treated with siRNA were tested for uptake of radioactive glucose in response to insulin to assess how CHC22 depletion affected GSC function (Fig. 2F). In control-treated LHCNM2 cultures, insulin stimulation induced a 50% increase in glucose uptake relative to basal levels. This modest insulin response compared to that of L6 rat myoblasts is attributed to limited differentiation of LHCNM2 human myoblasts, assessed by the percentage of myonuclei (fig. S4G). Consistent with GSC loss, CHC22-depleted LHCNM2 myotubes displayed no insulin-stimulated increase in glucose uptake (Fig. 2F). Myotubes depleted of CHC17 still responded to insulin, reflecting GSC persistence. Basal glucose uptake was increased upon depletion of either clathrin, indicating redistribution of GLUT4 to the cell surface (Fig. 2F). In the case of CHC22 depletion, we propose that defective trafficking of newly synthesized GLUT4 to the GSC results in surface expression of the non-degraded GLUT4. For CHC17 depletion, increased surface expression is consistent with reduction in GLUT4 endocytosis. Indeed, siRNA depletion of CHC17 but not CHC22 abrogated endocytosis of epidermal growth factor in LHCNM2 cells (fig. S4, H to J). Thus, CHC22 plays a role in intracellular biogenesis of the GSC independent from CHC17.
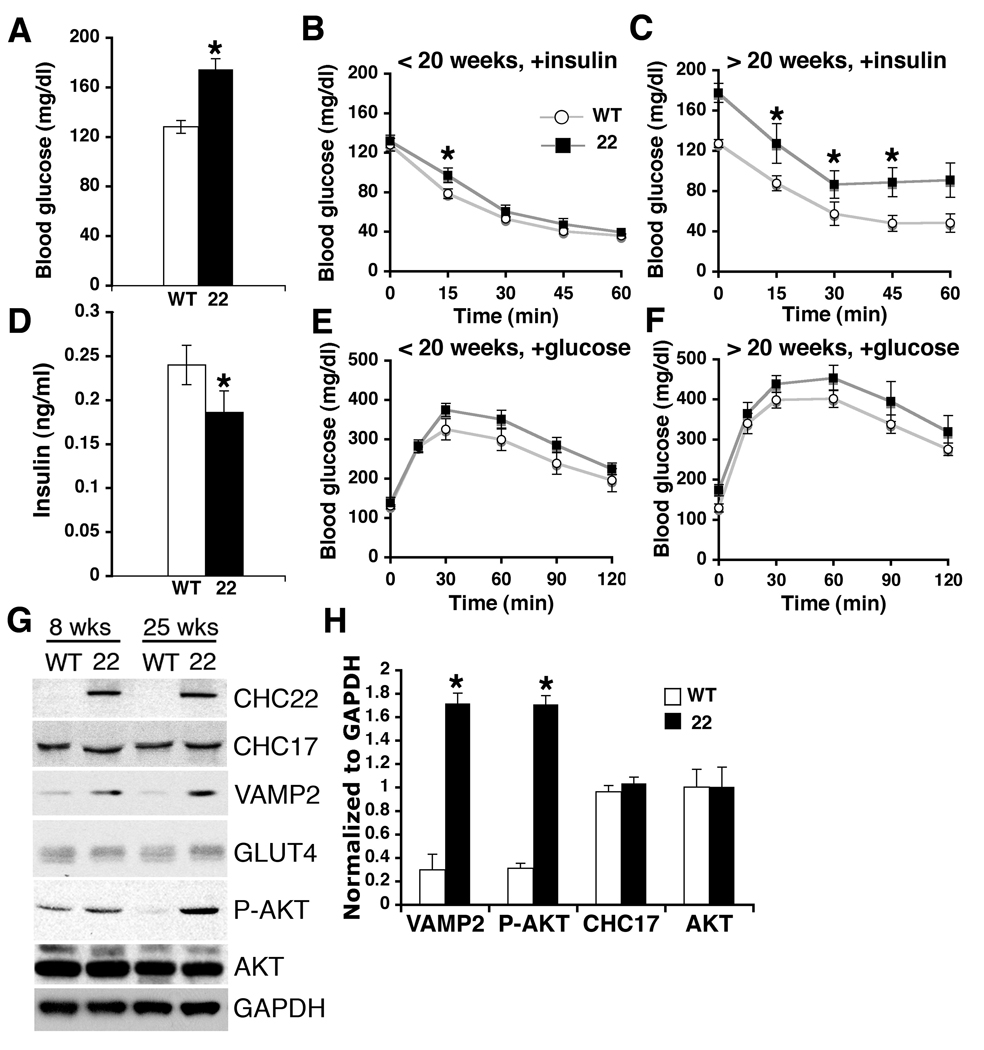
Mice have only a pseudogene for CHC22 and express no CHC22 protein (12). So introduction of human CHC22 as a transgene provided a means to study the influence of CHC22 on glucose metabolism. CHC22 transgenic mice were produced using a bacterial artificial chromosome (BAC) comprising the human gene CLTCL1 (formerly CLTD) encoding CHC22 under the control of its own promoter (fig. S5, A to D). CHC22 protein was detected in adipocytes and skeletal muscle of the transgenic mice and not in any other tissues tested (fig. S5, E to G). The three transgenic strains analyzed all showed features of diabetes. Older CHC22-mice were hyperglycemic compared to age matched wild-type mice (Fig. 3A) and were not able to clear their excess blood glucose in response to insulin, though they were not completely insulin resistant (Fig. 3, B and C). For all ages of mice tested, clearance of injected glucose was slightly less efficient in the CHC22-mice compared to wild-type (Fig. 3, E and F). Fasting blood insulin levels were mildly depressed in the older CHC22-mice, a feature characteristic of hyperglycemic patients with insulin resistance (22) (Fig. 3D). The BAC used to produce the CHC22-mice included only one additional gene adjacent to CLTCL1, SLC25A1 encoding a citrate transporter already present in mice. Tissue from WT and CHC22-mice had comparable citrate levels (fig. S5H), indicating no detectable effect of the additional SLC25A1 human transgene. Thus the presence of the CHC22 transgene in insulin-responsive tissues and its effect on GLUT4 trafficking is the most likely explanation for hyperglycemia and impaired glucose clearance in the CHC22-mice.
Fig. 3.
Features of diabetes in CHC22-transgenic mice. (A) Fasting (16 hrs) blood glucose levels of wild type (WT, N=10) and CHC22-transgenic mice (22, N=10, three strains), all mice aged >25 weeks. Asterisks indicate statistical significance (p<0.01). (B and C) Blood glucose levels in CHC22-transgenic mice (■, three strains) or WT littermates (○) (ages indicated) after insulin injection at time 0 (pre-fasted 6 hrs). (D) Blood insulin levels of wild type (N=24) and CHC22-transgenic mice (N=23, three strains), fasted 6 hrs, all mice aged >25 weeks. Asterisk indicates statistical significance (p<0.05). (E and F) Blood glucose levels in CHC22-transgenic mice (■, three strains) or WT littermates (○) (ages indicated) after glucose injection (2g/kg body weight) at time 0 (pre-fasted 16 hrs). The values in B, C, E and F are average glucose levels (N=6–10) for each time point ±SEM. Asterisks indicate statistically significant differences (p<0.05). (G) Skeletal muscle lysates (40 µg) from CHC22-transgenic strain 2 (22) or age-matched WT littermates (8 or 25 weeks old) were immunoblotted for the indicated proteins (P-AKT, phosphorylated AKT; GAPDH is a control). (H) Levels of proteins normalized to GAPDH detected as in G for mice aged >25 weeks (N=4 of each type of mouse, error bar represents SD, asterisks indicate statistically significant differences, p<0.01).
Analysis of proteins involved in GLUT4 transport and glucose metabolism revealed increases in phosphorylated AKT (pAKT, phosphoserine 473) and VAMP2 in the muscle of all three strains of CHC22-mice relative to wild-type (Fig. 3, G and H, and fig. S6A). The presence of CHC22 did not affect levels of GLUT4, IRAP, CHC17 or total AKT (Fig. 3, G and H, and fig. S6A). An increase in pAKT implies increased signaling in the GLUT4 export pathway (23, 24) and has also been observed in some instances of diabetes (25, 26).
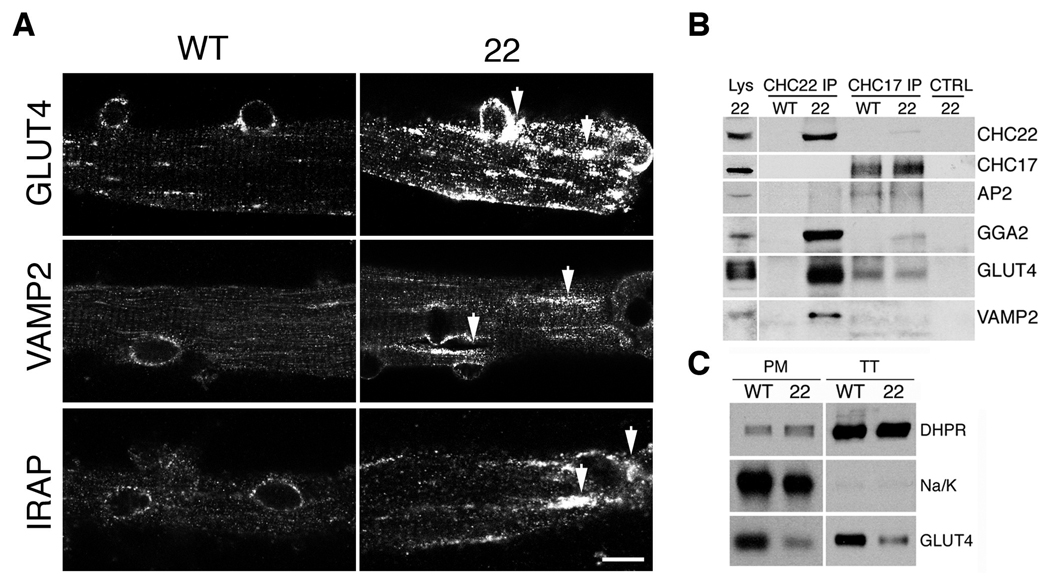
VAMP2 is targeted to the GSC to mediate fusion with the plasma membrane (17). Elevated levels of VAMP2 suggested that normal trafficking out of the GSC might be altered in the CHC22-transgenic mice such that routine turnover of VAMP2 was reduced. Immunofluorescence analysis of transgenic mouse muscle fibers showed that GLUT4, IRAP and VAMP2 were indeed localized to swollen GSC-like structures, visible as extensive bright patches just underneath the plasma membrane that were not seen in wild-type mouse muscle fibers (Fig. 4A, fig. S6D, and movies S1 to S4). CHC22 co-localized with GLUT4 and IRAP in these compartments and GLUT1 was excluded (fig. S6, D and E). In muscle of the CHC22-mice, the differential biochemical association of CHC22 or CHC17 with proteins involved in GLUT4 transport (Fig. 4B) was the same as detected in human skeletal muscle (Fig. 1, C and D). Thus, CHC22 perturbs mouse GSC function by excessive intracellular sequestration of GLUT4 trafficking components, which in the case of VAMP2, increases its stability (Fig. 3G and fig. S6A).
Fig. 4.
GLUT4 membrane traffic in CHC22-transgenic mice. (A) Cultured skeletal muscle fibers from (WT) or CHC22-transgenic mice (22) (6 weeks old) analyzed by immunofluorescence for GLUT4, VAMP2 and IRAP (scale bar, 10 µm). Arrows indicate expanded GSC compartments in CHC22-transgenic mouse muscle fibers. (B) Proteins associated with CHC22 or CHC17 immunoprecipitated (IP) from lysate of skeletal muscle from wild type (WT) or CHC22-transgenic mice (22) (age>25 weeks) were detected by immunoblotting. Input lysate (Lys, 1–5%) and IP with isotype-matched control (CTRL) antibody from CHC22-transgenic mouse muscle lysate are also analyzed. (C) Plasma membrane (PM) and T-tubule membrane (TT) from wild-type (WT) or CHC22-transgenic mice (22) (fed ad lib, age > 25 weeks) were purified and equal amounts analyzed by immunoblotting for GLUT4, the TT marker dihydropyridine receptor (DHPR) and the PM marker Na/K-ATPase (Na/K). These data represent results from all three CHC22-transgenic mouse strains.
The plasma membrane (PM) and T-tubules (TT) are the major sites of GLUT4 release during an insulin response (27). To determine whether excessive sequestration of VAMP2 and GLUT4 in the CHC22-mice affected GLUT4 release, steady state levels of GLUT4 in feeding mice were assessed in purified PM or TT membranes (Fig. 4C). Both membrane fractions from muscle of CHC22-mice had less GLUT4 relative to levels detected in wild-type, owing to intracellular retention of GLUT4 (41% ± 10.2% (SEM) of total GLUT4) by CHC22 (fig. S6, B and C). The reduced steady state surface levels of GLUT4 could explain the hyperglycemia of the CHC22-mice.
While much has been learned from mouse models about glucose metabolism that is relevant to human diabetes, we have observed a species-specific difference that should be considered for better understanding of the human disease. CHC22 clathrin, which is absent from mice, is involved in the intracellular generation of the GSC in human insulin responsive tissues. Presumably through association with the AP1 and GGA2 adaptors, CHC22 participates in trafficking GLUT4 and other GSC components from endosomes and/or the TGN to the GSC, but CHC22 is not involved in GLUT4 endocytosis. In spite of this key role for CHC22 in GSC formation in humans, its artificial presence in mice sequesters GSC components and induces some features of diabetes in CHC22-transgenic mice. We propose that, in the transgenic mice, the presence of CHC22 disrupts the normal GLUT4 trafficking pathways that operate in mice, resulting in impaired release of GLUT4 in response to insulin. That the human GSC has at least one extra component contributing to its formation suggests the possibility that the human GSC in muscle and fat might be more robust than the equivalent compartment in mice, which is formed by a tenuous equilibrium between the biosynthetic and endocytic pathways (1, 28). This difference between GLUT4 membrane traffic in human and mouse muscle could help explain why 70–90% of insulin-stimulated glucose clearance depends on skeletal muscle in humans (21, 29), but in mice, the liver is the most influential organ controlling insulin responsive glucose reduction in the bloodstream (30, 31). The ability of CHC22 to partially carry out its function in transgenic mice raises the possibility of rescuing the rest of its function and creating a better mouse model in which specific aspects of human glucose metabolism and diabetes can be studied.
Supplementary Material
References and Notes
- 1.Bryant NJ, Govers R, James DE. Nat. Rev. Mol. Cell. Biol. 2002;3:267. doi: 10.1038/nrm782. [DOI] [PubMed] [Google Scholar]
- 2.Dugani CB, Klip A. EMBO Rep. 2005;6:1137. doi: 10.1038/sj.embor.7400584. [DOI] [PMC free article] [PubMed] [Google Scholar]
- 3.Hou JC, Pessin JE. Curr. Opin. Cell. Biol. 2007;19:466. doi: 10.1016/j.ceb.2007.04.018. [DOI] [PMC free article] [PubMed] [Google Scholar]
- 4.Huang S, Czech MP. Cell Metab. 2007;5:237. doi: 10.1016/j.cmet.2007.03.006. [DOI] [PubMed] [Google Scholar]
- 5.Garvey WT, et al. J. Clin. Invest. 1998;101:2377. doi: 10.1172/JCI1557. [DOI] [PMC free article] [PubMed] [Google Scholar]
- 6.Maianu L, Keller SR, Garvey WT. J. Clin. Endocrinol. Metab. 2001;86:5450. doi: 10.1210/jcem.86.11.8053. [DOI] [PubMed] [Google Scholar]
- 7.Brodsky FM, Chen CY, Knuehl C, Towler MC, Wakeham DE. Annu. Rev. Cell. Dev. Biol. 2001;17:517. doi: 10.1146/annurev.cellbio.17.1.517. [DOI] [PubMed] [Google Scholar]
- 8.Fazakerley DJ, Lawrence SP, Lizunov VA, Cushman SW, Holman GD. J. Cell. Sci. 2009;122:727. doi: 10.1242/jcs.041178. [DOI] [PMC free article] [PubMed] [Google Scholar]
- 9.Antonescu CN, Diaz M, Femia G, Planas JV, Klip A. Traffic. 2008 doi: 10.1111/j.1600-0854.2008.00755.x. [DOI] [PubMed] [Google Scholar]
- 10.Liu S-H, et al. EMBO J. 2001;20:272. doi: 10.1093/emboj/20.1.272. [DOI] [PMC free article] [PubMed] [Google Scholar]
- 11.Towler MC, et al. Mol. Biol. Cell. 2004;15:3181. doi: 10.1091/mbc.E04-03-0249. [DOI] [PMC free article] [PubMed] [Google Scholar]
- 12.Wakeham DE, et al. Proc. Natl. Acad. Sci. U.S.A. 2005;102:7209. doi: 10.1073/pnas.0502058102. [DOI] [PMC free article] [PubMed] [Google Scholar]
- 13.Materials and methods are available as supporting material on Science Online.
- 14.Robinson MS, Bonifacino JS. Curr. Opin. Cell Biol. 2001;13:444. doi: 10.1016/s0955-0674(00)00235-0. [DOI] [PubMed] [Google Scholar]
- 15.Miller SE, Collins BM, McCoy AJ, Robinson MS, Owen DJ. Nature. 2007;450:570. doi: 10.1038/nature06353. [DOI] [PubMed] [Google Scholar]
- 16.Li LV, Kandror KV. Mol. Endocrinol. 2005;19:2145. doi: 10.1210/me.2005-0032. [DOI] [PubMed] [Google Scholar]
- 17.Randhawa VK, et al. Mol. Biol. Cell. 2000;11:2403. doi: 10.1091/mbc.11.7.2403. [DOI] [PMC free article] [PubMed] [Google Scholar]
- 18.Gillingham AK, Koumanov F, Pryor PR, Reaves BJ, Holman GD. J. Cell Sci. 1999;112:4793. doi: 10.1242/jcs.112.24.4793. [DOI] [PubMed] [Google Scholar]
- 19.Kandror KV, Pilch PF. Proc. Natl. Acad. Sci. U.S.A. 1994;91:8017. doi: 10.1073/pnas.91.17.8017. [DOI] [PMC free article] [PubMed] [Google Scholar]
- 20.Zhu CH, et al. Aging Cell. 2007;6:515. doi: 10.1111/j.1474-9726.2007.00306.x. [DOI] [PubMed] [Google Scholar]
- 21.Shepherd PR, Kahn BB. N. Engl. J. Med. 1999;341:248. doi: 10.1056/NEJM199907223410406. [DOI] [PubMed] [Google Scholar]
- 22.Kahn SE, Hull RL, Utzschneider KM. Nature. 2006;444:840. doi: 10.1038/nature05482. [DOI] [PubMed] [Google Scholar]
- 23.Koumanov F, Jin B, Yang J, Holman GD. Cell Metab. 2005;2:179. doi: 10.1016/j.cmet.2005.08.007. [DOI] [PubMed] [Google Scholar]
- 24.Ng Y, Ramm G, Lopez JA, James DE. Cell Metab. 2008;7:348. doi: 10.1016/j.cmet.2008.02.008. [DOI] [PubMed] [Google Scholar]
- 25.Lizcano JM, Alessi DR. Curr. Biol. 2002;12:R236. doi: 10.1016/s0960-9822(02)00777-7. [DOI] [PubMed] [Google Scholar]
- 26.Manning BD, Cantley LC. Cell. 2007;129:1261. doi: 10.1016/j.cell.2007.06.009. [DOI] [PMC free article] [PubMed] [Google Scholar]
- 27.Munoz P, et al. Biochem. J. 1995;312:393. doi: 10.1042/bj3120393. [DOI] [PMC free article] [PubMed] [Google Scholar]
- 28.Blot V, McGraw TE. Mol. Biol. Cell. 2008;19:3477. doi: 10.1091/mbc.E08-03-0236. [DOI] [PMC free article] [PubMed] [Google Scholar]
- 29.Postic C, Dentin R, Girard J. Diabetes Metab. 2004;30:398. doi: 10.1016/s1262-3636(07)70133-7. [DOI] [PubMed] [Google Scholar]
- 30.Michael MD, et al. Mol. Cell. 2000;6:87. [PubMed] [Google Scholar]
- 31.Bruning JC, et al. Mol. Cell. 1998;2:559. doi: 10.1016/s1097-2765(00)80155-0. [DOI] [PubMed] [Google Scholar]
- 32.We thank N. Ohkoshi, A. Ishii and A. Tamaoka for providing tissue samples from the archives of the Dept. of Neurology, University of Tsukuba, P. Ursell for providing tissue samples from the Dept. of Pathology, UCSF, M. Birnbaum, J. Pessin, J. Bonifacino and J. Hopwood for antibodies, E. Unger, UCSF Diabetes Center and M. Yuneva, G.W. Hooper Foundation for technical advice and A. Klip for helpful discussion. This work was supported by NIH grants GM038093 to F.M.B. and HD47863 to R.K., a research grant and career development award from the Muscular Dystrophy Association to W.E.W. and S.H., respectively, and a grant from the Fondation Recherche Medicale, France to S.V. Some images were acquired at the Nikon Imaging Center at UCSF.
Associated Data
This section collects any data citations, data availability statements, or supplementary materials included in this article.


