Abstract
Aggregation of human therapeutic antibodies represents a significant hurdle to product development. In a test across multiple antibodies, it was observed that IgG1 antibodies aggregated less, on average, than IgG2 antibodies under physiological pH and mildly elevated temperature. This phenomenon was also observed for IgG1 and IgG2 subclasses of anti-streptavidin, which shared 95% sequence identity but varied in interchain disulfide connectivity. To investigate the structural and covalent changes associated with greater aggregation in IgG2 subclasses, soluble aggregates from the two forms of anti-streptavidin were isolated and characterized. Sedimentation velocity analytical ultracentrifugation (SV-AUC) measurements confirmed that the aggregates were present in solution, and revealed that the IgG1 aggregate was composed of a predominant species, whereas the IgG2 aggregate was heterogeneous. Tertiary structural changes accompanied antibody aggregation as evidenced by greater ANS (8-Anilino-1-naphthalene sulfonic acid) binding to the aggregates over monomer, and differences in disulfide character and tryptophan environments between monomer, oligomer and aggregate species, as observed by near-UV circular dichroism (CD). Differences between subclasses were observed in the secondary structural changes that accompanied aggregation, particularly in the intermolecular β-sheet and turn structures between the monomer and aggregate species. Free thiol determination showed ∼2.4-fold lower quantity of free cysteines in the IgG1 subclass, consistent with the 2.4-fold reduction in aggregation of the IgG1 form when compared with IgG2 under these conditions. These observations suggested an important role for disulfide bond formation, as well as secondary and tertiary structural transitions, during antibody aggregation. Such degradations may be minimized using appropriate formulation conditions.
Keywords: aggregation, antibody, IgG, spectroscopy, disulfide
Introduction
Monoclonal antibodies, either humanized or fully human, represent an important class of therapeutic agents to treat a variety of human disease conditions including cancer, inflammation, metabolic disorders, and bone disease.1 As with any protein drug, monoclonal antibodies can undergo a variety of degradation pathways.2–4 One of the most common routes of instability is the formation of antibody oligomers and higher molecular weight aggregates.3–6 Antibody aggregation can pose a significant challenge during drug development, storage, and delivery.4 Such instability can impact the ability to consistently manufacture the high purity drug product.7 Further, aggregation poses a potential safety concern, because protein aggregates may have the capacity to cause immunogenicity.8 Therefore, it is essential to understand and control the process of antibody aggregation.
High molecular weight (HMW) species formation has been described for antibodies under a variety of circumstances, including freeze/thaw,3,6,9 agitation,9 and thermal stress.5,6,9 Additionally, under physiological conditions, antibody light chains and associated variable light chains have been shown to possess the ability to form amyloid, and have been implicated in free light chain amyloidosis, a neurodegenerative disorder.10 Antibody aggregation is influenced by formulation conditions, such as pH, buffer, and excipient.4,7 Techniques have been detailed to quantitatively measure antibody aggregation.9 Size-exclusion chromatography (SE-HPLC) has been the workhorse of the pharmaceutical industry to assess and quantitate the presence of HMW species. However, it should be noted that SE-HPLC may not accurately detect the presence and amounts of all kinds of aggregates that may be present in the sample. Greater sensitivity and accuracy may be afforded by the use of orthogonal techniques, such as analytical ultracentrifugation and field flow fractionation.11
The examples of protein aggregation commonly described in the literature usually involve proteins that contain a single domain, a single polypeptide chain, or both.12,13 However, antibodies are multichain, multidomain proteins that are relatively large in molecular mass (around 150 kDa).4 These various domains possess their own secondary and tertiary structure. Further, there are disulfide bonds that hold the structure together: intradomain disulfide bonds, light chain to heavy chain disulfide bonds, and inter-heavy chain disulfide bonds. In addition to the complexity described above, antibodies undergo several post-translational modifications, such as pyroglutamic acid formation at the N-terminus,14 C-terminal lysine removal,15 and addition of polysaccharide chains.16 The complexity of these molecules complicates our ability to study their mechanisms of aggregation.
Although there are a number of antibody subclasses, IgG1 and IgG2 are the most common forms used for monoclonal antibody therapy.4 IgG1 and IgG2 antibodies are complex molecules that consist of heavy and light chain pairs (Fig. 1). Each heavy chain consists of four Ig-like domains, whereas there are two in each light chain. The two chains interact through intermolecular noncovalent contacts and disulfide bonds to form the antigen binding fragment (Fab domain). The Fab domain is connected to the Fc antibody fragment through the hinge region that contains two or four disulfide bonds for IgG1 or IgG2 antibodies, respectively. These hinge disulfide bonds also connect the heavy chains.4 Recently, it has been shown that the two additional disulfide bonds in an IgG2 antibody can form connections between the heavy chains or heavy and light chains, creating three IgG2 isoforms.17,18 Additionally, each Ig-like domain contains a single, conserved disulfide bond within the hydrophobic core.4
Figure 1.
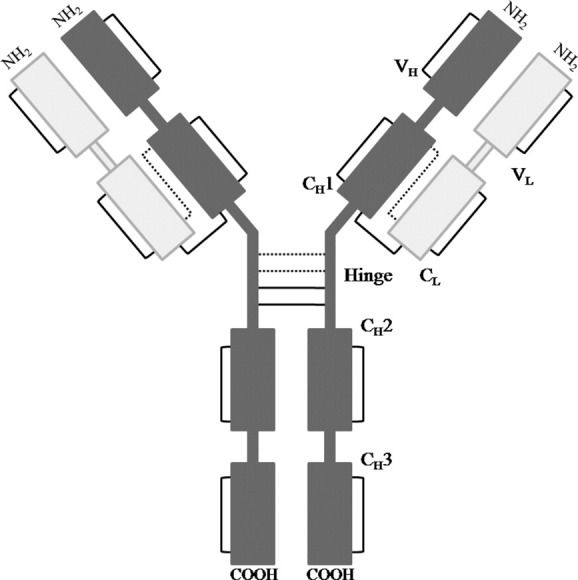
Schematic representation of IgG1 and IgG2 domains and disulfide linkages. The solid lines between domains represent disulfide linkages that are present in both IgG1 and IgG2, whereas the dotted lines in the hinge region represent the connections of one of the three IgG2 isoforms. The other two IgG2 isoforms have one or two connections between heavy and light chains.
In this study, the structural and covalent features of aggregates formed by an IgG1 and an IgG2 form of an anti-streptavidin antibody* (antiSA1 and antiSA2, respectively) were examined. After sample incubation at elevated temperature, HMW aggregates (collected at the void volume of the HPLC column), oligomer (dimer and trimer), and monomer were purified and analyzed to determine differences in conformational and biochemical properties of the purified species. The results described in this report suggest an important role for disulfide bond formation during the antibody aggregation process, as opposed to major reorganizations in structure.
Results
Increase in aggregation for IgG1 and IgG2 antibodies
To test differences in aggregation propensity between IgG1 and IgG2 antibodies, four IgG1 antibodies and seven IgG2 antibodies at 20 mg/mL were formulated in 10 mM sodium phosphate, 5% (w/v) sorbitol, pH 7.0 (N7S) and incubated at 45°C up to 12 weeks. Physical stability was assessed by SE-HPLC, visual observations, and sodium dodecyl sulfate polyacrylamide gel electrophoresis (SDS-PAGE). After 12 weeks of incubation at 45°C, the antibodies showed significant aggregation as assessed by SE-HPLC and SDS-PAGE, and several of the samples contained visible particulates. Figure 2(A) shows a representative SE-HPLC chromatogram of the antibodies tested after 12 weeks of storage at 45°C, which shows the major degradation species. HMW species were observed to elute at the void volume of the column system (referred to as void volume aggregate), followed by oligomer (larger than the monomer), monomer and then fragmented product (clips). The relative sizes of these species were later confirmed by sedimentation velocity analytical ultracentrifugation (SV-AUC) measurements. All degradation species increased with incubation time at 45°C.
Figure 2.
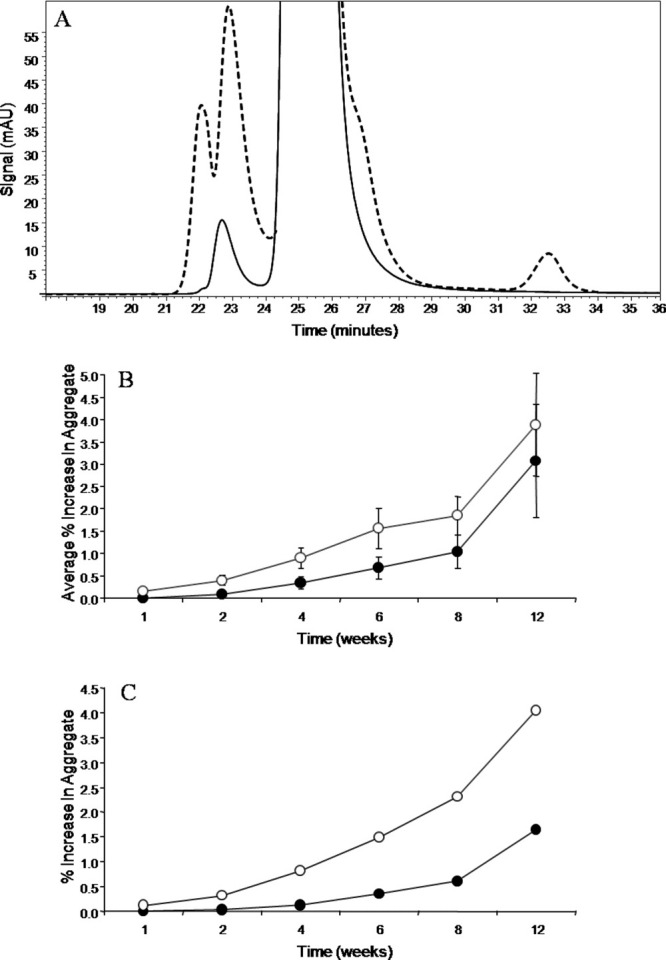
(A) SE-HPLC chromatogram of an antibody at time zero (solid) and after 12 weeks of storage at 45°C (dashed). Physical degradation is evidenced by the growth of pre- and post-main peaks. (B) Increase in percent void volume aggregate from time zero by SEC, averaged for four IgG1's (filled circles) and seven IgG2's (open circles). The error bars were calculated from the standard deviation of the samples, which were averaged for each data point. (C) Increase in percent void volume aggregate from time zero by SE-HPLC for antiSA1 (filled circles) and antiSA2 (open circles).
Analysis of the data for all 11 antibodies showed that the average increase in void volume aggregate was greater for the IgG2 antibodies compared with the IgG1 antibodies tested, as shown in Figure 2(B). This observation could result from intrinsic differences between the IgG1 versus the IgG2 antibody subclass. However, each antibody had different amino acid sequences in the complementarity-determining regions (CDRs). In principle, the phenomenon of increased aggregation in IgG2 antibodies could be driven purely by sequence differences and not be related to whether the antibody was an IgG1 or an IgG2. To distinguish between these possibilities, the remainder of the study was focused on two subclasses of the same antibody: IgG1 anti-streptavidin (antiSA1) and IgG2 anti-streptavidin (antiSA2). These two subclasses shared 95% sequence identity overall: 100% in the light chain and 94% in the heavy chain, with identical CDRs (Table I). There are 29 sequence differences between antiSA1 and antiSA2 including four insertions in the IgG1 subclass, all of which are located in the heavy chain constant domains. Thirteen of the 25 amino acids differences were conservative (e.g., nonpolar to nonpolar, polar to polar, and charged to charged), whereas 12 of them were biochemically dissimilar. Overall, the sequence differences were slight; however, the antiSA2 aggregated more than antiSA1 [shown by SE-HPLC data in Fig. 2(C)], thus, suggesting that the IgG2 subclass was inherently more prone to aggregation than the IgG1 subclass. This observation confirms the trend observed for all 11 antibodies.
Table I.
Sequence Differences, Marked in Gray Shading, Between IgG1 and IgG2 Anti-streptavidin Molecules, Grouped by Antibody Domain
| CH1 | ||||||
| Anti-SA1 | APSSKSTSGGTA | SSSLGT | TYICNVNHK | DKKVE | ||
| Anti-SA2 | APCSRSTSESTA | SSNFGT | TYTCNVDHK | DKTVE | ||
| Hinge | ||||||
| Anti-SA1 | EPKSCDKTHTCP | |||||
| Anti-SA2 | ERKCCVE***CP | |||||
| CH2 | ||||||
| Anti-SA1 | PELLGGP | EVKFN | EQYNSTYRV | TVLHQ | NKALP | SKAKG |
| Anti-SA2 | PPV*AGP | EVQFN | EQFNSTFRV | TVVHQ | NKGLP | SKTKG |
| CH3 | ||||||
| Anti-SA1 | SRDELTK | PPVLD | ||||
| Anti-SA2 | SREEMTK | PPMLD | ||||
The locations in Anti-SA2 sequence where insertions occur in Anti-SA1 sequence. Those domains not detailed in the table did not contain sequence differences.
To verify that the changes observed between antiSA1 and antiSA2 were not a consequence of thermal unfolding and gross conformational changes that can occur near the melting temperature of proteins, differential scanning calorimetry (DSC) was used to determine the thermal transition profile. Figure 3 shows the thermograms of the two subclasses of anti-streptavidin. The DSC results confirmed that the apparent thermal transitions of the antibodies were at ∼71°C, which is beyond the chosen storage temperature of 45°C. The storage temperature appeared to be at least 15–20°C below even the early onset of thermal melting.
Figure 3.
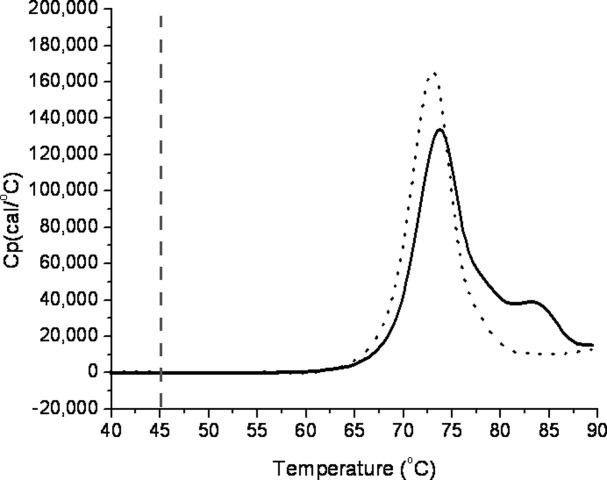
DSC results for the two antibodies, showing that the first transitions were above 45°C, chosen as the maximum storage temperature for the study. The endotherms of anti-streptavidin antibodies, IgG1 (solid) and IgG2 (dotted), are compared with 45°C (dashed vertical line).
Purification of aggregates from IgG1 and IgG2 subclasses
To understand the basis for greater aggregation in the IgG2 form and to elucidate structural and covalent changes that accompanied protein aggregation, size-exclusion chromatography fractions of the IgG1 and IgG2 forms were purified. To maximize void aggregate content for species purification, material from different time points from the initial incubation study was pooled and further incubated for four additional months. The relative contributions of the thermally stressed time point samples were different for antiSA1 and antiSA2. Because of this sample heterogeneity, the final void aggregate amounts after the second incubation period were similar, 8.7% for antiSA1 and 9.1% for antiSA2.
The major species to be analyzed (void volume aggregate, oligomer, and monomer) were collected, concentrated, and buffer exchanged into N7S. The purified fractions were found to have greater than 93% purity by SE-HPLC. Figure 4 shows the confirmation of the antiSA1 purified species. Similar results for the antiSA2 species purification were found (data not shown). The proteins were incubated at 20 mg/mL and the concentration dependence of aggregation was not pursued. The effect, if any, of sample dilution during measurements by SE-HPLC and SV-AUC on aggregate content was not addressed.
Figure 4.
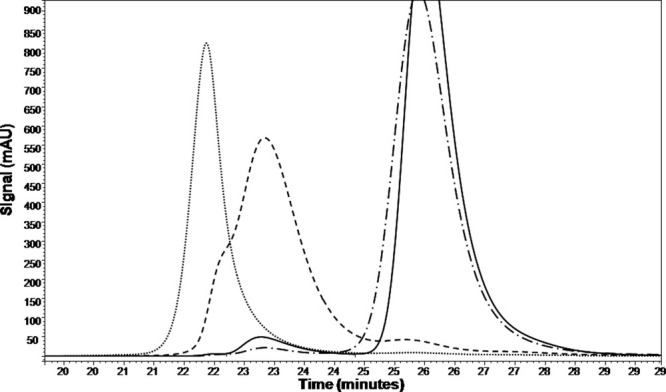
The confirmation of the purified species of antiSA1 by SE-HPLC: purified void volume aggregate (dotted), purified oligomer (dashed), and monomer (dash dot dash). The intact antibody (solid line) is shown as a reference.
Heterogeneous size distribution in aggregates
SV-AUC was used to confirm the SE-HPLC results and to further characterize the degradation species of the antibodies. The SV-AUC data (Fig. 5) confirmed the identities of the fractions for both subclasses. The monomer fraction (95% for IgG1 and 99.5% for IgG2) at 5.4 S was primarily composed of one peak with approximate molecular weights of 141 and 130 kDa for IgG1 and IgG2, respectively. The oligomer fraction was composed of dimer (89% for IgG1 and 68% for IgG2) at 7.7 S and 7.8 S with approximate molecular weights 227 and 276 kDa for IgG1 and IgG2, respectively, and trimer (9% for IgG1 and 7% for IgG2) at 10 S with approximate molecular weights of 519 and 499 kDa for IgG1 and IgG2, respectively. The void volume aggregate was a heterogeneous collection of larger species with very large entities out to ∼45 S. The molecular weights for the monomer, dimer, and trimer were in good agreement (∼10–20%) with their nominal values. The reduced and nonreduced SDS-PAGE data (not shown) showed a HMW ladder consistent with the sample heterogeneity within the aggregate fractions seen in SV-AUC. Analysis of the void volume samples by SV-AUC revealed a striking difference between subclasses: the IgG1 void volume aggregate contained one prominent HMW peak at ∼12 S, whereas this peak was smaller in the antiSA2 aggregate sample and joined by several species of similar amounts in the range of 15–25 S.
Figure 5.
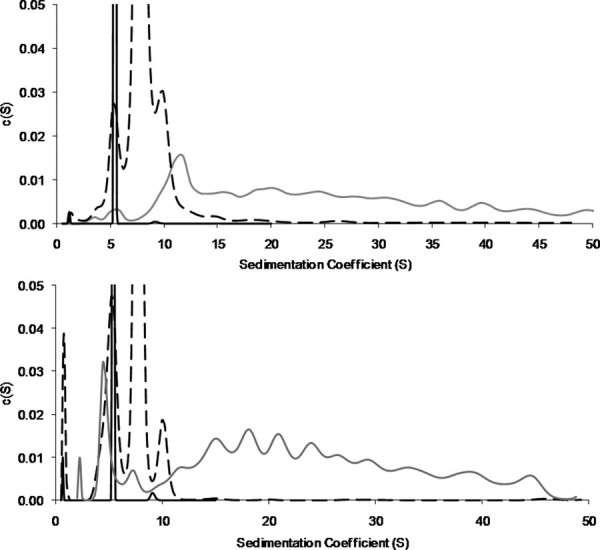
SV-AUC data for antiSA1 (top panel) and antiSA2 (bottom) fractions. The monomer (solid black) and oligomer (dashed black) are similar between the subclasses, while there are differences in the heterogeneity of the aggregates (solid gray). More distinct species are visible in the antiSA2 aggregate.
Differences in conformational character between IgG1 and IgG2 subclasses
Far-UV CD was used to compare the secondary structure of the purified fractions of the subclasses, and the results are shown in Figure 6. The monomer and oligomer species of each subclass showed little difference according to far-UV CD. The differences at 198 nm have often been attributed to random coil conformations and intermolecular β-sheet.19 Although difficult to analyze in these data because of signal noise, the spectra suggest an increase in non-native or unfolded structure in the aggregates of antSA1 and antiSA2 compared with the other purified species. The prominent minimum at 217 nm is a common feature of β-sheet-containing proteins.19 This work showed small differences in β-sheet character between the profiles for the purified monomer, oligomer, and aggregate species of each subclass. Differences at 230 nm are attributed to tryptophan ring stacking,20 which often corresponds to changes in tertiary structure. In this evaluation, the purified aggregates of both antibody subclasses showed potential ring stacking discrepancies when compared with purified monomer and oligomer species.
Figure 6.
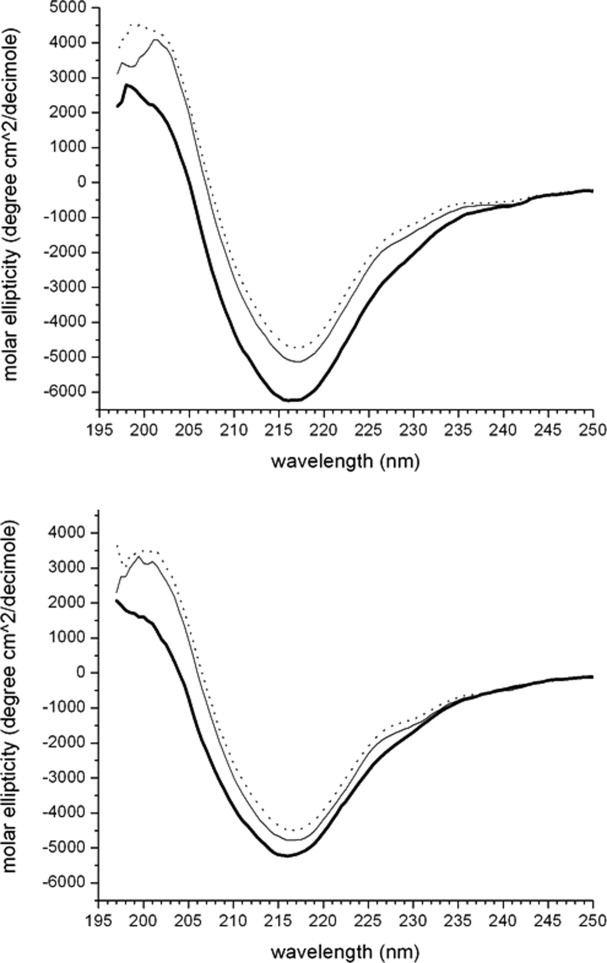
The far-UV circular dichroism measurements of the purified antiSA1 (top) and antiSA2 (bottom) species: aggregate (thick solid), oligomer (thin solid), and monomer (dotted).
Infrared spectroscopy (FTIR) was also used to assess the secondary structure of the species, and the results for the amide I region are shown in Figure 7. Aside from slight magnitude differences because of normalization, the profiles of the monomer and oligomer spectra of each subclass do not show significant differences. The prominent minimum at 1637 cm−1 has been shown to convey information on intramolecular β-sheet structures in proteins.21 Both subclasses showed loss of intramolecular β-sheet structure in their aggregate species when compared with monomer, as evidenced by decreases in this1637 cm−1 band. The region 1600–1625 cm−1 reflects intermolecular β-structure21 and both subclasses showed heterogeneous intermolecular β-sheet structure between species at this region. Variations in random coil and β-turn structure are reflected in the region 1660–1670 cm−1.21 Significant differences in the aggregate species of the subclasses compared with oligomer and monomer were seen in this region. Overall, there were significant differences observed between the monomer and aggregate samples for each subclass, but the difference in the magnitude of these changes between subclasses was not clear.
Figure 7.
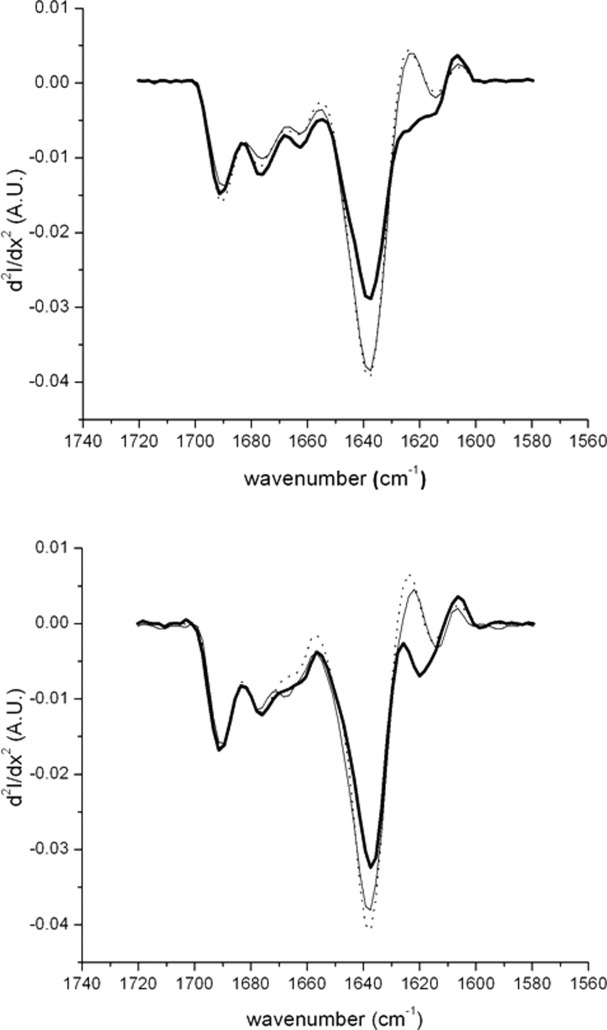
Fourier transfer infrared spectroscopy (FTIR) results of the purified antiSA1 (top) and antiSA2 (bottom) species: aggregate (thick solid), oligomer (thin solid), and monomer (dotted).
Tertiary structural differences
Tertiary structure of the purified species was assessed using near-UV CD, shown in Figure 8(A) (antiSA1) and 8(B) (antiSA2). Although the oligomer and monomer spectra of each subclass are similar, there are some slight differences, which could distinguish the oligomer spectra as a combination of the aggregate and monomer spectra. The overall tertiary structure was similar between aggregate samples of the subclasses, although measurable differences were observed between aggregate fractions and monomer fractions. The tryptophan environment is reflected at 290–295 nm, the tyrosine environment at 275 nm, and phenylalanine has signals as a triplet at 258, 264, and 270 nm.19,22 In this work, the tyrosine and phenylalanine environments remained mostly intact, but there was a loss of structure around the tryptophan environments for aggregates of both subclasses. Overall, when the aggregate and monomer of each subclass were compared, the tertiary structure of the antiSA2 aggregate was more perturbed than that of the antiSA1 aggregate. The intensity of the spectra at 250–300 nm depicts differences in disulfide structure.23 The aggregate species showed differences in disulfide structure compared to monomer, shown by the difference in intensity of the aggregate samples.
Figure 8.
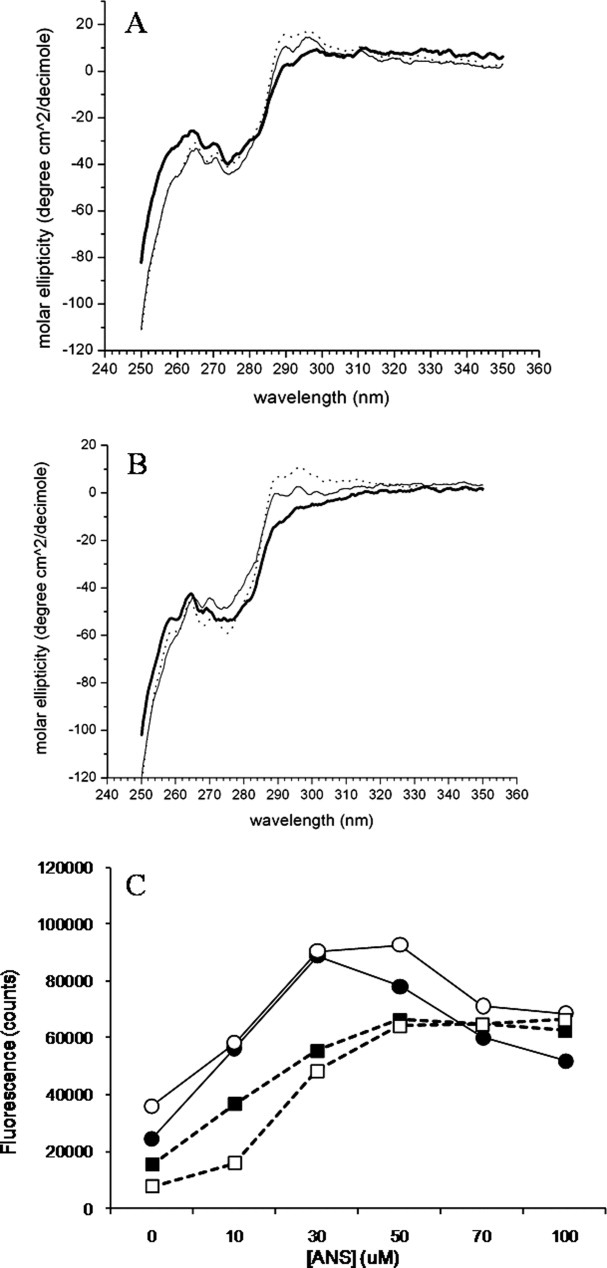
Near-UV circular dichroism measurements of the purified antiSA1 (A) and antiSA2 species (B): aggregate (thick solid), oligomer (thin solid), and monomer (dotted). In panel C, the fluorescence data at 484 nm in the presence of various concentrations of ANS of the purified antiSA1 (filled symbols) and antiSA2 (open symbols) aggregate (circles) and monomer (squares). The oligomer data (not shown) were similar to the monomer data.
ANS (8-Anilino-1-naphthalene sulfonic acid) binding experiments were carried out to test for changes in surface hydrophobicity of the purified species. For each subclass, the monomer and oligomer species did not show appreciable differences. Furthermore, there did not appear to be significant differences between the subclasses for the monomer and oligomer species (data not shown). However, the aggregate fractions for both subclasses showed greater ANS binding when compared with the monomer fractions [Fig. 8(C)], as well as when compared with oligomer fractions (data not shown). The aggregate fractions showed greater binding up to 50 μM ANS, compared with that observed in the monomer. Beyond 50 μM, ANS binding decreased. However, there was no significant difference between the two aggregate fractions themselves. The decreased fluorescence after 50 μM ANS for the aggregate fractions could be because of multiple factors: saturation beyond 50 μM, dye inner filter effects and dye-induced unfolding or precipitation of the antibodies at high concentrations of ANS.24
Differences in covalent character in IgG1 and IgG2 aggregates
Sodium dodecyl sulfate (SDS) denatured size-exclusion chromatography (dSE-HPLC) under nonreducing and reducing conditions was used to characterize the covalent character of the purified fractions and the data are presented in Figure 9. The intact and unpurified samples of the antiSA1 and antiSA2 subclasses (before species purification) contained 8.7 and 9.1% aggregate, respectively, as determined by SE-HPLC. These values decreased to 7.4 and 6.5%, respectively, upon the addition of SDS. This indicated that 1.3 and 2.6% of the total aggregate originated from a noncovalent association among the aggregate population for the intact samples. Figure 9(A) shows the nonreduced dSE-HPLC results for the purified aggregate species of each of the subclasses. The data indicated that a majority of these aggregates (>60%) were covalently linked. The monomer band in this case would presumably correspond to the noncovalent component of the aggregate, as it dissociated upon SDS addition and heat treatment. Interestingly, the two purified aggregate species did not differ significantly in their absolute amount of covalent or noncovalent aggregate content. It is formally possible that the noncovalently associated HMW species could be SDS and heat resistant. Given the harshness of the treatment, we believe this possibility to be small, but it is unknown in the context of this work.
Figure 9.
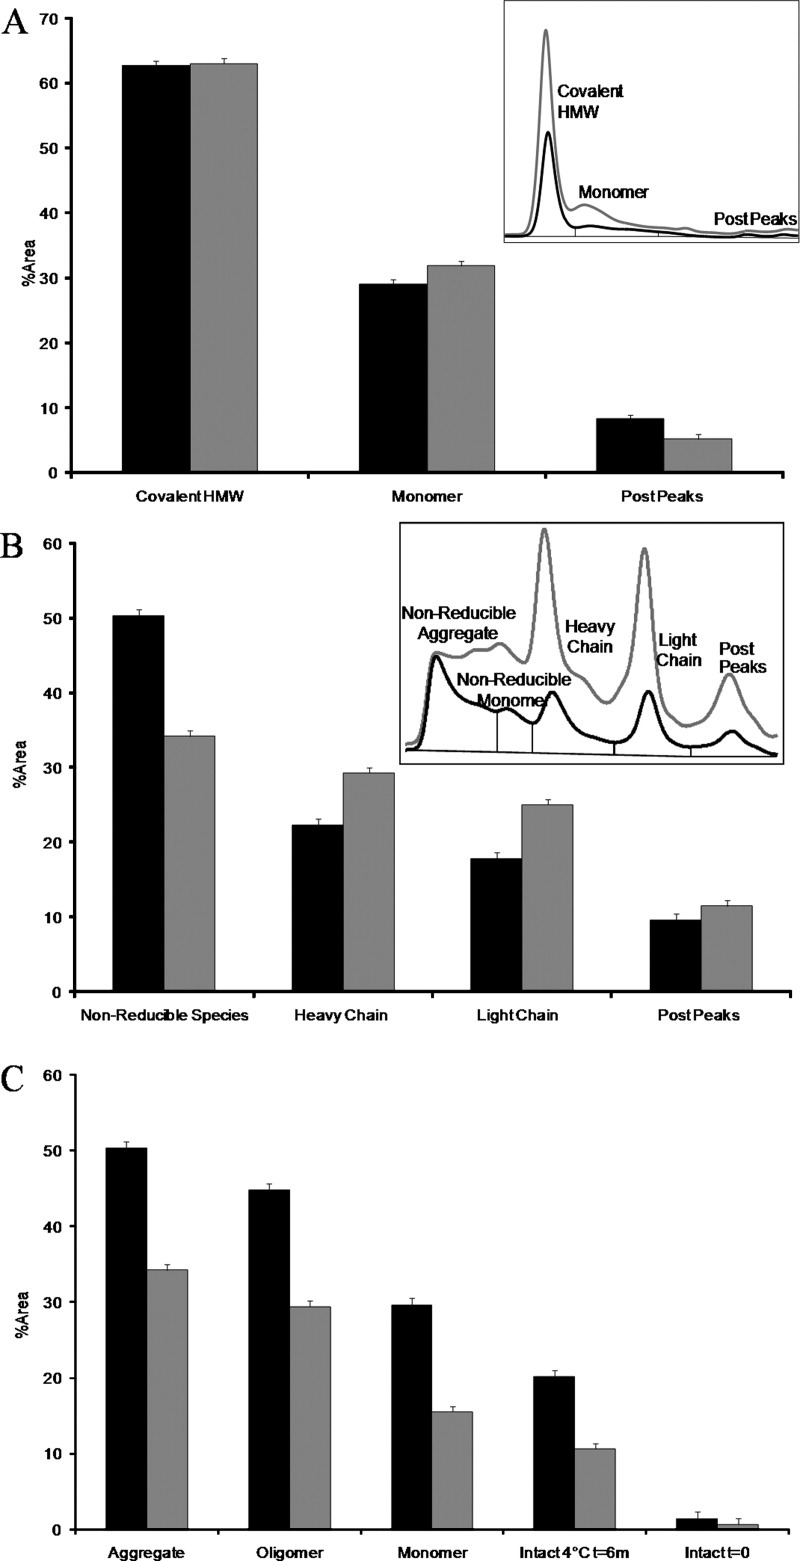
(A) Nonreduced SDS dSE-HPLC of both antiSA1 (black) and antiSA2 (gray) aggregate samples. The inset shows the chromatograms of the aggregate species, not normalized for sample load. (B) Reduced SDS dSE-HPLC of antiSA1 (black) and antiSA2 (gray) aggregate species showed that the IgG1 form displayed more nonreducible species and that aggregate was enriched in heavy chain. (C) Percent nonreducible species by reduced and denatured SDS dSE-HPLC of antiSA1 (black) and antiSA2 (gray) fractions. The inset shows the chromatograms of the aggregate species, not normalized for sample load. The error bars were calculated from the standard deviation of replicate injections over several runs.
The aggregate samples were also subject to reduction and alkylation to assess the relative levels of nonreducible and disulfide-linked aggregate, and the observations are shown in Figure 9(B). This time, there was a significant difference in the trend noted between the IgG1 and IgG2 purified aggregate samples: the IgG1 aggregate had a higher proportion of nonreducible HMW species compared with the IgG2 aggregate. In general, however, the presence of such large levels of nonreducible HMW species within each purified aggregate fraction was unexpected. To test whether this was method-induced, all of the fractions collected, as well as bulk sample, were examined using this method [Fig. 9 (C)]. The intact and unpurified samples for both antiSA1 and antiSA2 contained a very low amount (<2%) of nonreducible aggregate, which indicated that the high levels of nonreducible species in the aggregate fractions were not method-induced. Interestingly, a progression was seen in the levels of nonreducible species between the different samples: monomer fractions contained the least, followed by the oligomer fractions, and then the highest levels were found in the purified aggregate fraction. For each fraction, the antiSA1 form contained more nonreducible species compared with the antiSA2 form. All purified species contained approximately the same levels of fragmented product. In addition, both subclasses contained ∼62% covalent aggregate under nonreduced conditions. Upon reduction, the antiSA2 aggregate contained ∼27% reducible aggregate while antiSA1 had considerable less reducible aggregate at 12%.
Previous work has shown that antibody structures have free thiols.25 The differences in covalent character between the subclasses led us to interrogate whether the free thiol content in the two subclasses was different. The free thiol content of the intact antibody subclasses was assessed by completely unfolding the molecule using 5M guanidinium chloride, then measuring the absorbance at 412 nm in the presence of dithionitrobenzoate (DTNB). Strikingly, there was a 2.4-fold increase in free thiols per molecule in the IgG2 subclass (0.158 ± 0.004) compared with the IgG1 subclass (0.379 ± 0.016). The results show that on average, one out of every 13 or 5 IgG1 and IgG2 molecules contains a single broken disulfide bond, respectively.
DISCUSSION
Implications for monoclonal antibody aggregation
In this endeavor, we observed differences in aggregation behavior between the IgG1 and IgG2 forms of the same antibody. To understand the aggregation mechanism, oligomer and aggregate species of the two antibodies were purified and characterized using a variety of approaches at a single (neutral) pH. Other studies from Amgen examining pH trends on IgG1 and IgG2 aggregation will be published at a later time.
One question that arises from all these studies is: why was the IgG2 form of the antibody more prone to aggregation compared with the IgG1 form? One possibility was the intrinsic heterogeneity of the IgG2 molecule because of the existence of disulfide-mediated isoforms that were recently discovered.17,18 Potentially, the behavioral characteristics of these different isoforms are not identical and may have a role to play in this phenomenon. The existence and relative populations of these IgG2 isoforms of anti-streptavidin were not explored in this study. Another aspect to consider would be whether the recently discovered clip-mediated aggregation pathway26 was in some way more prevalent for IgG2 antibodies compared with IgG1. However, the IgG1 form tended to show greater fragmentation yet lower aggregation, so this clip-mediated mode of aggregation may be restricted to IgG2 antibodies for the most part.
Given the high degree of covalent character in the aggregates, our study suggested that the increase in aggregation of the IgG2 subclass was partly because of the 2.4-fold increase in free cysteines in the IgG2 form as detected by DTNB. Indeed, this theory is supported by a recent study with multiple antibodies,27 which showed a linear correlation between increased free thiol in the antibody and lower thermal stability (as monitored by thermal transition measurements). Although the IgG2 form aggregated to a greater extent in our work, the fraction of the total aggregate that was covalent was preserved between IgG1 and IgG2 forms. This suggested that the free thiols were responsible for increasing the rate of aggregation, although perhaps not the final covalent composition of the aggregate. One aspect to consider is that the relative contribution to covalent versus noncovalent aggregation would depend on the pH of the incubation. At neutral pH, it is expected to see a much greater contribution from disulfides than at pH 5. Indeed, the overall magnitude of the conformational changes was relatively small, consistent with previous observations, consistent with the recently proposed coagulation mechanism for antibody aggregation.5
Comparison of IgG1 and IgG2 aggregation characteristics: similarities and differences
Typically, differences between antibodies exist in their CDRs because of target specificity. These sequence differences often lead to different biochemical and biophysical behavior, which has been observed even within the same subclass class.28 IgG1 and IgG2 subclasses are structurally similar, consisting of 12 Ig-like domains with a conserved disulfide bond buried within each domain.29 The major difference between the subclasses originates from the highly flexible hinge region30; IgG1 and IgG2 have two and four disulfide bonds, respectively, and the IgG1 hinge is approximately two amino acids longer. The IgG1 and IgG2 anti-streptavidin antibodies used in this study had identical CDRs, but had 6% amino acid sequence differences in the hinge and heavy chain conserved regions. Increased hydrophobicity of a protein could potentially lead to higher aggregation rates.31 The variations in hydrophobicity between IgG1 and IgG2 anti-streptavidin are slight (grand average of hydropathicity index (GRAVY)32 scores of −0.396 for antiSA1 and −0.383 for antiSA2) indicating that changes in hydrophobicity were not a major determinant for the aggregation differences observed between the subclasses. It is unknown what directly leads to the aggregation differences, but it is presumed that this sequence variation and/or differences in amounts of free cysteine could potentially result in different aggregation rates and properties between the two subclasses as described in this work.
Similarities and differences in secondary and tertiary structural features were explored using a host of biophysical approaches. In the case of secondary structural features, both purified aggregate species were similar according to far-UV CD and Fourier transfer infrared spectroscopy (FTIR), with a few exceptions. The far-UV CD spectra of both antiSA1 and antiSA2 aggregates showed the same loss in ring stacking interactions and an increase in random structure as indicated by bands located at 230 and 198 nm, respectively, and a broadening of the β-sheet band at 217 nm. The FTIR spectra showed one noticeable difference between the aggregate species at 1610 cm−1, which was attributed to β-sheet: the IgG1 aggregate species had a complete loss in this band indicating heterogeneous β-sheet energies upon aggregation, whereas the IgG2 aggregate species had a shift in this band to a higher wavenumber indicating a shift in the β-sheet energy. This shift could be due to strong hydrogen bonding and the formation of distorted intermolecular β-sheets during aggregation.33 Distortion of existing secondary structures may point to a disruption in tertiary structure rather than global secondary structural rearrangements.
Near-UV CD spectroscopy revealed that the aggregates of both subclasses retained significant tertiary structure. The majority of the differences observed between subclasses originated from the tryptophan signals (290–295 nm). The near-UV CD spectra of the purified IgG1 aggregate species showed a change in local environments surrounding the tryptophan residues, whereas that of the IgG2 aggregate showed a more significant loss of structure in this region [Figs. 8(A,B)]. Interestingly, the tryptophan locations are conserved in both subclasses and the near-UV CD signal originating from the tryptophans for native IgG1 and IgG2 molecules are similar. Therefore, differences observed in near-UV CD signals during aggregation between the subclasses must arise from changes in the environments of the tryptophan residues, and not due to differences in tryptophan location. In addition, ANS binding data suggested that there may be a change in hydrophobic exposure in the purified aggregates compared with the monomer or oligomer samples, indicating an exposure of hydrophobic patches during the aggregation process, which may have been sequestered in the native molecule.
It has been established in the literature that proteins that contain disulfide bonds are more stable in their oxidized rather than their reduced forms.34,35 Recently, however, the impact that a reduced disulfide bond can play in multidomain antibodies has recently come to light.27 Lacy et al. demonstrated a correlation between antibody thermal stability and the extent of free cysteines present in a series of antibodies, with greater free cysteines translating to lower thermal stability. In other studies, it has been observed that antibodies and antibody constituent domains can contain free cysteines that can have a deleterious effect on protein stability and cause an increase in aggregation propensity.34,36,37 It also has been noted that antibody free cysteines appear to be in buried regions of immunoglobulin domains and become solvent-exposed during agitation, thus forming covalent aggregates consisting of non-native, intermolecular disulfide bonds that can stabilize and act as a nucleus for further aggregate propagation.37 In this study, the anti-streptavidin IgG2 molecule contained 2.4 times the free cysteines when compared with the IgG1 subclass. The thermal stability by DSC of the subclasses showed measurable differences with the IgG2 molecule having a decrease of ∼0.6°C in its apparent thermal melting temperature, which is consistent with a previous report.27 It is worth noting that as one of the major differences between IgG1 and IgG2 antibodies is the number of disulfide bonds that comprise the hinge; therefore, it is plausible that the covalent aggregate could be dictated by free cysteine reactivity from this region. However, it has been previously shown that the level of free cysteine in an IgG2 was negligible in the native state indicating hinge cysteines are involved in disulfide bonding37 and, therefore, it is plausible that the aggregation increase observed with IgG2 was due to domain instability associated with buried unpaired cysteines.
Additionally, the IgG2 subclass aggregated 2.4 times faster than the IgG1 molecule in this study. These results agree well with previously reported results36 showing that the presence of free cysteines had a more negative effect on the IgG2 subclass compared with the IgG1. Strengthening the argument, ∼10 and 30% of the covalent aggregate observed by SDS dSE-HPLC (denatured size-exclusion chromatography) for IgG1 and IgG2, respectively, was reducible. This indicated that free cysteines were involved in the covalent interaction, further suggesting that increased amounts of free cysteines in IgG2 led to greater levels of covalent aggregate in the IgG2 version.
However, the observed covalent aggregate differences between the subclasses cannot be explained solely by the formation of non-native, intermolecular disulfide bonds. The nonreduced SDS dSE-HPLC data showed the presence of ∼62% covalently associated HMW species for both subclasses. Upon reduction, the majority of these HMW species persisted, indicating that the majority of the covalent bonds may not be disulfide-mediated. A possible cause for these nonreducible aggregates could be through beta elimination. At neutral to alkaline pH, crosslinking reactions between a charged or polar amino acid (e.g., lysine or tyrosine) and serine or cysteine residues that have undergone a beta elimination reaction to form dehydroalanine crosslinks can occur and form nonreducible aggregates.38,39 It did not appear that these nonreducible aggregates were an artifact of sample preparation, as they were virtually nonexistent in nonstressed samples [Fig. 9(C)]. Interestingly, once the sample was stressed at neutral pH and 45°C for a period of time, all the isolated species contained nonreducible aggregate, increasing in order from monomer to small oligomer to aggregate. Further, the nonreducible species were always higher in the IgG1 samples. This may indicate real covalent differences that accompanied aggregation and differences between subclasses. The SDS dSE-HPLC data gave a deeper insight into the composition of the nonreducible aggregates. The SDS dSE-HPLC data were analyzed based on protein backbone detection at 215 nm; therefore, the theoretical percentages of heavy chain and light chain should be 66 and 33%, respectively, due to their molecular weights. However, the experimentally observed heavy chain percentage under reducing conditions for IgG1 and IgG2 was 23 and 30%, respectively, which was 66 and 55% lower than the theoretical percentages. A similar observation was noted for light chain, but to a lesser extent (45 and 25% reduction in light chain for IgG1 and IgG2, respectively, compared with their theoretical percentages). The significant loss in heavy chain indicated that the nonreducible covalent aggregate could consist of primarily of heavy chain. A detailed exploration of the mechanism of the nonreducible species would need further exploration.
In the future, a potential effort would be to determine the locations of free thiols in the antibody, and then distinguish areas of free thiols in IgG1 versus IgG2 subclasses. Another area of interest for the IgG2 antibodies would be to develop purification methods to effectively isolate the disulfide isoforms, characterize them, and directly compare their stability. Because of the intense interest in this area, we are likely to witness several important developments in the near future.
Materials and Methods
Materials
This study included 11 antibodies: four IgG1 and seven IgG2. The antibodies were produced by the Process and Product Development and Protein Science departments at Amgen (Thousand Oaks, CA). All antibodies were dialyzed into 10 mM sodium phosphate, 5% (w/v) sorbitol, pH 7.0 (N7S) using Slide-A-Lyzer 10K MWCO 3–12 mL dialysis cassettes (Pierce, Rockford, IL) and diluted with N7S to 20 mg/mL.
Determination of protein concentration
The samples were analyzed on an Agilent (Palo Alto, CA) UV/Vis spectrophotometer with Chemstation software. Samples were diluted 1:100 or 1:50 with N7S to achieve an absorbance at 280 nm of less than 1 absorbance unit. The absorbance at 280 nm was measured and the protein concentration was determined using the antibody-specific extinction coefficient. These extinction coefficients were obtained from the analytical summaries of the molecules.
Protein purification
Purification was performed on an Agilent (Palo Alto, CA) 1100 high-performance liquid chromatography (HPLC) system, using a TSKgel G3000SWXL 21.5 × 600 mm column (Tosoh Bioscience, Montgomeryville, PA) held at ambient temperature. Isocratic elution was performed at 1.3 mL/min using a mobile phase of 100 mM sodium phosphate, 150 mM NaCl, pH 6.9 over the course of 180 min. Sample detection was at 215 nm, and the resulting chromatograms were analyzed by integrating the area under each eluting peak and recorded as percent void volume aggregate, oligomer, and monomer. (The relative sizes of these species were later confirmed by SV-AUC measurements.) An Agilent G1160A 12/13 selection valve was used to collect the protein species based on their retention times.
Concentration and buffer exchange of purified protein species
After purification, the fractions were concentrated to ∼1 mL using Millipore Amicon Ultracel 30K MWCO regenerated cellulose filters (Millipore, Billerica, MA) at 3200 rpm in a Beckman centrifuge held at 4–10°C (Fullerton, CA) for periods of 20–30 minutes. After concentration, the proteins were buffer exchanged with N7S using Amicon Ultracel filter units; N7S buffer (1 mL) was added to the filter units and the samples were centrifuged at 4–10°C at 3200 rpm until a remaining volume of 1 mL was achieved (protein concentrations of 0.8–1.7 mg/mL). This process was repeated five times to complete the buffer exchange process.
Size-exclusion HPLC
SE-HPLC was performed on an Agilent (Palo Alto, CA) 1100 system using Dionex (Sunnyvale, CA) Chromeleon software. Two TSK-GEL G3000SWXL 7.8 mm × 30 cm, 5 μm particle, 250 Å pore columns (Tosoh Bioscience, Montgomeryville, PA) connected in tandem held at ambient temperature were used for separation. All antibodies eluted during an isocratic flow of 100 mM sodium phosphate, 150 mM NaCl, pH 6.9 at 0.5 mL/min for 52 min. Absorbance was monitored at 215 nm and the resulting chromatograms were analyzed by integrating the area under each eluting peak and recorded as percent void volume aggregate, oligomer, monomer, and postpeak species. An internal method validation report states the error in the SE-HPLC measurements is expected to be no more than ±0.383% from method qualification activities.
SDS-denatured size-exclusion HPLC
All samples were denatured with 2% sodium dodecyl sulfate (SDS), and N7S buffer was added for a final concentration of 0.5 mg/mL. For reduced samples, the cysteine residues in the samples were reduced using 15 mM dithiothreitol (Sigma, St. Louis, MO). The samples were heated for 15 min at 80°C. After cooling to room temperature, the reduced samples were treated with excess (20 mM) iodoacetamide (IAM, MP Biomedicals, Solon, OH) and equilibrated in the dark for 45 min. Nonreduced samples were treated with 15 mM IAM in the dark for 45 min. Sample loads were 10–25 μg and dSE-HPLC was performed on an Agilent (Palo Alto, CA) 1050 system using two TSK-GEL G3000SWXL 7.8 mm × 30 cm, 5 μm particle, 250 Å pore columns in tandem (Tosoh Bioscience, Montgomeryville, PA) at ambient temperature. The antibodies were eluted during 60 min of 0.5 mL/min flow of 100 mM sodium phosphate, 150 mM NaCl, pH 6.9, 0.02% SDS. Absorbance at 215 and 280 nm was measured, and the 215 nm signal was analyzed. The resulting chromatograms were analyzed by integrating the area under each eluting peak and recorded as percent covalent HMW, monomer, and fragmented protein (clips) under nonreducing conditions, and as percent nonreducible species, heavy chain, light chain, and fragmented protein (clips) under reducing conditions.
SDS-PAGE
Samples were analyzed using Novex 4–20% Tris-Glycine 1.0 mm × 10-well precast gels (Invitrogen, Carlsbad, CA). Samples were diluted in water to 1 mg/mL and then treated with Invitrogen sample buffer (69 mM Tris-HCl pH 7.0, 2.2% sodium dodecyl sulfate (SDS), 0.04% Bromophenol Blue, 22.2% glycerol) and 111 mM dithiothreitol (for reducing conditions) for a final concentration of 0.1 mg/mL. The sample load was 0.5 or 1 μg per lane. The molecular weight marker (200–2.5 kDa) was purchased from Invitrogen.
Circular dichroism
Protein samples were diluted with N7S to 0.3 mg/mL for far-UV CD and 0.7 mg/mL for near-UV CD. The CD measurements were obtained on a JASCO (model J-810) spectropolarimeter (Easton, MD). A 1 mm rectangular cuvette was used for far-UV CD and a 10 mm cylindrical cuvette for near-UV CD. Spectra were collected from 250 to 197 nm (far-UV) and 350 to 250 (near-UV) in continuous mode at a pitch of 0.5 nm, a speed of 20 nm/min, a response of 8 s, and a bandwidth of 1 nm. The sensitivity was 100 nmdeg, and three scans were collected and averaged for each spectrum. Measurements were performed at ambient temperature. The CD spectra of the buffer solutions were subtracted from the sample spectra, and the resulting data were converted from mdeg to molar ellipticity and plotted as a function of wavelength.
Differential scanning calorimetry
The samples were diluted to 0.5 mg/mL with N7S, and the concentration was confirmed by absorbance at 280 nm. The samples were analyzed on a MicroCal (Northampton, MA) capillary differential scanning calorimeter, using N7S in the reference cell. Samples were heated from 20°C to 90°C at a scan rate of 60°C per minute. Each buffer sample was scanned twice, whereas each protein sample was scanned once. Data were transferred to Origin (Northampton, MA) software for analysis, and the averaged buffer scans were subtracted from the protein scans. Data were normalized for protein concentration.
ANS binding experiment
8-Anilino-1-naphthalene sulfonic acid (ANS, TCI America, Portland, OR) was dissolved in water for a stock solution of 5 mM. Protein samples were diluted to 0.1 mg/mL with N7S buffer. A 10-mm cuvette was used for all measurements. To each sample, subsequent additions of 5 mM ANS stock were made (0, 0.9, 1.8, 1.8, 1.8, and 2.7 μL) to achieve the desired final concentrations (respectively, 0, 10, 30, 50, 70, and 100 μM). After each addition, the cuvette was inverted slowly 20 times (with the cap on) to ensure proper mixing and allow ∼1 min for the solution to equilibrate. Fluorescence measurements were conducted on a Photon Technology International (Birmingham, NJ) fluorometer at room temperature using Felix control software. Fluorescence emission spectra were obtained by excitation at 370 nm, and were collected in a range of 450–520 nm using a 1.00-mm slit on excitation and emission monochrometers. The data were analyzed by subtracting the respective buffer data (e.g., subtract the 30 μM buffer data from the 30 μM protein sample data). The wavelength at which the highest fluorescence signal was achieved was determined for all samples, and the average was calculated. The fluorescence (after buffer subtraction) at this average wavelength was plotted as a function of ANS concentration for each sample.
Free thiol content determination by DTNB
Protein samples were diluted to a concentration of 30 μM in 100 mM sodium phosphate, 2 mM EDTA, pH 8.0 with 5.0M guanidinium chloride and were equilibrated overnight at room temperature. 5,5′-Dithiobis-(2-nitrobenzoic acid) (DTNB, Sigma, St. Louis, MO) was dissolved in dimethyl sulfoxide for a 0.1M stock solution. Two millimolar DTNB was added to each protein sample (for a DTNB:protein ratio of 67:1), as well as to the sample buffer to be used as a reference solution. All samples were equilibrated for 15 min in the dark at room temperature. Absorbance at 412 nm was measured for the samples. Each protein sample was measured in triplicate. DTNB reacts with cysteine residues in a 1:1 stoichiometry, and releases thionitrobenzoate. Using Beer's Law and the extinction coefficient of thionitrobenzoate (13,600 M−1 cm−1) at 412 nm, the concentration of free cysteines was determined.
Sedimentation velocity analytical ultracentrifugation
The solution molecular weights were determined by sedimentation velocity analytical centrifugation measurements carried out using a Beckman XL-I analytical ultracentrifuge equipped with a An-60 Ti rotor and a photoelectric scanner (Beckman Instruments, Palo Alto, CA). The experiments were performed at 20°C. Sedimentation of the samples was monitored at an absorbance of 280 nm using a rotor speed of 50,000 rpm. The protein samples were loaded into a charcoal-epon double sector cell with quartz windows. All protein samples were formulated in N7S at a concentration of 0.5 mg/mL. The reference cell contained N7S. Analysis of the raw data was performed using SEDFIT, version 11.2 (freeware developed by Dr. Peter Schuck of NIH). The concentration distribution, c(S), was determined as a function of the sedimentation coefficient. The frictional ratio and meniscus were fitted for each scan. The fitted range of S-values was from 0.5 to 20 S, unless otherwise noted, using a resolution of 200 and a confidence interval of 0.68. The partial specific volume of the proteins was determined using the primary amino acid sequence and SEDNTERP software. Density determinations were performed on an Anton Paar DMA 5000 density meter (Anton Paar USA, Ashland, VA).
Fourier transfer infrared spectroscopy
Samples were concentrated to 10–70 mg/mL. The liquid samples were loaded between two calcium fluoride windows and scanned in a Bomem (Zurich, Switzerland) MB-104 FTIR spectrometer on Grams/32 software. For each sample, 128 absorbance scans from 400 to 4000 cm−1 were collected and averaged. A background scan (to assess the water vapor) was subtracted from each scan. For each sample, the appropriate buffer scan was subtracted, data were normalized for protein concentration, and second derivative of the spectra was determined.
Acknowledgments
The authors thank Sampath Krishnan for consistent FTIR analysis support, Christopher Sloey for assistance with FTIR data collection and analysis, Songpon Deechongkit and Cynthia Li for assistance with CD analysis, Riki Stevenson for sequence alignment, and Linda Narhi, Drew Kelner and David Brems for technical assistance and critical review. For supplying and/or facilitating supply of the proteins, the authors thank Tiansheng Li, Sampath Krishnan, Judy Purtell, Vasu Dharmavaram, Robert Rush, Jaby Jacob, Ramil Latypov, and Arnold McAuley.
Footnotes
Anti-streptavidin antibody abbreviated as antiSA (antiSA1 for IgG1 subtype and antiSA2 for IgG2 subtype).
References
- 1.Gelfand EW. Antibody-directed therapy: past, present, and future. J Allergy Clin Immunol. 2001;108:S111–S116. doi: 10.1067/mai.2001.117824. [DOI] [PubMed] [Google Scholar]
- 2.Usami A, Ohtsu A, Takahama S, Fujii T. The effect of pH, hydrogen peroxide and temperature on the stability of human monoclonal antibody. J Pharm Biomed Anal. 1996;14:1133–1140. doi: 10.1016/s0731-7085(96)01721-9. [DOI] [PubMed] [Google Scholar]
- 3.Kueltzo LA, Wang W, Randolph TW, Carpenter JF. Effects of solution conditions, processing parameters, and container materials on aggregation of a monoclonal antibody during freeze-thawing. J Pharm Sci. 2008;97:1801–1812. doi: 10.1002/jps.21110. [DOI] [PubMed] [Google Scholar]
- 4.Wang W, Singh S, Zeng DL, King K, Nema S. Antibody structure, instability, and formulation. J Pharm Sci. 2007;96:1–26. doi: 10.1002/jps.20727. [DOI] [PubMed] [Google Scholar]
- 5.Andersen CB, Manno M. Aggregation of a multidomain protea coagulation mechanism governs aggregation of a model IgG1 antibody under weak thermal stress. Protein Sci. 2010;19:279–290. doi: 10.1002/pro.309. [DOI] [PMC free article] [PubMed] [Google Scholar]
- 6.Hawe A, Kasper JC, Friess W, Jiskoot W. Structural properties of monoclonal antibody aggregates induced by freeze-thawing and thermal stress. Eur J Pharm Sci. 2009;38:79–87. doi: 10.1016/j.ejps.2009.06.001. [DOI] [PubMed] [Google Scholar]
- 7.Rathore N, Rajan RS. Current perspectives on stability of protein drug products during formulation, fill and finish operations. Biotechnol Prog. 2008;24:504–514. doi: 10.1021/bp070462h. [DOI] [PubMed] [Google Scholar]
- 8.Hermeling S, Crommelin DJ, Schellekens H, Jiskoot W. Structure-immunogenicity relationships of therapeutic proteins. Pharm Res. 2004;21:897–903. doi: 10.1023/b:pham.0000029275.41323.a6. [DOI] [PubMed] [Google Scholar]
- 9.Mahler HC, Friess W, Grauschopf U, Kiese S. Protein aggregation: pathways, induction factors and analysis. J Pharm Sci. 2009;98:2909–2934. doi: 10.1002/jps.21566. [DOI] [PubMed] [Google Scholar]
- 10.Kim Y, Wall JS, Meyer J, Murphy C, Randolph TW, Manning MC, Solomon A, Carpenter JF. Thermodynamic modulation of light chain amyloid fibril formation. J Biol Chem. 2000;275:1570–1574. doi: 10.1074/jbc.275.3.1570. [DOI] [PubMed] [Google Scholar]
- 11.Gabrielson JP, Brader ML, Pekar AH, Mathis KB, Winter G, Carpenter JF, Randolph TW. Quantitation of aggregate levels in a recombinant humanized monoclonal antibody formulation by size-exclusion chromatography, asymmetrical flow field flow fractionation, and sedimentation velocity. J Pharm Sci. 2007;96:268–279. doi: 10.1002/jps.20760. [DOI] [PubMed] [Google Scholar]
- 12.Lomas DA, Carrell RW. A protein structural approach to the solution of biological problems: alpha 1-antitrypsin as a recent example. Am J Physiol. 1993;265:L211–L219. doi: 10.1152/ajplung.1993.265.3.L211. [DOI] [PubMed] [Google Scholar]
- 13.Chiti F, Dobson CM. Protein misfolding, functional amyloid, and human disease. Annu Rev Biochem. 2006;75:333–366. doi: 10.1146/annurev.biochem.75.101304.123901. [DOI] [PubMed] [Google Scholar]
- 14.Chelius D, Jing K, Lueras A, Rehder DS, Dillon TM, Vizel A, Rajan RS, Li T, Treuheit MJ, Bondarenko PV. Formation of pyroglutamic acid from N-terminal glutamic acid in immunoglobulin gamma antibodies. Anal Chem. 2006;78:2370–2376. doi: 10.1021/ac051827k. [DOI] [PubMed] [Google Scholar]
- 15.Harris RJ. Processing of C-terminal lysine and arginine residues of proteins isolated from mammalian cell culture. J Chromatogr A. 1995;705:129–134. doi: 10.1016/0021-9673(94)01255-d. [DOI] [PubMed] [Google Scholar]
- 16.Srebalus Barnes CA, Lim A. Applications of mass spectrometry for the structural characterization of recombinant protein pharmaceuticals. Mass Spectrom Rev. 2007;26:370–373. doi: 10.1002/mas.20129. [DOI] [PubMed] [Google Scholar]
- 17.Dillon TM, Ricci MS, Vezina C, Flynn GC, Liu YD, Rehder DS, Plant M, Henkle B, Li Y, Deechongkit S, Varnum B, Wypych J, Balland A, Bondarenko PV. Structural and functional characterization of disulfide isoforms of the human IgG2 subclass. J Biol Chem. 2008;283:16206–16215. doi: 10.1074/jbc.M709988200. [DOI] [PMC free article] [PubMed] [Google Scholar]
- 18.Wypych J, Li M, Guo A, Zhang Z, Martinez T, Allen MJ, Fodor S, Kelner DN, Flynn GC, Liu YD, et al. Human IgG2 antibodies display disulfide-mediated structural isoforms. J Biol Chem. 2008;283:16194–16205. doi: 10.1074/jbc.M709987200. [DOI] [PMC free article] [PubMed] [Google Scholar]
- 19.Cathou RE, Kulczycki A, Haber E. Structural features of gamma-immunoglobulin, antibody, and their fragments. Circular dichroism studies. Biochemistry. 1968;7:3958–3964. doi: 10.1021/bi00851a024. [DOI] [PubMed] [Google Scholar]
- 20.Manning MC, Woody RW. Theoretical study of the contribution of aromatic side chains to the circular dichroism of basic bovine pancreatic trypsin inhibitor. Biochemistry. 1989;28:8609–8613. doi: 10.1021/bi00447a051. [DOI] [PubMed] [Google Scholar]
- 21.Cleland JL, Lam X, Kendrick B, Yang J, Yang TH, Overcashier D, Brooks D, Hsu C, Carpenter JF. A specific molar ratio of stabilizer to protein is required for storage stability of a lyophilized monoclonal antibody. J Pharm Sci. 2001;90:310–321. doi: 10.1002/1520-6017(200103)90:3<310::aid-jps6>3.0.co;2-r. [DOI] [PubMed] [Google Scholar]
- 22.Sreerama N, Manning MC, Powers ME, Zhang JX, Goldenberg DP, Woody RW. Tyrosine, phenylalanine, and disulfide contributions to the circular dichroism of proteins: circular dichroism spectra of wild-type and mutant bovine pancreatic trypsin inhibitor. Biochemistry. 1999;38:10814–10822. doi: 10.1021/bi990516z. [DOI] [PubMed] [Google Scholar]
- 23.Kosen PA, Creighton TE, Blout ER. Circular dichroism spectroscopy of bovine pancreatic trypsin inhibitor and five altered conformational states. Relationship of conformation and the refolding pathway of the trypsin inhibitor. Biochemistry. 1981;20:5744–5754. doi: 10.1021/bi00523a017. [DOI] [PubMed] [Google Scholar]
- 24.Lakowicz JR. Principles of fluorescence spectroscopy. 3rd Edition. New York: Springer; 2006. [Google Scholar]
- 25.Zhang W, Czupryn MJ. Free sulfhydryl in recombinant monoclonal antibodies. Biotechnol Prog. 2002;18:509–513. doi: 10.1021/bp025511z. [DOI] [PubMed] [Google Scholar]
- 26.Perico N, Purtell J, Dillon TM, Ricci MS. Conformational implications of an inversed pH- dependent antibody aggregation. J Pharm Sci. 2009;98:3031–3042. doi: 10.1002/jps.21539. [DOI] [PubMed] [Google Scholar]
- 27.Lacy ER, Baker M, Brigham-Burke M. Free sulfhydryl measurement as an indicator of antibody stability. Anal Biochem. 2008;382:66–68. doi: 10.1016/j.ab.2008.07.016. [DOI] [PubMed] [Google Scholar]
- 28.Fesinmeyer RM, Hogan S, Saluja A, Brych SR, Kras E, Narhi LO, Brems DN, Gokarn YR. Effect of ions on agitation- and temperature-induced aggregation reactions of antibodies. Pharm Res. 2009;26:903–913. doi: 10.1007/s11095-008-9792-z. [DOI] [PubMed] [Google Scholar]
- 29.Harris LJ, Larson SB, Hasel KW, Mcpherson A. Refined structure of an intact IgG2a monoclonal antibody. Biochemistry. 1997;36:1581–1597. doi: 10.1021/bi962514+. [DOI] [PubMed] [Google Scholar]
- 30.Roux KH, Strelets L, Michaelsen TE. Flexibility of human IgG subclasses. J Immunol. 1997;159:3372–3382. [PubMed] [Google Scholar]
- 31.Fink AL. Protein aggregation: folding aggregates, inclusion bodies and amyloid. Fold Des. 1998;3:R9–R23. doi: 10.1016/S1359-0278(98)00002-9. [DOI] [PubMed] [Google Scholar]
- 32.Kyte J, Doolittle RF. A simple method for displaying the hydropathic character of a protein. J Mol Biol. 1982;157:105–132. doi: 10.1016/0022-2836(82)90515-0. [DOI] [PubMed] [Google Scholar]
- 33.Dong A, Huang P, Caughey WS. Protein secondary structures in water from second-derivative amide I infrared spectra. Biochemistry. 1990;29:3303–3308. doi: 10.1021/bi00465a022. [DOI] [PubMed] [Google Scholar]
- 34.Thies MJ, Talamo F, Mayer M, Bell S, Ruoppolo M, Marino G, Buchner J. Folding and oxidation of the antibody domain C(H)3. J Mol Biol. 2002;319:1267–1277. doi: 10.1016/S0022-2836(02)00375-3. [DOI] [PubMed] [Google Scholar]
- 35.Mcauley A, Jacob J, Kolvenbach CG, Westland K, Lee HJ, Brych SR, Rehder D, Kleemann GR, Brems DN, Matsumura M. Contributions of a disulfide bond to the structure, stability, and dimerization of human IgG1 antibody CH3 domain. Protein Sci. 2008;17:95–106. doi: 10.1110/ps.073134408. [DOI] [PMC free article] [PubMed] [Google Scholar]
- 36.Feige MJ, Hagn F, Esser J, Kessler H, Buchner J. Influence of the internal disulfide bridge on the folding pathway of the CL antibody domain. J Mol Biol. 2007;365:1232–1244. doi: 10.1016/j.jmb.2006.10.049. [DOI] [PubMed] [Google Scholar]
- 37.Brych SR, Gokarn YR, Hultgen H, Stevenson RJ, Rajan R, Matsumura M. Characterization of antibody aggregation: role of buried, unpaired cysteines in particle formation. J Pharm Sci. 2010;99:764–781. doi: 10.1002/jps.21868. [DOI] [PubMed] [Google Scholar]
- 38.Correia JJ, Lipscomb LD, Lobert S. Nondisulfide crosslinking and chemical cleavage of tubulin subunits: pH and temperature dependence. Arch Biochem Biophys. 1993;300:105–114. doi: 10.1006/abbi.1993.1015. [DOI] [PubMed] [Google Scholar]
- 39.Linetsky M, Hill JM, Legrand RD, Hu F. Dehydroalanine crosslinks in human lens. Exp Eye Res. 2004;79:499–512. doi: 10.1016/j.exer.2004.06.026. [DOI] [PubMed] [Google Scholar]


