

Abstract
Protein adsorption on a surface plays an important role in biomaterial science and medicine. It is strongly related to the interaction between the protein residues and the surface. Here we report all-atom molecular dynamics simulations of the adsorption of an ionic complementary peptide, EAK16-II, to the hydrophobic highly ordered pyrolytic graphite surface. We find that, the hydrophobic interaction is the main force to govern the adsorption, and the peptide interchain electrostatic interaction affects the adsorption rate. Under neutral pH condition, the interchain electrostatic attraction facilitates the adsorption, whereas under acidic and basic conditions, because of the protonation and deprotonation of glutamic acid and lysine residues, respectively, the resulting electrostatic repulsion slows down the adsorption. We also found that under basic condition, during the adsorption peptide Chain II will be up against a choice to adsorb to the surface through the hydrophobic interaction or to form a temporary hydrophobic core with the deposited peptide Chain I. These results provide a basis for understanding some of the fundamental interactions governing peptide adsorption on the surface, which can shed new light on novel applications, such as the design of implant devices and drug delivery materials.
Keywords: ionic complementarity, peptide, adsorption, graphite
Introduction
The complexity of protein adsorption and its influence on cellular response has been demonstrated in both experimental and theoretical studies.1–11 Over the past years, colloidal models have been widely used to study the adsorption of proteins on charged surfaces.12–15 In these models, electrostatic interactions are described by the Poisson-Boltzmann equation, and van der Waals (vdW) interactions are described by the Hamaker approach. These methods, however, ignore the all-atomistic features of the proteins and treat the whole protein molecule as a particle. In recent years, atomic representation of proteins has been considered by a few groups in the protein adsorption simulations. While as a compromise between model accuracy and computational cost, normally the protein molecules are treated as being rigid,16–18 resulting in that the flexibility of proteins cannot be well considered. In one word, although it has been widely recognized that the study of protein adsorption is very important in the realm of materials design, little is understood at this time, and all-atom molecular dynamics (MD) simulations are expected to have the potential to address this problem by investigating the adsorption behaviors at the atomic level.19 Recently, N. Patra et al studied the folding of planar graphene nanostructures activated and guided by water droplets,20 which further excites people's interest in the bioinorganic interfacial systems involving biomacromolecules.21,22 Nowadays, it is generally considered that proteins are attracted or repelled by charged surfaces and adsorb strongly to hydrophobic surfaces. It is also suggested that adsorption is related to functional groups, not simply the degree of hydrophobicity or hydrophilicity.1,23
Our group has systemically studied the self-assembly and adsorption behavior of an ionic-complementary peptide, EAK16-II, a 16-mer peptide.24–28 Although the experimental findings are very promising, it is still necessary for us to verify these findings theoretically and to obtain the knowledge about the roles of different interaction compositions played in the adsorption. We have studied the adsorption of EAK16-II to a hydrophobic highly ordered pyrolytic graphite (HOPG) surface under physiological condition using all-atom MD method.29 In this study, we perform additional simulations to study the pH effect on the adsorption of EAK16-II to the HOPG surface. As EAK16-II can self-assemble, two peptide molecules were involved in our simulation systems. The HOPG surface was chosen for two reasons, one is because of the fact that it is simple and rigid, so that it can be treated as a rigid surface during the simulations, and the other is that it is an approximation of the pyrolytic carbon, which is widely used in implants such as cardiac valves.30 Interactions of different residues of the peptide with the surface and interchain interactions are also analyzed under neutral, acidic, and basic solution conditions. It is found that the hydrophobic interaction drives the adsorption of EAK16-II to the HOPG surface, and the electrostatic interaction affects the adsorption rate (Fig. 1). Under neutral condition, the adsorption will be enhanced through the electrostatic attraction between peptide molecules. While under acidic and basic conditions, the interchain electrostatic repulsion slows down the adsorption because of the change of the protonation and deprotonation state of glutamic acid and lysine residues. By studying the residue-surface and interchain interactions, we understand the mechanism of peptide adsorption on the hydrophobic surface, and further it provides us more detailed knowledge to reach the eventual goal of designing novel surface modification materials.
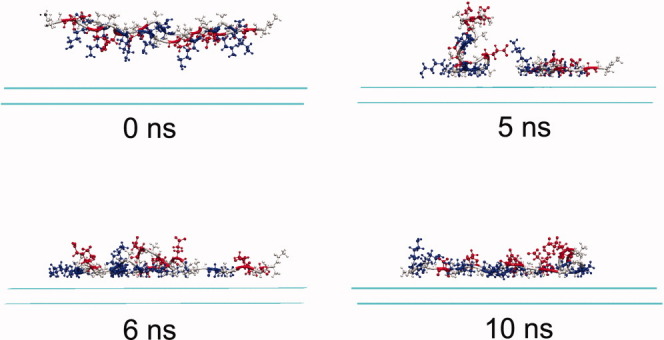
Figure 1.
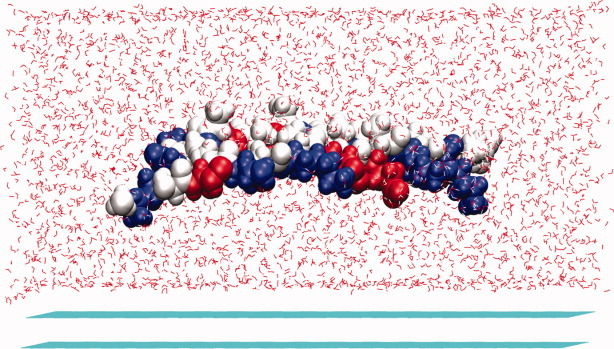
Snapshots of the peptide EAK16-II on the HOPG surface. The carbon atoms consisting of the HOPG surface are colored in cyan, water molecules are colored in red. The two peptide molecules are displayed with vdW spheres, and the three residues alanine, glutamic acid, and lysine are colored in grey, red, and blue, respectively. [Color figure can be viewed in the online issue, which is available at wileyonlinelibrary.com.]
Results
The peptide adsorption is characterized by the peptide-surface distance (Fig. 2), that is, the distance between the center of mass of the peptide chain and the top surface plane of HOPG. The focus of this article is to investigate the interactions of the peptide, EAK16-II, with the hydrophobic HOPG surface under different solution pH conditions. The interactions are classified into three components: the interaction of alanine residues with the surface, the interaction of lysine residues with the surface, and the interaction of glutamic acid residues with the surface (Figs. 3, 5, and 7). Under the acidic solution condition with pH lower than 4.25, the side-chain COO− functional groups of glutamic acid residues will be protonated to COOH and neutralized, resulting in the substantial reduction in the electrostatic attraction between the COOH and  functional groups. As a result, the repulsive force among positively charged lysine residues dominates the electrostatic interaction during the adsorption. The similar occurs when the groups of lysine residues are deprotonated to NH2 under the basic solution condition with pH higher than 10.50 (pKa of lysine). The change of different energy terms, for example, potential energy, van der Waals (vdW) energy and electrostatic energy, between two peptide molecules with respect to time are also provided in Figure 9. For the sake of convenience, the two peptide molecules are named Chain I and Chain II, respectively during the analysis, and a representative trajectory is selected to present the results.
Figure 2.
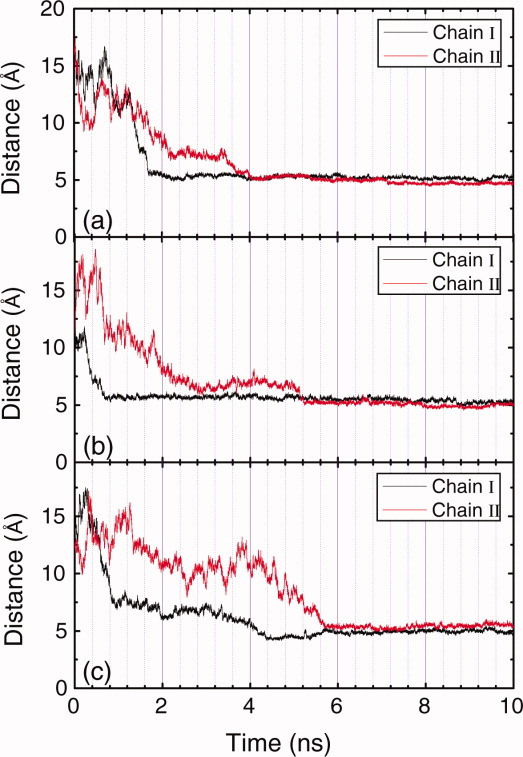
Time evolution plots of the peptide-surface distances under neutral condition (a), acidic condition (b), and basic condition (c), respectively. [Color figure can be viewed in the online issue, which is available at wileyonlinelibrary.com.]
Figure 3.
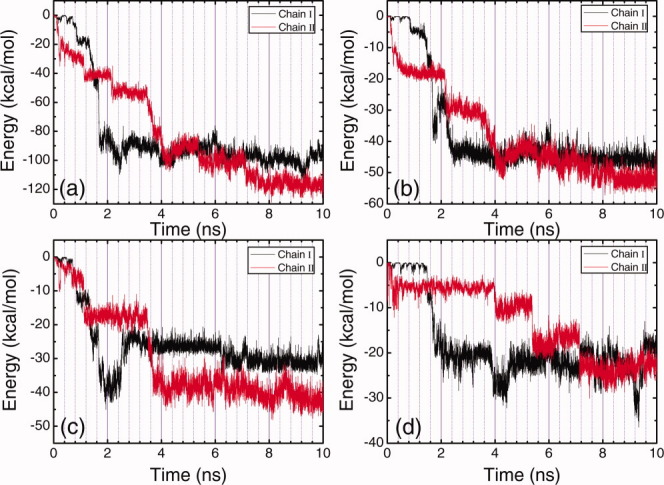
Time evolution plots of the total energy of each peptide molecule with HOPG surface (a), the energy of alanine residues in each peptide molecule with HOPG surface (b), the energy of lysine residues in each peptide molecule with HOPG surface (c), and the energy of glutamic acid residues in each peptide molecule with HOPG surface (d) under neutral condition. [Color figure can be viewed in the online issue, which is available at wileyonlinelibrary.com.]
Figure 5.
Time evolution plots of the total energy of each peptide molecule with HOPG surface (a), the energy of alanine residues in each peptide molecule with HOPG surface (b), the energy of lysine residues in each peptide molecule with HOPG surface (c), and the energy of glutamic acid residues in each peptide molecule with HOPG surface (d) under acidic condition. [Color figure can be viewed in the online issue, which is available at wileyonlinelibrary.com.]
Figure 7.
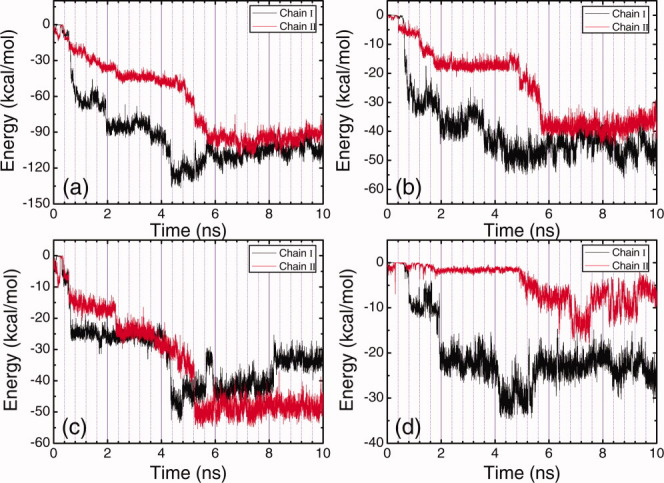
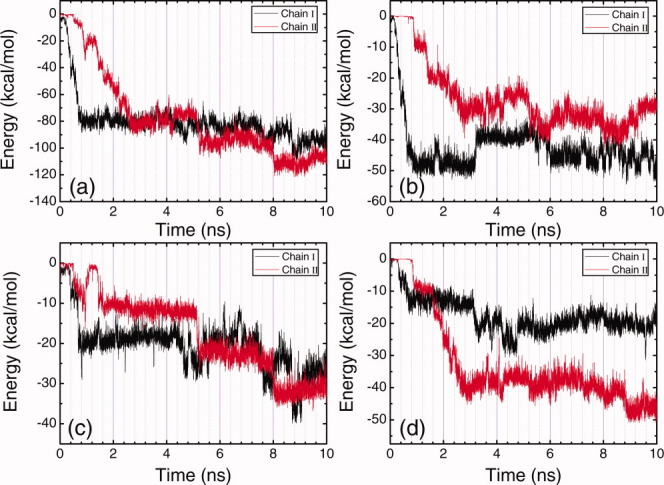
Time evolution plots of the total energy of each peptide molecule with HOPG surface (a), the energy of alanine residues in each peptide molecule with HOPG surface (b), the energy of lysine residues in each peptide molecule with HOPG surface (c), and the energy of glutamic acid residues in each peptide molecule with HOPG surface (d) under basic condition. [Color figure can be viewed in the online issue, which is available at wileyonlinelibrary.com.]
Figure 9.
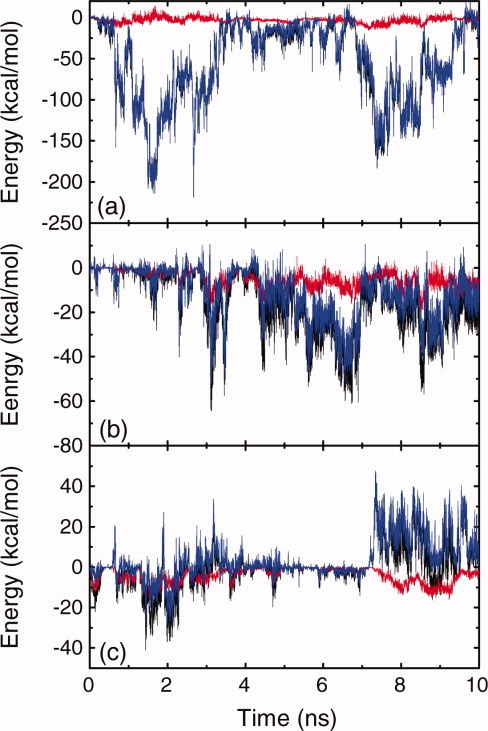
Time evolution of the total energy (black lines), the vdW energy (red lines), and the electrostatic energy (blue lines) between the two peptide molecules under neutral condition (a), acidic condition (b), and basic condition (c), respectively. [Color figure can be viewed in the online issue, which is available at wileyonlinelibrary.com.]
Peptide adsorption on the HOPG surface under neutral condition
Figure 2(a) shows the time evolution of peptide-surface distances under neutral solution condition. Adsorption of Chain I starts at 1.25 ns, and it completely adsorbs on the surface at 1.70 ns, taking 0.45 ns. Adsorption of Chain II is not as quick as that of Chain I. Starting from almost the same time point as the adsorption of Chain I begins, Chain II approaches to the surface gradually, and it completely deposits on the surface at around 4.0 ns. The adsorption of Chain II is much slower than that of Chain I, taking about 2.75 ns. The corresponding energy changes are presented in Figure 3, and the intuitive demonstration snapshots of the conformations of the peptide-surface system at different times are presented in Figure 4. During the adsorption process of Chain I, the energy between alanine residues of Chain I and the surface decreases 41.0 kcal/mol [Fig. 3(b)], and the energy between lysine residues of Chain I and the surface decreases 29.8 kcal/mol [Fig. 3(c)]. While the change of the energy between glutamic acid residues of Chain I and the surface responds slower, it does not decrease at the initial adsorption stage, see Figure 3(d). These energy changes indicate that the adsorption of Chain I is mainly governed by the interaction between hydrophobic alanine residues and the HOPG surface, and lysine residues also contribute to the adsorption in accelerating the adsorption rate due to their side-chain methylene groups. It should be noted that once positively charged lysine residues interact strongly with the negatively charged glutamic acid residues, the charge of lysine residues will be screened, and the methylene groups in lysine side-chain will result in strong hydrophobic effect and energy change. The strong electrostatic interaction between the two chains during the adsorption can also be observed in Figure 9(a). It is interesting that after Chain I deposits on the surface at 1.70 ns, an increase of the interaction energy between alanine residues and the surface is observed, accompanied with an continuing decrease of the energy between lysine residues and the surface, which indicates there is an over-rotation of the alanine side-chains during the adsorption process, and an adjustment for the side-chains of both hydrophobic alanine residues and charged lysine residues are made at that time.
Figure 4.
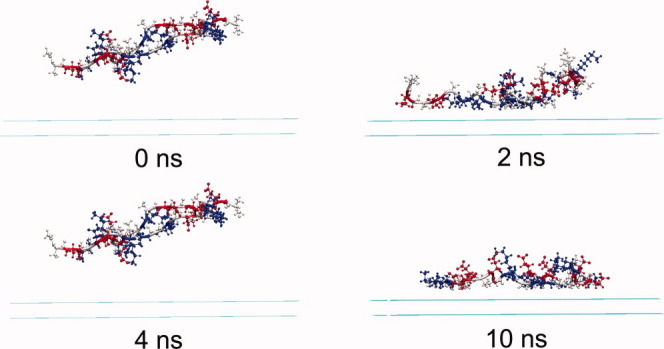
The snapshots of the peptide-surface system under neutral condition at different times. Water molecules are omitted for simplicity. Peptide molecules are displayed in CPK mode, and the three residues alanine, glutamic acid, and lysine are colored in grey, red, and blue, respectively. [Color figure can be viewed in the online issue, which is available at wileyonlinelibrary.com.]
The adsorption of Chain II is not as easy as Chain I, which takes much longer time and the energy changes during its adsorption process are more complicated. The interchain electrostatic interaction facilitates the two chains getting closer, and further assists in the adsorption of Chain II. When Chain II approaches to Chain I and the surface, because of the four hydrophobic methylene groups in each lysine residue, lysine residues also play a very important role in the adsorption of Chain II besides alanine residues. In addition, the electrostatic interaction causes the decrease of the energy between glutamic acid residues of Chain II and the surface at the beginning of the simulation [Fig. 3(d)]. At around 2.2 ns, there is a large structure rearrangement of Chain II to make the alanine residues approach closer to the surface [Figs. 3(b) and 4]. When Chain II almost completely deposits on the surface at around 4.0 ns, the electrostatic interaction between lysine residues and glutamic acid residues becomes significant. This brings the energy of glutamic acid residues in Chain I with the surface an obvious change, that is, decrease first and then increase [Fig. 3(d)], implying that the deposition of Chain II causes a structure adjustment of Chain I.
The results above indicate that under neutral condition, the deposition of the first chain on the HOPG surface affects the adsorption of the second one, and during the adsorption of Chain II, the interchain electrostatic interaction results in structure adjustments of both chains to make them more favorable on the hydrophobic surface. Once the peptide molecules deposit on the surface, they stay there steadily till the simulation stops [Fig. 2(a)], indicating that the adsorption of EAK16-II on the HOPG surface under neutral condition is very stable.
Peptide adsorption on the HOPG surface under acidic condition
The peptide-surface distances as a function of time under acidic condition are presented in Figure 2(b). The absorption of Chain I begins at 0.26 ns, and ends at 0.70 ns. The adsorption of Chain II, however, starts at 0.85 ns, which is after the complete deposition of Chain I on the surface. Chain II then approaches to the surface gradually, and completely deposits on the surface at around 5.1 ns. Figure 5 shows the corresponding energy changes, and Figure 6 presents the snapshots of the conformations of the peptide-surface system at different times. As glutamic acid residues are protonated and become neutral under acidic condition, the positively charged lysine residues get away from each other because of the electrostatic repulsion, and hydrophobic cores do not form between the two peptide molecules. During the adsorption of Chain I, a decrease of about 49.2 kcal/mol in the energy of alanine residues with the surface is observed [Fig. 5(b)] the decrease in the energy of lysine residues with the surface is about 20.0 kcal/mol [Fig. 5(c)], and the decrease in the energy of glutamic acid residues with the surface is about 13.5 kcal/mol. These figures in energy change indicate that the adsorption of Chain I is governed mainly by the interaction between alanine residues and the surface.
Figure 6.
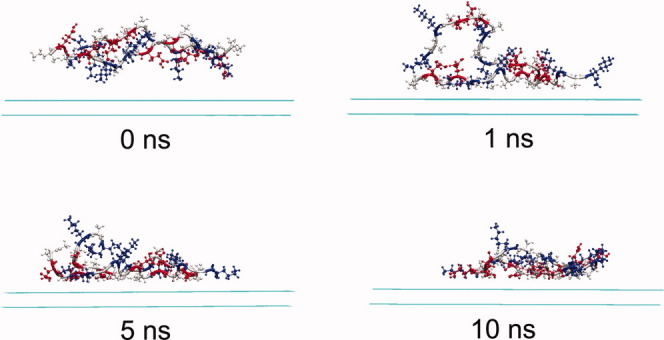
The snapshots of the peptide-surface system under acidic condition at different times. Water molecules are omitted for simplicity. Peptide molecules are displayed in CPK mode, and the three residues alanine, glutamic acid, and lysine are colored in grey, red, and blue, respectively. [Color figure can be viewed in the online issue, which is available at wileyonlinelibrary.com.]
Similar to the case under neutral condition, the adsorption of Chain II is not as easy as that of Chain I and takes longer time under acidic condition. The decrease in the energy of alanine residues with the surface is 29.8 kcal/mol, whereas the decrease in the energy of glutamic acid residues with the surface is 48.5 kcal/mol, which is much higher than the former one. The decrease in the energy of lysine residues with the surface is a bit lower comparing to the above energy changes. This result indicates that the adsorption of Chain II is governed mainly by the interaction between glutamic acid residues and the surface. As glutamic acid residues are protonated and neutralized under acidic condition, their side-chains induce stronger hydrophobic interaction with the surface than alanine residues do, and contribute a lot to the adsorption of Chain II. At around 3.2 ns, because Chain II is very close to the surface and Chain I, a structure adjustment of Chain I takes place, because of the electrostatic and hydrophobic interactions between the two chains. This results in an obvious change in the interchain interactions, see Figure 9(b). A corresponding increase in the energy of Chain I alanine residues with the surface is also observed at around 3.2 ns [Fig. 5(b)], implying an adjustment for the over-rotation of alanine side-chains in Chain I.
The above results indicate that under acidic condition, the adsorption of Chain I is fast and easy. At the initial adsorption process of Chain II, the interactions between the two peptide molecules are weak; however, when Chain II approaches to the surface and becomes close to Chain I, interchain interactions become significant and induce structure rearrangement of both chains, to reach a balance between peptide interchain interactions and peptide-surface hydrophobic interactions. After depositing on the surface, both peptide molecules will stay there stably till the end of the simulation [Fig. 2(b)].
Peptide adsorption on the HOPG surface under basic condition
The adsorption of EAK16-II under basic condition seems different from the cases under neutral and acidic conditions. As shown in Figure 2(c), the adsorption of both peptide molecules take long time, Chain I deposits completely on the surface at 4.3 ns, and Chain II finally deposits on the surface at 5.7 ns. Alanine and lysine residues almost contribute equally to the adsorption of Chain I with an energy decrease of about 50.0 kcal/mol, see Figures 7(b, c), and the decrease in the energy of glutamic acid residues in Chain I with the surface is about 31.0 kcal/mol. The substantive contribution of lysine residues for the adsorption comes from the four side-chain methylene groups. As under basic condition, lysine residues are deprotonated and become electrostatically neutral, the four side-chain methylene groups in each lysine residue will result in very strong hydrophobic interaction. For the adsorption of Chain II, after the deposition of Chain I on the surface the electrostatic repulsion between the two peptide molecules decreases [Fig. 9(c)], and dramatic energy decrease for both the energies of alanine residues and lysine residues with the surface is observed (Figs. 7(b, c)]. The glutamic acid residues, however, do not contribute to the adsorption of Chain II [Fig. 7(d)].
Unlike the cases for the adsorption under neutral and acidic conditions, Chain I and Chain II behave more cooperatively during the adsorption. As the long side-chains of lysine residues bring very strong hydrophobic interaction, a competition exists for the two peptide molecules between forming interchain hydrophobic cores and adsorbing to the hydrophobic surface during the adsorption. Eventually, the hydrophobic interaction of the two chains with the surface “wins” the battle, and they adsorb at the surface in the end (Fig. 8). After both peptide chains deposit on the surface, they approach to each other and an obvious electrostatic repulsion is observed in Figure 9(c). From viewing the trajectory files, it was observed that after depositing on the surface, most of lysine side-chains lay on the hydrophobic surface, while glutamic acid side-chains oriented towards the solution away from the surface, which is the origin of the strong electrostatic repulsion shown in Figure 9(c). During this structure adjustment, accompanying hydrogen bond forming and deforming were also observed.
Figure 8.
The snapshots of the peptide-surface system under basic condition at different times. Water molecules are omitted for simplicity. Peptide molecules are displayed in CPK mode, and the three residues alanine, glutamic acid, and lysine are colored in grey, red, and blue, respectively. [Color figure can be viewed in the online issue, which is available at wileyonlinelibrary.com.]
The above results indicate that both interactions of alanine and lysine residue with the surface dominate the adsorption of peptide EAK16-II on the HOPG surface, and the interaction between the two peptide molecules slows down the adsorption rate. After both peptide molecules deposit on the surface, the interplay among interchain electrostatic interaction, peptide-peptide hydrophobic interaction, and peptide-surface interaction will drive the system to reach a thermodynamically more favorable state, and cause corresponding structure adjustments of the peptide molecules. After depositing on the surface, both peptide molecules stay there stably till the end of the simulation [Fig. 2(b)]. Hydrogen bonding will play an important role in the succeeding peptide assembly process.
Discussion
The results of EAK16-II adsorption on the HOPG surface under neutral, acidic, and basic conditions show that hydrophobic interaction is the main driving force for the peptide to adsorb at the HOPG surface. During a normal protein folding process, it is considered that a fast hydrophobic collapse takes place at initial folding stages.31–35 However, because of the unique sequence of our ionic complementary peptide EAK16-II and the hydrophobicity of the HOPG surface, the peptide tends to proceed to forming a hydrophobic contact with the surface instead of forming intermolecular hydrophobic cores, which is consistent with the experiment findings. In experiment, we found that peptide EAK16-II does not tend to self-assemble in the acidic and basic solutions,27 while the HOPG surface coverage of peptide EAK16-II fibers does not change in either acidic or basic environment.28
Due to the different protonation/deprotonation state of glutamic acid and lysine residues under neutral, acidic, and basic conditions, the adsorption of peptide EAK16-II shows different behaviors. For the adsorption of EAK16-II under neutral and acidic conditions, the deposition of Chain I affects the subsequent adsorption process of Chain II. For the case in the neutral solution, the electrostatic interaction, mainly the electrostatic attraction between the oppositely charged residues, helps the two peptide chains get closer and facilitates the adsorption of Chain II. While for the case in the acidic solution, the electrostatic repulsion between the positively charged lysine residues induces the structure rearrangement of both chains when they approach to each other. For the adsorption of EAK16-II under basic condition, as lysine residues are protonated and become neutral, alanine and lysine residues contribute equally to the adsorption, and Chains I and II exhibit more cooperative adsorption behavior; in addition, the electrostatic repulsion between the negatively charged glutamic acid residues slows down the adsorption. Although the adsorption behaviors are quite different, eventually the peptide adsorbs at the surface very stably under three conditions except the adsorption rate varies, which is also in agreement with our experimental fingings.27,28 After the deposition of the peptide molecules on the HOPG surface, it is also found that the hydrophobic residue side-chains tend to lie on or stay close to the HOPG surface, whereas side-chains of charged residues prefer to orient toward the solution, away from the surface (Figs. 4, 6 and 8). This phenomenon is in agreement with the results from the ζ-potential measurements27 and the contact angle measurements,28 too. In addition, the hydrophobic side-chains have a potential to be closer to the graphite carbon atoms to attain the largest hydrophobic contact. An interesting thing is that because of the hexagonal structure of the HOPG lattice, particular orientations of the peptide principal axes and the assembled peptide fiber axes are observed in experiment.28 This phenomenon has also been observed for peptide adsorption on other surfaces.27,36 We examined the peptide structures from the trajectory files, although it is regretful that we did not observe the specific orientation of the whole peptide chain with respect to the HOPG lattice due to the small timescale that all-atom simulations could reach, we found that after depositing on the surface, most of the adjacent residues had a tendency to cover the surface in a manner parallel to the three horizontal crystallographic axes of the HOPG surface, also see our previous work for details.29 Analysis results based on the four independent trajectories do not show significant differences in the adsorption behaviors and the stability. To check whether changing pH would lead to the desorption of peptide EAK16-II from the surface, we further performed two short runs of simulation (1 ns for each run) based on the previous 10 ns simulations: one was to change the acidic environment to the basic one, the other was to change the basic environment to the acidic one. In the simulation, we did not observe the desorption of the peptide molecules from the surface, but interestingly, it is found that the newly introduced charged side-groups tend to orient toward the solvent away from the surface too, and the neutralized side-groups prefer to lie on the surface. This result further verifies our previous experimental findings that EAK16-II fibers cover the HOPG surface in a single-layer manner;28 otherwise, the variation of solution pH will induce the dissociation of the EAK16-II fibers on the HOPG surface.
Another interesting finding is that after the peptide molecules deposit on the surface, several long-lasting interchain hydrogen bonds are observed under all three different conditions, which implies hydrogen bonding will play an important role in the succeeding peptide assembly process. It should be noted that although interchain hydrogen bonds can be observed during the adsorption process, their lasting time is very short and these hydrogen bonds form and break frequently, indicating that the hydrogen bonding is very weak comparing to other interactions. It is considered that these frequently breaking-up hydrogen bonds are mainly the result of the structure change accompanied with the adjustment of residue-residue electrostatic and hydrophobic interactions. Electrostatic interaction is a very strong interaction during the adsorption, which governs the peptide molecules to get closer to each other, and hydrogen bonding interaction contributes to the following assembly of the peptide to fibers after the peptide molecules deposit on the HOPG surface.
Although the peptide adsorption is simulated in atomic details and much detailed interaction information is obtained, the limitations of our model system still exist, which lie in three aspects: First of all, under the consideration of the computational cost and efficiency, the two peptide chains are placed in a 70.0 × 70.0 × 40.0 Å3 water box, which corresponds to a very high peptide concentration of 17.0 mM; thus the model system is not large enough to adequately consider the diffusive behaviors of peptide chains in solution. Second, only four runs of simulation for each solution condition were performed in this work, although the adsorption processes are observed to occur in the same manner, we do not exclude the possibility of other adsorption manners. Third, further optimization of CHARMM force-field parameters were not made to perform these simulations. Nevertheless, the results compare favorably with trends observed experimentally, and the CHARMM force-field should be able to represent this type of molecular behavior. The agreement with experiment implies that our simulations have captured the essence of the adsorption of EAK16-II on the HOPG surface under neutral, acidic, and basic solution conditions.
Conclusions
In conclusion, all-atom MD simulations were performed in this work to investigate the roles of different residue-surface interactions played during the adsorption process of peptide EAK16-II on the HOPG surface under different pH conditions. Different interchain energy components, that is, electrostatic energy and vdW energy, were also analyzed. The hydrophobic effect, which arises mainly from the interaction between the methylene groups in residues' side-chains and the surface, is considered to govern the adsorption, and the interchain interactions are responsible for the adsorption rate. The results give us a clear picture of the whole adsorption process, and provide us the interaction basis for understanding protein/peptide adsorption on the surface under different solution conditions, which should be useful for some novel applications such as bioactive implant device and drug delivery material design.
Materials and Methods
Materials
The amphiphilic peptide EAK16-II (C70H121N21O25) has a sequence of AEAEAKAKAEAEAKAK, where A corresponds to alanine, E glutamic acid and K lysine. At neutral pH, A is neutral, whereas E and K are negatively and positively charged, respectively. Thus, the peptide chain has a charge distribution of −−++−−++, which determines the peptide chain's amphiphilic and ionic-complementary properties. Under acidic condition with pH lower than 4.25 (pKa of glutamic acid), the side-chain COO− groups of glutamic acid residues will be protonated; whereas under basic condition with pH higher than 10.50 (pKa of lysine), the side-chain groups of lysine residues will be deprotonated. The N-terminus and C-terminus of EAK16-II were protected by acetyl and amino groups, respectively.
The highly oriented pyrolytic graphite has a hexagonal crystal structure, which can serve as a model hydrophobic surface. A two-layered HOPG surface (0001) was constructed for this study using the program CHARMM.37 Starting from a coordinate file of the primitive cell, the surface was initially generated by creating the appropriate images of the central unit cell using the IMAGE facility of CHARMM, with the surface on the xy plane. That is, from the primitive cell, a surface was created by replicating it 45 × 45 times according to the above image generating rule, and then the surface was trimmed to make the surface plane having the dimensions of 70.0 × 70.0 Å2.
MD simulations
Molecular dynamics simulations were performed using the program CHARMM with the all-hydrogen parameter set PARAM27.37 Under the acidic condition, glutamic acid residues were protonated, and under the basic condition, lysine residues were deprotonated. Counter chloride and sodium ions were added to neutralize the system under the acidic and basic conditions, respectively. Before simulating the adsorption process, for each of the neutral, acidic, and basic environments, two short MD simulations were performed on the peptide in vacuum (300 K, 100 ps, 1 fs time step) respectively to generate two sets of initial random EAK16-II configurations. The two randomly structured peptide molecules were then placed 18.0 Å (13.0 Å for acidic and basic conditions, determined by the center of mass of the peptide molecule) above the top layer of the HOPG surface in a head-to-tail mode, with the peptide chains parallel to the surface plane. There were four manners for us to place the two peptide molecules: (a) for each peptide molecule, alanine residue side-chains point to the surface; (b) for each peptide molecule, glutamic acid and lysine residue side-chains point to the surface; (c) one peptide molecule was placed in manner (a), whereas the other one was placed in manner (b); (d) both peptide molecules were placed with most side-chains parallel to the HOPG surface. The initial center of mass distance between the two peptide chains was 20.0 Å. TIP3P water molecules were then added surrounding the two peptide molecules to create a 70.0 × 70.0 × 40.0 Å3 solvent environment. Water molecules falling within a 2.8 Å radius from the center of non-hydrogen atoms were deleted to establish the simulation system. The periodic boundary condition was applied in the x and y directions.
Once the initial system was created, four independent runs of simulations for each environment corresponding to the four peptide placement manners were then carried out. For each run, the system was first energy-minimized using the steepest descent method for 50 steps without any restraint. Then the backbones of the two peptide molecules were harmonically restrained with a force constant of 20.0 kcal/mol/Å2, and the system was energy-minimized again using the adopted basis Newton-Raphson method for 500 steps, which was then repeated twice with a restraint force constant of 10.0 kcal/mol/Å2 and 5.0 kcal/mol/Å2, respectively. The entire system was further minimized for another 1000 steps without any restraint. After that, the system was heated to 300 K, and stayed at this temperature for equilibrium for 50 ps. The self-guided molecular dynamics38,39 simulations were then performed at 300 K in the canonical (NVT) ensemble with a local sampling time of 0.2 ps and a guiding temperature factor of 1.0. During the simulations, the SHAKE algorithm was used to fix the lengths of bonds involving hydrogen atoms, and a 12 Å effective nonbonded cutoff distance was used by applying a shifting function. The particle mesh Ewald algorithm was used for calculating the electrostatic interactions. All the coordinates of the carbon atoms of HOPG were fixed during the simulations. Configurations of the peptide molecule obtained from simulations were saved every 1.0 ps for analysis. The time step of integration for the potential energy of the system was taken as 1.0 fs. The length of each run of the simulations is 10.0 ns.
Acknowledgments
The molecular dynamics simulations were made possible by the facilities of the Shared Hierarchical Academic Research Computing Network (SHARCNET: http://www.sharcnet.ca).
References
- 1.Andrade JD, Hlady V, Wei AP. Adsorption of complex proteins at interfaces. Pure Appl Chem. 1992;64:1777–1781. [Google Scholar]
- 2.Webb K, Hlady V, Tresco PA. Relative importance of surface wettability and charged functional groups on NIH 3T3 fibroblast attachment, spreading, and cytoskeletal organization. J Biomed Mater Res. 1998;41:422–430. doi: 10.1002/(sici)1097-4636(19980905)41:3<422::aid-jbm12>3.0.co;2-k. [DOI] [PMC free article] [PubMed] [Google Scholar]
- 3.Schamberger PC, Gardella JA., Jr Surface chemical modifications of materials which influence animal cell adhesion: a review. Colloid Surf B Biointerfaces. 1994;2:209–223. [Google Scholar]
- 4.Larsen CC, Kligman F, Kottke-Marchant K, Marchant RE. The effect of RGD fluorosurfactant polymer modification of ePTFE on endothelial cell adhesion, growth, and function. Biomaterials. 2006;27:4846–4855. doi: 10.1016/j.biomaterials.2006.05.009. [DOI] [PMC free article] [PubMed] [Google Scholar]
- 5.Lahann J, Klee D, Pluester W, Hoecker H. Bioactive immobilization of r-hirudin on CVD-coated metallic implant devices. Biomaterials. 2001;22:817–826. doi: 10.1016/s0142-9612(00)00244-1. [DOI] [PubMed] [Google Scholar]
- 6.Chinn JA, Sauter JA, Phillips RE, Kao WJ, Anderson JM, Hanson SR, Ashton TR. Blood and tissue compatibility of modified polyester: Thrombosis, inflammation, and healing. J Biomed Mater Res. 1998;39:130–140. doi: 10.1002/(sici)1097-4636(19980101)39:1<130::aid-jbm15>3.0.co;2-j. [DOI] [PubMed] [Google Scholar]
- 7.Toublan FJ, Boppart S, Suslick KS. Tumor targeting by surface-modified protein microspheres. J Am Chem Soc. 2006;128:3472–3473. doi: 10.1021/ja0544455. [DOI] [PubMed] [Google Scholar]
- 8.Willett RL, Baldwin KW, West KW, Pfeiffer LN. Differential adhesion of amino acids to inorganic surfaces. Proc Natl Acad Sci. 2005;102:7817–7822. doi: 10.1073/pnas.0408565102. [DOI] [PMC free article] [PubMed] [Google Scholar]
- 9.Hlady H, Buijs J. Protein adsorption on solid surfaces. Curr Opin Biotechnol. 1996;7:72–77. doi: 10.1016/s0958-1669(96)80098-x. [DOI] [PMC free article] [PubMed] [Google Scholar]
- 10.Ostuni E, Chapman RG, Holmlin RE, Takayama S, Whitesides GM. A survey of structure-property relationships of surfaces that resist the adsorption of protein. Langmuir. 2003;17:5605–5620. [Google Scholar]
- 11.Kane RS, Deschatelets P, Whitesides GM. Kosmotropes form the basis of protein-resistant surfaces. Langmuir. 2003;19:2388–2391. [Google Scholar]
- 12.Gray JJ. The interaction of proteins with solid surfaces. Curr Opin Struct Biol. 2004;14:110–115. doi: 10.1016/j.sbi.2003.12.001. [DOI] [PubMed] [Google Scholar]
- 13.Malmsten M. Formation of adsorbed protein layers. J Colloid Interface Sci. 1998;207:186–199. doi: 10.1006/jcis.1998.5763. [DOI] [PubMed] [Google Scholar]
- 14.Morra M. On the molecular basis of fouling resistance. J Biomater Sci Polym Ed. 2000;11:547–569. doi: 10.1163/156856200743869. [DOI] [PubMed] [Google Scholar]
- 15.Roth CM, Lenhoff AM. Quantitative modeling of protein adsorption. Surfactant Science Series. 1998;75:89–118. [Google Scholar]
- 16.Lu DR, Park K. Protein adsorption on polymer surfaces: Calculation of adsorption energies. J Biomater Sci Polym Ed. 1990;1:243–260. doi: 10.1163/156856289x00136. [DOI] [PubMed] [Google Scholar]
- 17.Noinville V, Vidalmadjar C, Sebille B. Modeling of protein adsorption on polymer surface: computation of adsorption potential. J Phys Chem. 1995;99:1516–1522. [Google Scholar]
- 18.Ravichandran S, Madura JD, Talbot JA. A Brownian dynamics study of the initial stages of hen egg-white lysozyme adsorption at a solid surface. J Phys Chem B. 2001;105:3610–3613. [Google Scholar]
- 19.Latour RA. Molecular simulation of protein-surface interactions: Benefits, problems, solutions, and future directions (Review) Biointerphases. 2008;3:FC2–FC12. doi: 10.1116/1.2965132. [DOI] [PMC free article] [PubMed] [Google Scholar]
- 20.Patra N, Wang B, Král P. Nanodroplets activated and guided folding of graphene nanostructures. Nano Lett. 2009;9:3766–3771. doi: 10.1021/nl9019616. [DOI] [PubMed] [Google Scholar]
- 21.Crespi VH. Nanotechnology: Soggy origgami. Nature. 2009;462:858–859. doi: 10.1038/462858a. [DOI] [PubMed] [Google Scholar]
- 22.Prpich AM, Sheng Y, Wang W, Biswas ME, Chen P. Tension at the surface: Which phase is more important, liquid or vapor? PLoS One. 2009;4:e8281. doi: 10.1371/journal.pone.0008281. [DOI] [PMC free article] [PubMed] [Google Scholar]
- 23.Lewandowska K, Pergament E, Sukenik CN, Culp LA. Cell-type-specific adhesion mechanisms mediated by fibronectin adsorbed to chemically derivatized substra. J Biomed Mater Res. 1992;26:1343–1363. doi: 10.1002/jbm.820261007. [DOI] [PubMed] [Google Scholar]
- 24.Fung SY, Keyes C, Duhamel J, Chen P. Concentration effect on the aggregation of a self-assembling oligopeptide. Biophy J. 2003;85:537–548. doi: 10.1016/S0006-3495(03)74498-1. [DOI] [PMC free article] [PubMed] [Google Scholar]
- 25.Hong Y, Legge RL, Zhang S, Chen P. Effect of amino acid sequence and pH on nanofiber formation with self-assembling peptides EAK16-II and EAK16-IV. Biomacromolecules. 2003;4:1433–1442. doi: 10.1021/bm0341374. [DOI] [PubMed] [Google Scholar]
- 26.Jun S, Hong Y, Immamura H, Ha BY, Bechhoefer J, Chen P. Self assembly of the ionic peptide EAK16: The effect of charge districutions on self-assembly. Biophy J. 2004;87:1249–1259. doi: 10.1529/biophysj.103.038166. [DOI] [PMC free article] [PubMed] [Google Scholar]
- 27.Yang H, Fung SY, Pritzker M, Chen P. Surface-assisted assembly of an ionic-complementary peptide: controllable growth of nanofibers. J Am Chem Soc. 2007;129:12200–12210. doi: 10.1021/ja073168u. [DOI] [PubMed] [Google Scholar]
- 28.Yang H, Fung SY, Pritzker M, Chen P. Modification of hydrophilic and hydrophobic surfaces using an ionic-complementary peptide. PLoS One. 2007;2:e1325. doi: 10.1371/journal.pone.0001325. [DOI] [PMC free article] [PubMed] [Google Scholar]
- 29.Sheng Y, Wang W, Chen P. Adsorption of an ionic complementary peptide on the hydrophobic graphite surface. J Phys Chem C. 2010;114:454–459. doi: 10.1002/pro.444. [DOI] [PMC free article] [PubMed] [Google Scholar]
- 30.Feng L, Andrade JD. Protein adsorption on low temperature isotropic carbon: V. how is it related to its blood compatibility? J Biomater Sci Polym Ed. 1995;7:439–452. doi: 10.1163/156856295x00445. [DOI] [PubMed] [Google Scholar]
- 31.Mirny L, Shakhnovich E. Protein folding theory: From lattice to all-atom models. Annu Rev Biophy Biomol Struct. 2001;30:361–369. doi: 10.1146/annurev.biophys.30.1.361. [DOI] [PubMed] [Google Scholar]
- 32.Wolynes PG, Onuchic JN, Thirumalai D. Navigating the folding routes. Science. 1995;267:1619–1620. doi: 10.1126/science.7886447. [DOI] [PubMed] [Google Scholar]
- 33.Daggett V, Fersht AR. The present view of the mechanism of protein folding. Nature Rev Mol Cell Biol. 2003;4:497–502. doi: 10.1038/nrm1126. [DOI] [PubMed] [Google Scholar]
- 34.Jackson SE, elMasry N, Fersht AR. Structure of the hydrophobic core in the transition state for folding of chymotrypsin inhibitor 2: a critical test of the protein engineering method of analysis. Biochem. 1993;32:11270–11278. doi: 10.1021/bi00093a002. [DOI] [PubMed] [Google Scholar]
- 35.Sheng Y, Wang W. Comparative all-atomic study of unfolding pathways for proteins CI2 and barnase. Physical Review E. 2006;73:021915. doi: 10.1103/PhysRevE.73.021915. [DOI] [PubMed] [Google Scholar]
- 36.Karsai Á, Murvai Ü, Soós K, Penke B, Kellermayer MSZ. Oriented epitaxial growth of amyloid fibrils of the N27C mutant β25-35 peptide. Eur Biophy J. 2008;37:1133–1137. doi: 10.1007/s00249-007-0253-0. [DOI] [PubMed] [Google Scholar]
- 37.Brooks BR, Bruccoleri RE, Olafson BD, States DJ, Swaminathan S, Karplus M. CHARMM: a program for macromolecular energy, minimization and dynamics calculations. J Comput Chem. 1983;4:187–217. [Google Scholar]
- 38.Wu X, Wang S, Brooks BR. Direct observation of the folding and unfolding of a β-hairpin in explicit water through computer simulation. J Am Chem Soc. 2002;124:5282–5283. doi: 10.1021/ja0257321. [DOI] [PMC free article] [PubMed] [Google Scholar]
- 39.Wu X, Brooks BR. Self-guided Langevin dynamics simulation method. Chem Phys Lett. 2003;381:512–518. [Google Scholar]