Abstract
Peripheral subunit binding domains (PSBDs) are integral parts of large multienzyme complexes involved in carbohydrate metabolism. PSBDs facilitate shuttling of prosthetic groups between different catalytic subunits. Their protein surface is characterized by a high density of positive charges required for binding to subunits within the complex. Here, we investigated folding thermodynamics and kinetics of the human PSBD (HSBD) using circular dichroism and tryptophan fluorescence experiments. HSBD was only marginally stable under physiological solvent conditions but folded within microseconds via a barrier-limited apparent two-state transition, analogous to its bacterial homologues. The high positive surface-charge density of HSBD leads to repulsive Coulomb forces that modulate protein stability and folding kinetics, and appear to even induce native-state movement. The electrostatic strain was alleviated at high solution-ionic-strength by Debye-Hückel screening. Differences in ionic-strength dependent characteristics among PSBD homologues could be explained by differences in their surface charge distributions. The findings highlight the trade-off between protein function and stability during protein evolution.
Keywords: fast protein folding, Coulomb interactions, Debye-Hückel screening, barrier-limited folding
Introduction
The pyruvate dehydrogenase (PDH) multienzyme complex is central to oxidative metabolism. Covalently attached prosthetic groups and their associated protein domains are integral part of the multienzyme assembly and are essential to the mechanisms of active-site coupling and substrate channeling.1 Peripheral subunit-binding domains (PSBDs) are small, 5-kDa protein domains that facilitate shuttling of prosthetic groups between different catalytic subunits within the PDH multienzyme complex. PSBDs are among the smallest, independently folding proteins and exhibit ionic-strength dependent characteristics of varying degree2,3 caused by the presence of charged side chains on the protein surface. These charged residues are required for binding to catalytic subunits via electrostatic interactions.4 Mutations in the binding interface of the human PDH enzyme complex give rise to various diseases.5
PSBDs isolated from mesophilic (BBL), thermophilic (E3BD), and hyperthermophilic (POB) bacteria share near-identical solution structures and similar sequences, making them a valuable system to dissect the roles of sequence and structure in protein folding and stability.3 The bacterial homologues fold in microseconds via a barrier-limited, apparent two-state transition through similar, structurally diffuse transition states.6–8 Comparison of transition state structures shows some degree of plasticity, which can be explained by differences in sequence propensities of individual sequence areas to form helical secondary structure.7
Here, we characterized the folding of the PSBD from human PDH (HSBD) using far-UV circular dichroism (CD), steady-state tryptophan (Trp) fluorescence, and temperature jump (T-jump) Trp fluorescence spectroscopy. HSBD shares high sequence and structural similarity with its homologues and folded cooperatively on the 100-μs time scale via an apparent two-state mechanism. The stability of HSBD was dramatically dependent on solution ionic strength. Observations could be rationalized by the high positive charge density on the HSBD protein surface, which exceed those of the bacterial homologues.
Results
Sequence and structural homology within the PSBD family
Figure 1 shows the sequence and structure alignment of HSBD with its bacterial homologues E3BD, POB, and BBL. PSBD sequences have a substantial number of conserved and similar residues. The crystal structure5 of HSBD aligns well with the NMR solution structures3 of E3BD, POB, and BBL. The topology of the fold is largely retained, with helix 1 and helix 2 separated by a short 310-helix and an irregular loop. The second helix of HSBD, however, is substantially elongated compared to its homologues. Further, the N-terminal end of HSBD forms one helical turn distinct from helix 1. Analogous sequence segments in the bacterial homologues are unstructured.
Figure 1.
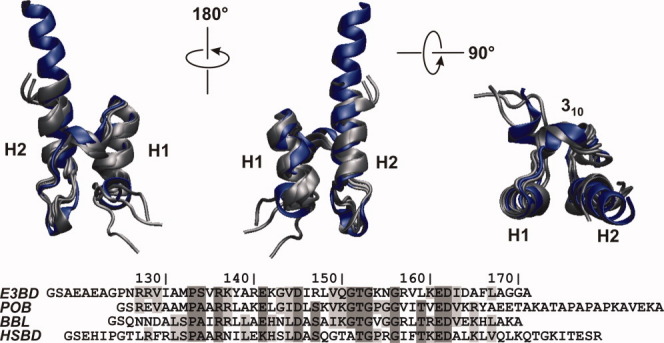
Structure and sequence alignment of PSBD family members. Top: alignment of solution NMR structures of E3BD (pdb id 1W3D), POB (1W4I), and BBL (1W4H), shown in gray, with the X-ray crystal structure of HSBD (2F60), shown in blue. Structures are depicted in three different orientations with helix 1 (H1), helix 2 (H2), and 310-helical turn (310) indicated. Flexible terminal tails are omitted for clarity. Bottom: Sequence alignment of PSBDs. Identical and similar residues are indicated by dark and light gray boxes, respectively. N-terminal glycine and serine (GS) result from a thrombin cleavage site introduced as part of the protein synthesis and purification protocol. [Color figure can be viewed in the online issue, which is available at wileyonlinelibrary.com.]
The HSBD construct used in crystallographic studies5 contains six artificial C-terminal histidine residues (His-tag) that have been introduced for protein purification, which might modify the helix forming propensity at the site. In this study, we expressed HSBD with the Gro-EL apical domain as an N-terminal fusion protein that could be removed by thrombin cleavage, and replaced the six His residues at the C-terminus of the crystallographic construct with the natural sequence (Fig. 1, see Materials and Methods).
The stability of HSBD is strongly dependent on solution ionic strength
We studied the thermal stability of HSBD at various solvent conditions by far-UV CD spectroscopy. The CD spectrum was characteristic for an all-helical protein with a pronounced minimum at 222 nm [Fig. 2(A), inset]. Thermal denaturation monitored by ellipticity at that wavelength fitted well to a thermodynamic model of a two-state equilibrium with a discrete change in heat capacity between native and denatured states (see Materials and Methods) and a temperature-dependent enthalpy of unfolding. Thermal denaturation was fully reversible as judged by near-identical thermal denaturation profiles obtained from reversing the temperature ramp (data not shown). At 0.2 M ionic strength, HSBD was only marginally stable. We determined the stability as function of solution pH [Fig. 2(A,B)]. There was a small stability increase from  = 0.6 kcal/mol at pH 6.4 to
  = 1.0 kcal/mol at pH 8.8. By contrast, stability increased dramatically with ionic strength [Fig. 2(C,D)]. At low ionic strengths (<1 M), there was a significant loss of native-state ellipticity. The stability of HSBD followed the Debye-Hückel law for shielding of Coulombic potential, depending on the square root of the ionic strength9 up to 1 M salt [Fig. 2(E)].
Figure 2.
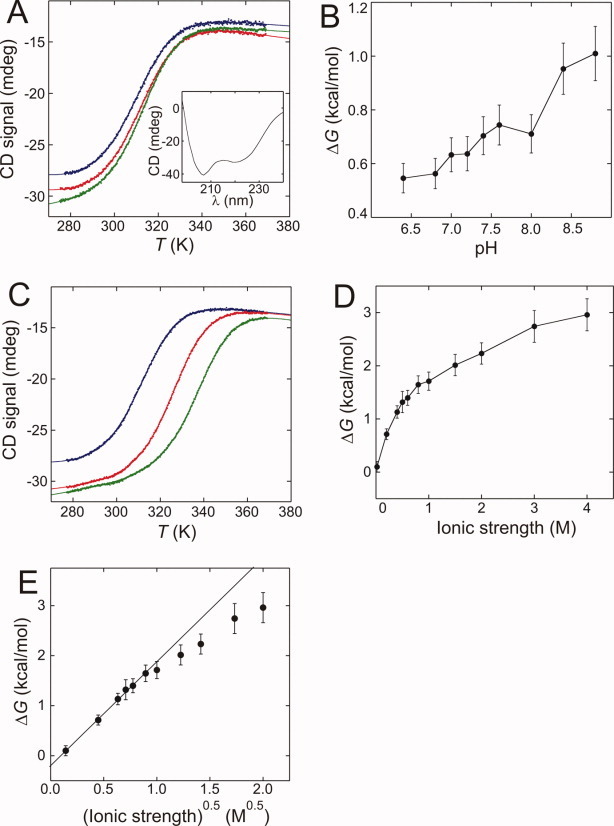
Thermal denaturation of HSBD at various solution conditions. (A) Ellipticity monitored at 222 nm as function of temperature and varying pH. Data recorded at 0.2 M ionic strength and pH 6.4 (blue), pH 7.4 (red), and pH 8.4 (green), and fitted to a model based on a thermodynamic two-state equilibrium (solid lines) are shown. The inset shows the CD spectrum recorded at pH 7.4 and 0.5 M ionic strength. (B) Stability of HSBD at 0.2 M ionic strength as function of solution pH. The black line is a guide to the eye. (C) Ellipticity monitored at 222 nm as function of temperature and varying ionic strength. Data were recorded at pH 7.4 and 0.2 M (blue), 1.0 M (red), and 2.0 M (green) ionic strength and fitted to a model based on a thermodynamic two-state equilibrium (solid lines). (D) HSBD stability at pH 7.4 and plotted as function of solution ionic strength. The black line is a guide to the eye. (E) Plot of HSBD stability versus the square root of solution ionic strength. Data up to 1 M ionic strength follow a linear behavior (solid line) as predicted by Debye-Hückel's law. Errors were estimated and propagated as described in Ref.21. [Color figure can be viewed in the online issue, which is available at wileyonlinelibrary.com.]
Design of a pseudo-wild-type protein for fluorescence experiments
HSBD contains no tyrosine or Trp side chains and, therefore, lacks intrinsic fluorescence emission. Previous work on BBL used the Trp mutant H142W to generate a structurally and energetically legitimate pseudo-wild-type protein of BBL where folding of the protein was accompanied by a considerable increase of fluorescence intensity.7,10 This increase in fluorescence is caused by partial burial of the indole moiety at position 142 on folding, shielding it from solvent exposure. The His residue at position 142 is conserved between HSBD and BBL, and the interaction networks of His142 are retained [Fig. 3(A)]. Each of the histidines is located at the C-terminal end of helix 1 and they form near-identical tertiary interactions with the C-terminal end of helix 2. By analogy, we used the mutant HSBD-H142W as a fluorescent pseudo-wild-type. It showed more than a 2-fold increase of fluorescence intensity on folding [Fig. 3(B)], similar to that observed for mutant H142W of BBL.10 Thermal denaturation data of HSBD-H142W, monitored using CD spectroscopy, were very similar to those recorded for wild-type protein [Figs. 2(C), 3(C,D)]. There was a considerable loss in native-state ellipticity of HSBD-H142W, as observed for wild-type protein on denaturation. Thermodynamic parameters derived from fits of wild-type and HSBD-H142W thermal denaturation data were essentially indistinguishable (Table I). Accordingly, HSBD-H142W is a suitable pseudo-wild-type protein for fluorescence studies.
Figure 3.
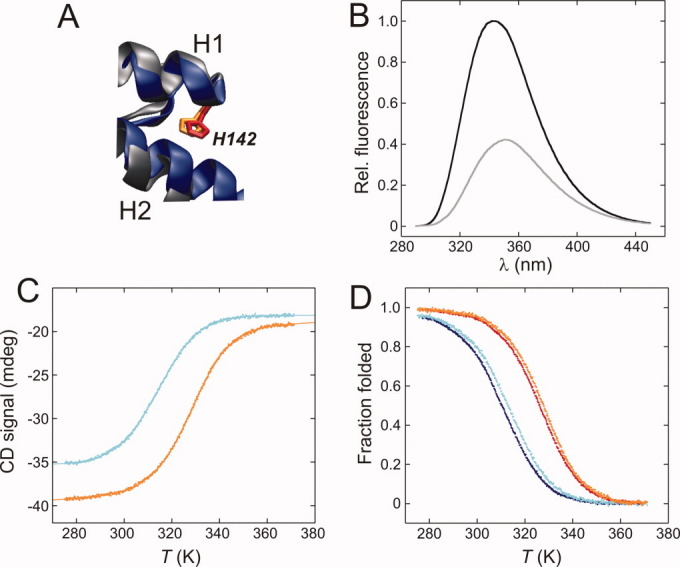
CD and fluorescence spectroscopic data of the HSBD pseudo-wild-type H142W. (A) Structural alignment of HSBD (pdb id 2F60, blue) with its homologue BBL (1W4H, gray). The conserved histidine side chains at position 142 are highlighted in red (HSBD) and orange (BBL). (B) Trp fluorescence spectrum of HSBD-H142W recorded at pH 7.4, 298 K, 0 M (black line) and 4 M (gray line) GdmCl. Data were recorded at identical protein concentrations and normalized to the fluorescence intensity at the wavelength maximum. (C) Thermal denaturation data recorded by CD spectroscopy at 0.2 M (cyan) and 1.0 M (orange) solution ionic strength. Ellipticity was monitored at 214 nm to avoid contributions from the introduced aromatic Trp side chain (Ref.10). (D) Comparison of the fraction of folded protein as function of temperature of wild type HSBD at 0.2 M (blue) and 1.0 M (red) ionic strength with data of mutant H142W at 0.2 M (cyan) and 1.0 M (orange) ionic strength. [Color figure can be viewed in the online issue, which is available at wileyonlinelibrary.com.]
Table I.
Thermodynamic Data Derived From Equilibrium Thermal Denaturation of HSBD
| Ionic strength (M) | Tm (K) | ΔHm (kcal/mol) | ΔG0 (kcal/mol) |
|---|---|---|---|
| 0.5 | 319.6 ± 0.9 | 24 ± 2 | 1.3 ± 0.1 |
| 0.5a | 320.3 ± 0.9 | 23 ± 2 | 1.3 ± 0.1 |
| 1.0 | 326.2 ± 0.1 | 25 ± 2 | 1.7 ± 0.1 |
| 1.0a | 327.7 ± 0.1 | 26 ± 2 | 1.8 ± 0.1 |
| 2.0 | 338.0 ± 0.1 | 26 ± 2 | 2.2 ± 0.2 |
| 2.0a | 336.4 ± 0.1 | 27 ± 2 | 2.2 ± 0.2 |
Parameters determined from mutant H142W.
Errors were estimated as described in ref.24.
Equilibrium chemical denaturation experiments
We studied the chemical denaturation of HSBD-H142W at equilibrium by steady-state Trp fluorescence and CD spectroscopy. The limited solubility of denaturant (guanidinium chloride, GdmCl) at high salt concentrations limited the number of data sets that could be recorded as function of ionic strength. At 0.5 M ionic strength and 298 K, the stability of HSBD was just high enough for quantitative analysis of denaturation data. At lower salt concentrations, the native-state baseline was not well defined. On the other hand, the solubility of GdmCl at ionic strengths larger than 1.0 M was too low for quantitative data analysis because of an inadequate denatured-state baseline. However, we were able to obtain reliable denaturation data at 0.5 and 1.0 M ionic strength for comparative study.
Both changes in Trp fluorescence intensity, which measured tertiary interactions, and CD ellipticity, which measured secondary structure, fitted well to a standard model for two-state chemical denaturation (Fig. 4), with thermodynamic parameters summarized in Table II. The fraction of folded HSBD, calculated from changes in Trp fluorescence and CD signal and plotted as function of denaturant concentrations, were essentially indistinguishable [Fig. 4(C)]. The equilibrium m-value (mD–N = 1.10 ± 0.02 kcal mol−1 M−1) a mid-point denaturant concentration ([D]50% = 1.70 ± 0.01 M), and a free energy of unfolding ( = 1.87 ± 0.02 kcal/mol) from Trp fluorescence at 1.0 M ionic strength and 298 K were in excellent agreement with those derived from CD spectroscopy (Table II), demonstrating that folding of HSBD is cooperative. The values of mD–N, [D]50%, and
  measured at 1.0 M ionic strength were significantly higher than those measured at 0.5 M ionic strength [Fig. 4(B), Table II].
Figure 4.
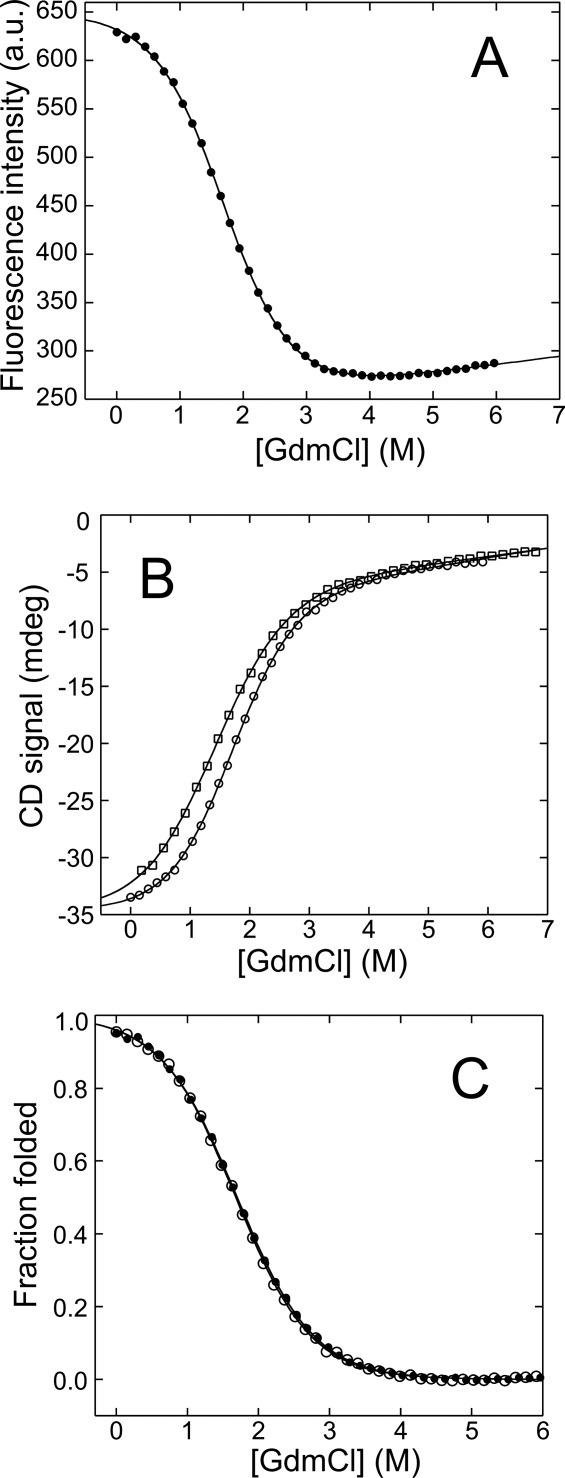
Equilibrium chemical denaturation of HSBD-H142W at 298 K. (A) Fluorescence emission intensity at 350 nm monitored as function of GdmCl concentration at 1.0 M ionic strength. (B) CD ellipticity at 222 nm monitored as function of GdmCl concentration at 1.0 M (circles) and 0.5 M (squares) ionic strength. (C) Fraction of folded protein derived from Trp fluorescence (closed circles) and CD (open circles) spectroscopy at 1.0 M ionic strength. Black lines are data fits to a thermodynamic two-state model.
Table II.
Thermodynamic and Kinetic Folding Data Derived From Chemical Denaturation of HSBD at 298 K
| Ionic strength (M) |
 (kcal mol−1 M−1) (kcal mol−1 M−1) |
[D]50% (M) |
 (kcal/mol) (kcal/mol) |
mTS-D (kcal mol−1 M−1) | mTS-N (kcal mol−1 M−1) |
 (kcal mol−1 M−1) (kcal mol−1 M−1) |
kf (s−1) | ku (s−1) |
 (kcal/mol) (kcal/mol) |
|---|---|---|---|---|---|---|---|---|---|
| 0.5 | 0.98 ± 0.02 | 1.38 ± 0.01 | 1.35 ± 0.03 | 0.56 ± 0.03 | 0.32 ± 0.02 | 0.88 ± 0.04 | 8800 ± 200 | 900 ± 100 | 1.4 ± 0.1 |
| 1.0 | 1.12 ± 0.02 | 1.68 ± 0.01 | 1.90 ± 0.03 | 0.59 ± 0.03 | 0.44 ± 0.04 | 1.03 ± 0.05 | 15,800 ± 200 | 430 ± 90 | 2.1 ± 0.1 |
Errors are propagated standard errors.
Folding kinetics of HSBD
We used nanosecond laser and microsecond capacitor-discharge T-jump Trp fluorescence spectroscopy10 to investigate folding kinetics of HSBD-H142W. All kinetic transients recorded at various solution conditions fitted well to a single exponential decay function (Fig. 5). Data recorded from HSBD-H142W in buffer without denaturant using laser T-jump spectroscopy showed no additional decays in sub-μs times and, therefore, no evidence for population of folding intermediates [Fig. 5(B)]. We measured the observed relaxation rate constant, kobs, as function of denaturant concentration, yielding chevron plots that fitted well to a barrier-limited two-state model [Fig. 6(A)] with kinetic parameters summarized in Table II. Although the kinetic m-value for folding, mTS–D, remained constant at 0.6 kcal mol−1 M−1, the m-value for unfolding, mTS–N, increased by about 30% from 0.32 ± 0.02 kcal mol−1 M−1 at 0.5 M ionic strength to 0.44 ± 0.04 kcal mol−1 M−1 at 1.0 M ionic strength. The folding rate constant increased from 8800 ± 200 s−1 to 15,800 ± 200 s−1, and the unfolding rate constant decreased from 900 ± 100 s−1 to 430 ± 90 s−1, at 0.5 M and 1.0 M ionic strength, respectively. There was good agreement in free energies of unfolding and m-values derived from equilibrium and kinetic experiments (Tables I and II).
Figure 5.
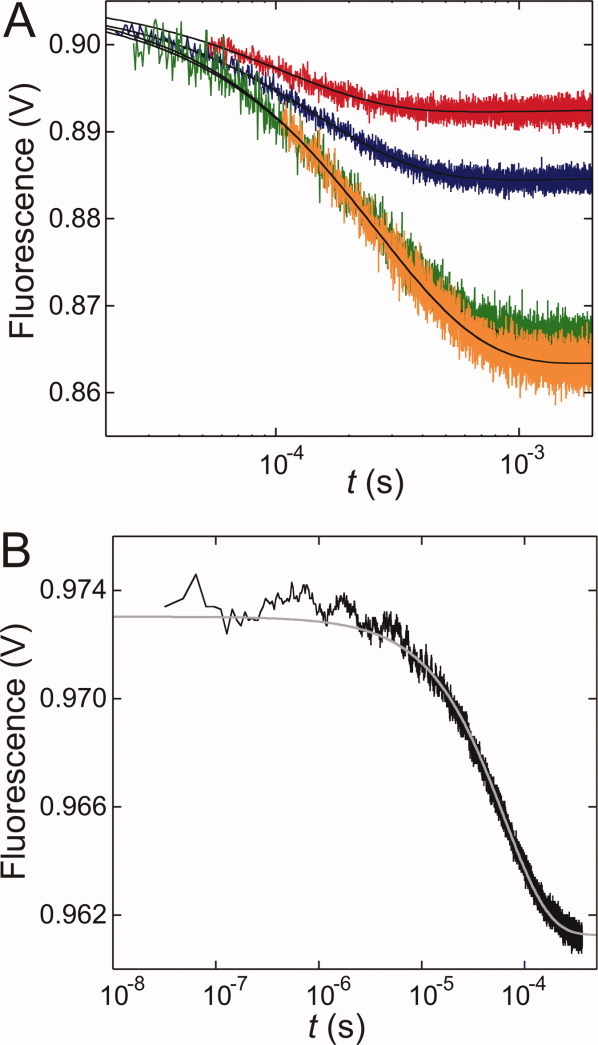
Folding kinetics of HSBD-H142W monitored by T-jump Trp fluorescence spectroscopy. (A) Representative transients recorded by capacitor-discharge T-jumps to 298 K at 0.5 M GdmCl, with 0.5 M (blue) and 1.0 M (red) solution ionic strength; and in 2.0 M GdmCl, with 0.5 M (green) and 1.0 M (orange) ionic strength. (B) Transient recorded by laser T-jump fluorescence spectroscopy to a final temperature of 308 K, in 50 mM phosphate, pH 7.4, and 0.5 M ionic strength. Gray and black lines are data fits to mono exponential decay functions. [Color figure can be viewed in the online issue, which is available at wileyonlinelibrary.com.]
Figure 6.
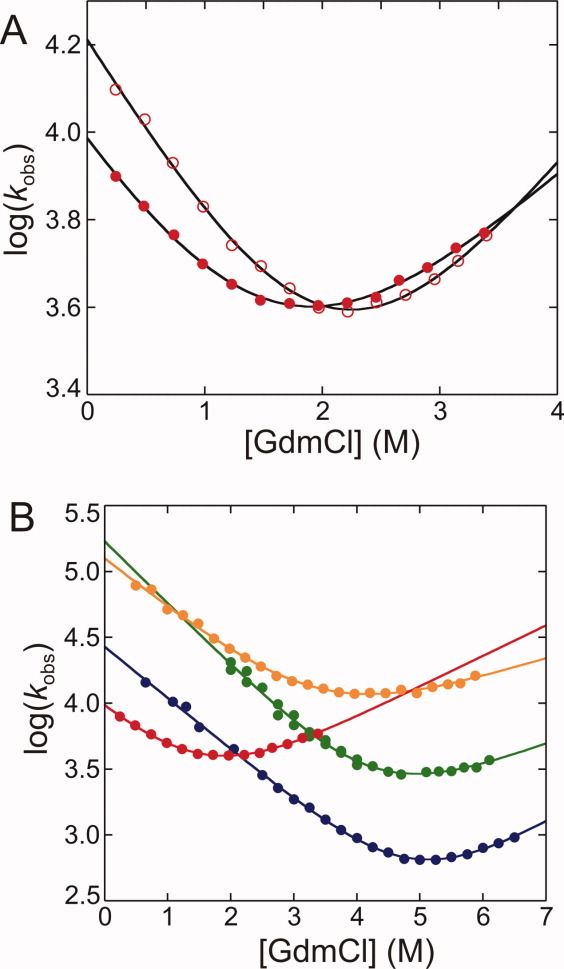
Chevron plots of HSBD-H142W and comparison with PSBD family members (T = 298 K). (A) Chevrons of HSBD recorded at pH 7.4 and 0.5 M (closed circles) and 1.0 M (open circles) ionic strength. (B) Chevron of HSBD at 0.5 M ionic strength (red) compared with data recorded from the bacterial homologues E3BD (blue, Ref.3), POB (green, Ref.3), and BBL (orange, Ref.10). Solid lines are data fits to a barrier-limited two-state folding model. [Color figure can be viewed in the online issue, which is available at wileyonlinelibrary.com.]
Discussion
Repulsive Coulomb forces impair protein stability
PSBDs bind to catalytic subunits within the PDH multienzyme assembly.1 The binding interface is dominated by electrostatic interactions involving a charge-zipper and side-chain hydrogen bonds.4 Accordingly, PSBDs have high numbers of exposed, charged side chains. Several positively charged side chains, directly involved in binding, are positioned around the conserved residue Arg136, which forms critical interactions.11
The large excess of positive over negative charges on the surface of HSBD explains its high solvent-ionic-strength dependent stability and folding kinetics. Excess positive charges give rise to repulsive Coulomb forces. In E3BD, for example, the positive charge of the conserved side chain Arg136 induces considerable electrostatic strain in the fold.12 In solutions containing electrolytes, Coulomb forces are screened by oppositely charged ions, according to the Debye and Hückel theory.9 Accordingly, the stability of HSBD increased with solvent ionic strength. Figure 7 compares surface-charge distributions and ionic-strength dependent stability changes ( ) of HSBD and its bacterial homologues. HSBD and E3BD have the highest positive charge densities, followed by POB and BBL.
  values between low (20 mM) and high (>1 M) ionic strength solution conditions follow this rank order: ΔΔ0GD–N is 1.4 kcal/mol for BBL between low and high ionic strength (H.N. and A.R.F, unpublished results);
  of HSBD and E3BD2 are >3 kcal/mol but only half the value for POB3. For BBL, positive and negative surface charges nearly compensate. BBL contains two histidine side chains that are protonated below neutral pH, increasing its positive charge density and decreasing stability markedly at such pH.13,14 Therefore, BBL can be expected to show higher ionic-strength dependent stability changes at acidic rather than neutral pH.
Figure 7.
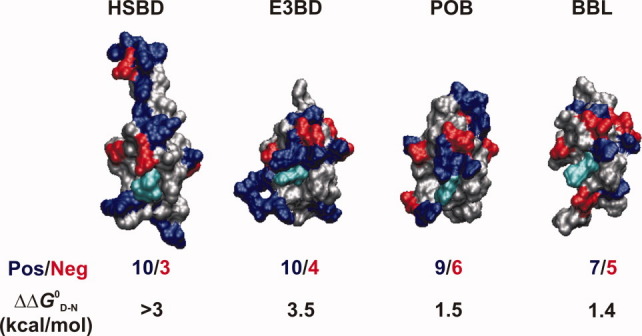
Comparison of surface-charge distributions of PSBDs and effects on folding. Protein surfaces of PSBD structures (represented from pdb entries given in Fig. 1) are shown in identical orientations. Positively charged (Arg and Lys) and negatively charged (Asp and Glu) side chains are highlighted in blue and red, respectively. The conserved Arg136 side chain, which is critical for binding, is highlighted in cyan. For each PSBD, the ratio of positive to negative surface charges in structured sequence (excluding the conserved buried side chain D162) and the free energy change between low and high ionic strength solvent conditions ( ) are tabulated. [Color figure can be viewed in the online issue, which is available at wileyonlinelibrary.com.]
There was a considerable difference in sensitivity of the stability of HSBD with ionic strength from that for E3BD and POB. The values of ΔΔ0GD–N of the latter two remain fairly constant at >0.6 M solvent ionic strengths,3 whereas ΔΔ0GD–N of HSBD approached its maximum at ∼4 M. The observation may result from differences in spatial distributions of charged side chains and local interactions. The Coulomb potential between point charges follows a 1/r distance dependence. In contrast to E3BD and POB, the charges of HSBD are more dispersed across a structure that is elongated by an extended C-terminal helix (Fig. 7). The observed increase of HSBD stability beyond Debye-Hückel screening at ionic strengths >1 M [Fig. 2(E)] might be explained by weak binding of salt in that high concentration range.
At physiological solvent pH and ionic strength, the stability of HSBD was considerably lower than its bacterial homologues ( < 1 kcal/mol at 298 K), and a significant fraction of protein was denatured. In a cellular environment, however, the stability of HSBD may be significantly higher because of molecular crowding. Also, PSBDs are part of large multienzyme complexes and their stability might be different within the context of such large macromolecular assemblies.
HSBD folds via a barrier-limited, apparent two-state transition
Fluorescence equilibrium and kinetic measurements revealed a barrier-limited, apparent two-state folding mechanism of HSBD. The change in fluorescence signal of HSBD-H142W was coincident with the change in far-UV CD signal [Fig. 4(C)] with the fluorescence of Trp142 reporting on the formation of tertiary interactions between helix 1 and helix 2 and the CD signal reporting on overall formation of secondary structure.
E3BD, POB, and BBL have barrier-limited folding.2,3,6–8,10,15–18 The folding kinetics of HSBD also showed all the characteristics of a barrier-limited two-state equilibrium. All transients fitted well to a single-exponential function, and there was no evidence for a fast relaxation in nanosecond laser T-jump experiments (Fig. 5). Denaturant-dependent relaxation kinetics fitted well to the classical chevron equation for barrier-limited two-state folding [Fig. 6(A)]. Although simple exponential kinetics can be generated from reactions without an energy barrier,19,20 it is very difficult to account for chevron plots without invoking a barrier and a transition state since a significant dependence of rate constants on denaturant concentration requires discrete changes in solvent-accessible surface area between ground and transition states.21 Extrapolated folding and unfolding rate constants yielded free energy values that were in good agreement with those derived from equilibrium denaturation monitored by CD (Table II). HSBD folded more slowly than its bacterial homologues, with a rate constant of 8800 ± 200 s−1 at 0.5 M ionic strength and 298 K. The bacterial homologues fold with rate constants >25,000 s−1.3 The lower rate constant may result in part from the electrostatic strain in folded HSBD, which should also destabilize the transition state for folding. There was a significant increase in equilibrium m-value on increase of solution ionic strength of ΔmD–N = 0.14 ± 0.03, indicating an increase in change of accessible surface area (ΔASA) between native and denatured state. This change in m-value was fully accounted for by a corresponding change of the kinetic m-value for unfolding, mTS–N, of ΔmTS–N = 0.12 ± 0.05. On the other hand, the kinetic m-value of folding, mTS–D, remained constant (Table II). A match of ΔmD–N and ΔmTS–N in two-state folding indicates plasticity of the native state: HSBD appears to become more compact with increasing solution ionic strength as repulsive surface charge interactions are screened out.
In conclusion, HSBD folds in microseconds via barrier-limited transition, as do bacterial PSBDs. The high density of positive surface charges in HSBD, which are crucial for function, imposes a considerable energetic penalty for folding and even seems to induce native-state movement. HSBD emerges as an example for the presence of a trade-off between protein function and stability during protein evolution.22
Materials and Methods
Protein expression and purification
A codon-optimized synthetic gene (Geneart) encoding residues 121–179 of HSBD (Fig. 1) was cloned into a modified pRSETA vector. HSBD was expressed with the Gro-EL apical domain as an N-terminal fusion protein that could be removed by thrombin cleavage. The mutant H142W was generated using a Stratagene Quikchange mutagenesis kit. HSBD was over expressed in Escherichia coli C41 (DE3). Fusion protein was isolated from clarified cell lysate by affinity chromatography using Ni-Sepharose 6 Fast-Flow resin (GE Healthcare). HSBD was cleaved from the fusion protein by addition of 100 Units of bovine plasma thrombin (Sigma-Aldrich) for 12 h at room temperature and purified to homogeneity using ion-exchange chromatography (Poros S-column, 50 mM Tris-HCL pH 8.0, linear gradient from 0-1 M NaCl) followed by size-exclusion chromatography (Superdex 30 column, GE Healthcare, 200 mM ammonium bicarbonate). Pooled fractions from gel filtration were lyophilised. The identity of protein was confirmed by matrix-assisted laser desorption mass spectrometry.
Far-UV circular dichroism
Thermal and chemical equilibrium denaturation was performed using a Jasco J815 spectropolarimeter. A 1-mm path-length cell and protein concentrations of 50 μM were used. Standard solvent conditions for thermal denaturation were 50 mM phosphate buffer, pH 7.4, with varying ionic strengths adjusted using potassium chloride. Temperature was ramped from 275 to 371 K with a slope of 1 K/min using a Peltier temperature controller. The CD signal was read out every 0.2 K temperature increment. Reversibility of thermal unfolding was tested by reversing the temperature ramp from 371 to 275 K with the same slope. The reverse thermal unfolding experiment yielded essentially identical thermal denaturation profiles, demonstrating reversibility of unfolding. Solvent conditions for chemical denaturation was 50-mM 3-morpholino-propanesulfonic acid, pH 7.4, with the ionic strength adjusted to 0.5 M and 1.0 M using sodium chloride. Chemical denaturation experiments were performed by manual titration between zero and 8 M GdmCl (0.2 M GdmCl increments) at 298 K. GdmCl concentrations for stock solutions were assayed by refractometry. All sample solutions were filtered using 0.2-μm syringe filters before measurement.
Steady-state fluorescence spectroscopy
Steady-state fluorescence emission spectra were acquired using a PTI QuantaMaster spectrofluorometer. Temperature of the sample was controlled using a Peltier thermocouple set to 298 K throughout measurements. Samples were measured at 20-μM protein concentration in a 10-mm path-length fluorescence cuvette. Chemical denaturation experiments were performed by manual titration between zero and 8 M GdmCl (0.2 M increments) and fluorescence emission was collected at 350 nm.
Temperature-jump fluorescence experiments
Relaxation kinetics on the microsecond timescale was measured using a capacitor-discharge T-jump spectroscopy monitoring Trp fluorescence emission. T-jumps of 3 K were induced by resistive heating using a modified Hi-Tech PTJ-64 capacitor-discharge apparatus, with a 30 nF capacitor and a 5-mm × 5-mm cell resulting in an instrumental heating time of ∼20 μs. Sample concentrations were typically 50-μM protein. Trp fluorescence was excited at 280 nm using an optical high-transmittance band-pass filter, and fluorescence emission at >330 nm was collected using an optical cutoff filter. Between 20 and 40 shots were averaged for each denaturant concentration to give acceptable signal to noise for transients of varying amplitude. Nanosecond relaxation kinetics was measured using a laser T-jump fluorescence setup.23 Heating was achieved using the 1574 nm output from a BigSky CFR400 NdYAG laser with a pulse width of 10 ns at FWHM. Temperature jumps of 3–4 K were initiated at 1 Hz frequency. Heating was complete within ∼20 ns as judged by measurements using N-acetyl tryptophanamide as control sample. Fluorescence excitation used the CW 284 nm output from a LEXEL SHG 95, a frequency doubled krypton gas laser source. Sample concentrations were typically 100-μM protein. T-jump samples were degassed before kinetic experiments.
Data analysis
Equilibrium protein denaturation data were fitted using equations based on the classical thermodynamic model for a two-state equilibrium between native and denatured conformational states. The spectroscopic signal s can be expressed as function of the perturbation P:
| (1) |
where αN, βN, αD, and βD are the signals of native and denatured states, respectively, that change linearly with perturbation P, R is the gas constant and T is the temperature.
In thermal denaturation experiments, the folding equilibrium is perturbed by heat (P = T) and the free energy of unfolding can be expressed as:
 |
(2) |
where ΔHm is the enthalpy of unfolding at the transition mid-point, Tm is the mid-point temperature, and ΔCp is the difference in heat capacity between native and denatured states. From our previous experimental studies on the PSBD family, we estimated ΔCp for HSBD to be 350 cal mol−1 K−1. Experimental errors for ΔHm and ΔCp were estimated as described24 and propagated to calculate errors for  .
.
In chemical denaturation experiments, the folding equilibrium was perturbed by denaturant GdmCl (P = [D]). The free energy of protein unfolding changes linearly with denaturant concentration:
| (3) |
where [D] is the concentration of GdmCl and mD–N is the equilibrium m-value. Reported errors for  and mD–N were propagated standard errors from data fits.
All transients in relaxation experiments were fitted to a single-exponential function. In the classical kinetic model for a two-state equilibrium between native and denatured conformational states, the observed relaxation rate constant kobs is the sum of the microscopic rate constants for folding and unfolding (kf and ku, respectively).
| (4) |
Chevron analysis follows the linear free-energy relationship for chemical denaturation, and kobs([D]) can be expressed as25:
 |
(5) |
where mTS–D and mTS–N are the kinetic folding and unfolding m-values, and kf and ku are the microscopic folding and unfolding rate constants under standard solvent conditions. All chevron data presented were fitted to Eq. (5). Reported errors are propagated standard errors from data fits.
Acknowledgments
This work was partly supported by European Molecular Biology Grant ALTF-650-2006 to E. Arbely.
Glossary
Abbreviations:
- CD
circular dichroism
- GdmCl
guanidinium chloride
- HSBD
human peripheral subunit-binding domain
- NMR
nuclear magnetic resonance spectroscopy
- PDH
pyruvate dehydrogenase
- PSBD
peripheral subunit-binding domain
- T-jump
temperature jump
- Trp
tryptophan
References
- 1.Perham RN. Swinging arms and swinging domains in multifunctional enzymes: catalytic machines for multistep reactions. Annu Rev Biochem. 2000;69:961–1004. doi: 10.1146/annurev.biochem.69.1.961. [DOI] [PubMed] [Google Scholar]
- 2.Ferguson N, Sharpe TD, Johnson CM, Fersht AR. The transition state for folding of a peripheral subunit-binding domain contains robust and ionic-strength dependent characteristics. J Mol Biol. 2006;356:1237–1247. doi: 10.1016/j.jmb.2005.12.016. [DOI] [PubMed] [Google Scholar]
- 3.Ferguson N, Sharpe TD, Schartau PJ, Sato S, Allen MD, Johnson CM, Rutherford TJ, Fersht AR. Ultra-fast barrier-limited folding in the peripheral subunit-binding domain family. J Mol Biol. 2005;353:427–446. doi: 10.1016/j.jmb.2005.08.031. [DOI] [PubMed] [Google Scholar]
- 4.Frank RA, Pratap JV, Pei XY, Perham RN, Luisi BF. The molecular origins of specificity in the assembly of a multienzyme complex. Structure. 2005;13:1119–1130. doi: 10.1016/j.str.2005.04.021. [DOI] [PubMed] [Google Scholar]
- 5.Brautigam CA, Wynn RM, Chuang JL, Machius M, Tomchick DR, Chuang DT. Structural insight into interactions between dihydrolipoamide dehydrogenase (E3) and E3 binding protein of human pyruvate dehydrogenase complex. Structure. 2006;14:611–621. doi: 10.1016/j.str.2006.01.001. [DOI] [PMC free article] [PubMed] [Google Scholar]
- 6.Ferguson N, Day R, Johnson CM, Allen MD, Daggett V, Fersht AR. Simulation and experiment at high temperatures: ultrafast folding of a thermophilic protein by nucleation-condensation. J Mol Biol. 2005;347:855–870. doi: 10.1016/j.jmb.2004.12.061. [DOI] [PubMed] [Google Scholar]
- 7.Neuweiler H, Sharpe TD, Rutherford TJ, Johnson CM, Allen MD, Ferguson N, Fersht AR. The folding mechanism of BBL: plasticity of transition-state structure observed within an ultrafast folding protein family. J Mol Biol. 2009;390:1060–1073. doi: 10.1016/j.jmb.2009.05.011. [DOI] [PubMed] [Google Scholar]
- 8.Sharpe TD, Ferguson N, Johnson CM, Fersht AR. Conservation of transition state structure in fast folding peripheral subunit-binding domains. J Mol Biol. 2008;383:224–237. doi: 10.1016/j.jmb.2008.06.081. [DOI] [PubMed] [Google Scholar]
- 9.Debye P, Hückel E. The theory of electrolytes. I. Lowering of freezing point and related phenomena. Physikalische Zeitschrift. 1923;24:185–206. [Google Scholar]
- 10.Neuweiler H, Sharpe TD, Johnson CM, Teufel DP, Ferguson N, Fersht AR. Downhill versus barrier-limited folding of BBL 2: mechanistic insights from kinetics of folding monitored by independent Trp probes. J Mol Biol. 2009;387:975–985. doi: 10.1016/j.jmb.2008.12.056. [DOI] [PubMed] [Google Scholar]
- 11.Jung HI, Cooper A, Perham RN. Interactions of the peripheral subunit-binding domain of the dihydrolipoyl acetyltransferase component in the assembly of the pyruvate dehydrogenase multienzyme complex of Bacillus stearothermophilus. Eur J Biochem. 2003;270:4488–4496. doi: 10.1046/j.1432-1033.2003.03842.x. [DOI] [PubMed] [Google Scholar]
- 12.Spector S, Wang M, Carp SA, Robblee J, Hendsch ZS, Fairman R, Tidor B, Raleigh DP. Rational modification of protein stability by the mutation of charged surface residues. Biochemistry. 2000;39:872–879. doi: 10.1021/bi992091m. [DOI] [PubMed] [Google Scholar]
- 13.Arbely E, Rutherford TJ, Sharpe TD, Ferguson N, Fersht AR. Downhill versus barrier-limited folding of BBL 1: energetic and structural perturbation effects upon protonation of a histidine of unusually low pKa. J Mol Biol. 2009;387:986–992. doi: 10.1016/j.jmb.2008.12.055. [DOI] [PubMed] [Google Scholar]
- 14.Settanni G, Fersht AR. Downhill versus barrier-limited folding of BBL 3: Heterogeneity of the native state of the BBL peripheral subunit binding domain and its implications for folding mechanisms. J Mol Biol. 2009;387:993–1001. doi: 10.1016/j.jmb.2009.02.014. [DOI] [PubMed] [Google Scholar]
- 15.Spector S, Kuhlman B, Fairman R, Wong E, Boice JA, Raleigh DP. Cooperative folding of a protein mini domathe peripheral subunit-binding domain of the pyruvate dehydrogenase multienzyme complex. J Mol Biol. 1998;276:479–489. doi: 10.1006/jmbi.1997.1522. [DOI] [PubMed] [Google Scholar]
- 16.Ferguson N, Schartau PJ, Sharpe TD, Sato S, Fersht AR. One-state downhill versus conventional protein folding. J Mol Biol. 2004;344:295–301. doi: 10.1016/j.jmb.2004.09.069. [DOI] [PubMed] [Google Scholar]
- 17.Huang F, Ying L, Fersht AR. Direct observation of barrier-limited folding of BBL by single-molecule fluorescence resonance energy transfer. Proc Natl Acad Sci USA. 2009;106:16239–16244. doi: 10.1073/pnas.0909126106. [DOI] [PMC free article] [PubMed] [Google Scholar]
- 18.Neuweiler H, Johnson CM, Fersht AR. Direct observation of ultrafast folding and denatured state dynamics in single protein molecules. Proc Natl Acad Sci USA. 2009;106:18569–18574. doi: 10.1073/pnas.0910860106. [DOI] [PMC free article] [PubMed] [Google Scholar]
- 19.Hagen SJ. Probe-dependent and nonexponential relaxation kinetics: unreliable signatures of downhill protein folding. Proteins. 2007;68:205–217. doi: 10.1002/prot.21342. [DOI] [PubMed] [Google Scholar]
- 20.Parker MJ, Marqusee S. The cooperativity of burst phase reactions explored. J Mol Biol. 1999;293:1195–1210. doi: 10.1006/jmbi.1999.3204. [DOI] [PubMed] [Google Scholar]
- 21.Huang F, Sato S, Sharpe TD, Ying L, Fersht AR. Distinguishing between cooperative and unimodal downhill protein folding. Proc Natl Acad Sci USA. 2007;104:123–127. doi: 10.1073/pnas.0609717104. [DOI] [PMC free article] [PubMed] [Google Scholar]
- 22.Meiering EM, Serrano L, Fersht AR. Effect of active site residues in barnase on activity and stability. J Mol Biol. 1992;225:585–589. doi: 10.1016/0022-2836(92)90387-y. [DOI] [PubMed] [Google Scholar]
- 23.Religa TL, Johnson CM, Vu DM, Brewer SH, Dyer RB, Fersht AR. The helix-turn-helix motif as an ultrafast independently folding domathe pathway of folding of Engrailed homeodomain. Proc Natl Acad Sci USA. 2007;104:9272–9277. doi: 10.1073/pnas.0703434104. [DOI] [PMC free article] [PubMed] [Google Scholar]
- 24.Johnson CM, Fersht AR. Protein stability as a function of denaturant concentration: the thermal stability of barnase in the presence of urea. Biochemistry. 1995;34:6795–6804. doi: 10.1021/bi00020a026. [DOI] [PubMed] [Google Scholar]
- 25.Jackson SE, Fersht AR. Folding of chymotrypsin inhibitor 2. 1. Evidence for a two-state transition. Biochemistry. 1991;30:10428–10435. doi: 10.1021/bi00107a010. [DOI] [PubMed] [Google Scholar]


