Abstract
Degradation of the cartilage proteoglycan aggrecan is one of the earliest events that occurs in association with osteoarthritis. Little is known concerning the fate of the residual N-terminal G1 domains of cleaved aggrecan; domains that remain bound to hyaluronan. In this study, 68–72-kDa bands representative of aggrecan G1 domains containing ITEGE373 neoepitope were detected within a hyaluronidase-sensitive pool at the cell surface of bovine articular chondrocytes and within a hyaluronidase-insensitive, intracellular pool. To determine the mechanisms that contribute to this distribution, CD44 expression was knocked down by siRNA or function by CD44-DN. Both approaches prevented the retention and internalization of G1-ITEGE. Inhibition of CD44 transit into lipid rafts blocked the endocytosis of G1-ITEGE but not the retention at the cell surface. Chondrocytes derived from CD44 null mice also exhibited limited potential for retention and internalization of G1-VTEGE. The consequence of a lack of chondrocyte-mediated endocytosis of these domains in cartilage of the CD44 null mice was the accumulation of the degradation fragments within the tissue. Additionally, chondrocytes or fibroblasts derived from CD44 null mice exhibited little capacity for retention and internalization of exogenous G1-ITEGE derived from bovine cartilage explants. Bovine or wild type mouse fibroblasts were able to bind and internalize bovine-derived G1-ITEGE. Although several pathways are available for the clearance of these domains, CD44-mediated cellular internalization is the most prominent.
Keywords: ADAM ADAMTS, Connective Tissue, Endocytosis, Extracellular Matrix, Hyaluronate, Aggrecan, CD44
Introduction
In cartilage the maintenance of a highly hydrated extracellular matrix is essential for the biomechanical function of the tissue. The primary extracellular macromolecule responsible for this hydration is the proteoglycan aggrecan. Aggrecan is organized as a multiunit aggregate composed of aggrecan monomers bound to a core filament of hyaluronan (HA)2 and stabilized by association of link proteins (1, 2). The HA/aggrecan/link protein complex is retained at the chondrocyte cell surface either via HA that maintains connections with an HA synthase or HA bound to CD44 (3, 4). All three of these matrix components constantly undergo turnover in healthy cartilage. When studied by precursor radiolabeling, it was found that the biosynthetic rates for HA and aggrecan were remarkably similar (5, 6). Given that the total overall content of HA and aggrecan remains constant led to the conclusion that the two macromolecules must be turned over at the same rate. Subsequent pulse-chase studies confirmed this suggestion (5, 6). Moreover, even when culture conditions were altered such that tissue depletion was enhanced, the elevated rates of turnover for aggrecan and HA remained coordinated (6). The observations imply that the various extracellular processing pathways responsible for the turnover of aggrecan and HA must interact to achieve this level of coordination.
One of the early events associated with osteoarthritis is the pronounced loss of aggrecan from the cartilage (1). Aggrecan turnover occurs within the extracellular environment because of the activity of endoproteinases termed aggrecanases and, to a lesser extent, matrix metalloproteinases (MMPs) (7–9). The aggrecanases, including ADAMTS4 (10, 11) and ADAMTS5 (12), are thought to be the key mediators of aggrecan loss, and ADAMTS5 is known to be the major aggrecanase in the mouse (13, 14). MMP cleavage of aggrecan occurs with late-stage cartilage damage in mouse models of arthritis (7, 15–17) and may also be involved in the normal turnover of aggrecan in vitro The proteolysis of aggrecan by either aggrecanase or MMP results in an initial cleavage of the aggrecan monomer within interglobular domain. The C-terminal, chondroitin sulfate-rich portion of aggrecan is lost from the cartilage by diffusion and recovered in the medium or synovial fluid (7, 9, 18, 19).
The fate of the N-terminal G1 domain of aggrecan as well as the link protein, both presumably still bound to HA, is less clear. ADAMTS5 and ADAMTS4 generate G1 domains with Glu373 at the C terminus. MMP cleavage of aggrecan generates slightly smaller G1 domains terminating with Asn341. The respective terminating ITEGE373 and DIPEN341 sequences of these G1 domains have been used for the production of neoepitope antibodies (20, 21) and provide a signature for aggrecanase or MMP activity. Using these antibodies, both G1-ITEGE and G1-DIPEN can be observed in medium of cartilage explants (22) as well as human synovial fluid (7) but are also observed to accumulate within the cartilage extracellular matrix (7, 9, 13, 19, 23). For example, HA, G1 domains, and link proteins are released into the medium of bovine cartilage explants treated with interleukin-1β (IL-1β) (24) or explants treated with a combination of IL-1α and oncostatin M (25). The HA released was still a polysaccharide but reduced in molecular size (25). However, in earlier studies by Ng et al. (6), although turnover of newly synthesized HA that resulted from release into the medium was observed, this fraction represented only 9% of the total HA that was lost from the tissue. These investigators also noted a reduction in size of the HA but at a rate of reduction more consistent with the kinetics of a free radical depolymerization of HA (6). The fate of the remaining 91% radiolabeled HA lost from the tissue remained unknown. Given that HA is clearly lost from the tissue but cannot be fully accounted for by release into the medium led to the early suggestion that HA turnover in cartilage must also involve another mechanism such as endocytosis by the resident chondrocytes (5, 6). We have demonstrated that most cells expressing the HA receptor CD44, including chondrocytes, exhibit the capacity for CD44-mediated internalization of HA (26–32). Using an immunohisto/cytochemistry approach, it was observed that chondrocytes exhibit a capacity to internalize G1-ITEGE (19, 33), thus, providing another turnover fate for these domains.
In the present study we demonstrate that aggrecan G1-ITEGE is retained by chondrocytes in culture and that a fraction of the retained G1-ITEGE is internalized via a mechanism that requires CD44. Moreover, we show that internalization of G1-ITEGE can be blocked by interfering with CD44 transit into lipid rafts and that the intracellular G1-ITEGE was derived by internalization of extracellular G1-ITEGE.
EXPERIMENTAL PROCEDURES
Materials
Dulbecco's modified Eagle's medium (DMEM) and Ham's F-12 were obtained from Mediatech (Herndon, VA). Fetal bovine serum (FBS) was purchased from Hyclone (South Logan, UT). Specific primers for real time RT-PCR were custom made by Integrated DNA Technologies (Coralville, IA). CD44 and control siRNAs were obtained from Thermo Scientific Dharmacon RNAi Technologies (Chicago, IL). Pronase and collagenase P used in dissociation of tissues were obtained from EMD Scientific (San Diego, CA) and Roche Applied Science (Indianapolis, IN), respectively. Clear Blue x-ray film was from Genesee Scientific (San Diego, CA). The nuclear stain, 4′, 6-diamidino-2-phenylindole, dihydrochloride (DAPI), anti-mouse CD44 antibody, and rhodamine phalloidin were from Invitrogen. qScriptTM cDNA synthesis kit was obtained from Quanta Biosciences (VWR), and RT2 Real TimeTM SYBR Green reagents were from SA Biosciences (Frederick, MD). IL-1β was from R&D Systems, Inc. (Minneapolis, MN). Cell lysis buffer was from Cell Signaling Technologies (Danvers, MA). All other enzymes and chemicals were either molecular biology or reagent grade materials, and the anti-β-actin monoclonal antibodies were purchased from Sigma.
Cell Culture
Primary bovine articular chondrocytes were isolated from the metacarpophalangeal joints of 18–24-month-old adult steers. Chondrocytes were liberated from full-thickness slices of articular cartilage by sequential Pronase/collagenase digestion (34). The primary bovine chondrocytes were cultured in a 1:1 mixture of DMEM/Ham's F-12 medium containing 10% FBS and 50 units/ml penicillin, l-glutamate, and ascorbic acid. The chondrocytes were plated as high density monolayers (2.0 × 10⁶ cells/cm2) for immediate analysis of primary cells or low density monolayers (5000 cells/cm2) to allow the cells to undergo de-differentiation. When low density chondrocytes reached confluence, the cells were passaged by treatment with 0.25% trypsin, 2.21 mm EDTA. To prepare bovine synovial fibroblasts, 2 × 2 × 1-mm sections of synovial membrane immediate adjacent to cartilage condyles were placed in explant culture. After 1 week, fibroblasts that had grown out from the explants were trypsinized and passaged. Synovial fibroblasts between the third and fifth passage were used.
Primary mouse chondrocytes were isolated from the femoral hip joints of 1-week-old CD44−/− mice (35) or BALB/c wild type control mice (BALB/cAnNCrl, Charles River, Wilmington, MA). Briefly, the animals were euthanized, and the hind limbs were dissected from the acetabulum and freed of surrounding muscle, tendons and connective tissue. Isolated femoral heads were subjected to 3 mg/ml collagenase D with stirring at 37 °C, 5% CO2. Primary murine chondrocytes were collected every hour for the first 5 h and then plated into 35-mm dishes containing DMEM medium, 10% FBS, 50 units/ml penicillin, and 2 mm/ml l-glutamine. When the mouse chondrocytes reached confluence, the cells were passaged one time with 0.25% trypsin, 2.21 mm EDTA into 6-well plates for experiments. To prepare mouse fibroblasts, 2 × 2 × 1-mm sections of loose connective tissue immediately adjacent to knee joints of 1-week-old mice were placed in explant culture. After 1 week, fibroblasts that had grown out from the explants were trypsinized and passaged. Fibroblasts between the third and fifth passage were used.
In other experiments intact femoral heads of 1-week-old mice were grown as explant cultures in DMEM medium containing 10% FBS. After 1 day of culture for recovery, the heads were washed, and medium was replaced with fresh medium containing 10 ng/ml IL-1β. After 7 days of incubation the heads were removed, fixed with 4% buffered paraformaldehyde overnight at 4 °C, decalcified in 5% EDTA for 24 h, rinsed in 30% sucrose, PBS, and embedded in OCT-freezing medium. Cryostat sections (8.0 μm) were prepared and blocked in PBS, 10% goat serum, 0.2% Triton before immunostaining.
Preparation of Exogenous G1-ITEGE from Bovine Cartilage Slices
Full-thickness slices (∼1 × 10 × 10 mm) of bovine articular cartilage were cultured directly in 1.0 ml of DMEM/F-12 medium containing 10% FBS for the purpose of harvesting conditioned medium containing G1-ITEGE fragments. After 2 days of culture for recovery, the tissue slices were washed, and medium was replaced with fresh serum-free DMEM/F-12 without or stimulated with 10 ng/ml IL-1β. After 3 days the slices were rinsed in fresh medium and then incubated for another 5 days in serum-free DMEM/F-12 medium without IL-1β. Aliquots of the IL-1 wash-out-conditioned media (G1-ITEGE medium) were then added to cell cultures as a source of exogenous G1-ITEGE. Control medium was obtained from slices pre-cultured without IL-1.
Treatment of Cells
Confluent cultures of chondrocytes were treated for varying time periods with 10 ng/ml IL-1β in fresh culture medium with reduced serum (5% FBS). For experiments designed to test the role of lipid rafts or receptor palmitoylation in endocytosis, chondrocytes were pretreated for 30 min with 10 mm methyl-β-cyclodextrin (MβCD) or for 24 h with 10 μm 2-bromopalmitate (2-BP) as described previously (32). In most experiments, with the exception of MβCD, the pretreatment inhibitors were present throughout the incubation period. For siRNA inhibition of chondrocyte CD44 or dominant negative inhibition of CD44 function, bovine articular chondrocytes were released from monolayer culture using a 1.5-h incubation with 0.1% collagenase P and 0.1% Pronase. The released cells (2.0 × 10⁶ cells) were next mixed with AmaxaTM human chondrocyte solution (Lonza Walkersville Inc., Walkersville, MD) and 5 μg of siRNA or 4 μg of an empty control pcDM8 plasmid or CD44-DN/pcDM8 (30). The chondrocytes were then transfected by nucleofection using an Amaxa Nucleofector® device at setting U-28. The CD44 siRNA was constructed as the bovine orthologue of a human CD44 siRNA sequence originally described by Ghatak et al. (36). The control siRNA (D-001206-09-05, Dharmacon) was also as described (36). For analysis of G1 domains released into the medium, chondrocytes were treated without or with 10 ng/ml IL-1β in serum-free medium for varying times. The medium samples were concentrated 10-fold using Ultracel 10k centrifugal filter units (Millipore), and equal volumes were analyzed by Western blot detection.
Detection of Cell Surface and Intracellular Aggrecan G1-ITEGE
For immunofluorescence studies, chondrocytes were cultured on Lab-TekTM II chamber slides. For the analysis of G1-ITEGE, two pools were isolated from bovine articular chondrocytes, grown as high density cultures under a variety of conditions. The culture medium was removed, and the cells were incubated for 30 min with 0.25% trypsin, 2.21 mm EDTA or for 60 min with 200 turbidity reducing units/ml testicular hyaluronidase containing proteinase inhibitor mixture at 37 °C in serum-free DMEM/F-12. This extracellular enzyme-susceptible pool was referred to as the “matrix” fraction. The remaining cells were solubilized in cell lysis buffer and referred to as the “intracellular” fraction. Aliquots of each fraction were analyzed by Western blot analysis. Alternatively, cells before and after hyaluronidase treatment were fixed, permeabilized, and then analyzed by immunofluorescence (21, 33). Briefly, after washing in PBS the chondrocytes were incubated with rabbit anti-ITEGE373 (0.5 μg/ml) antibodies overnight at 4 °C as described (19, 21). Cells were then washed and incubated with FITC-conjugated goat anti-rabbit IgG antibody (1:50, Jackson ImmunoResearch) followed by the addition of the nuclear stain, DAPI. To visualize stress fibers associated with synovial fibroblasts, these cells were incubated with rhodamine phalloidin for 20 min at room temperature. Chondrocytes or fibroblasts were visualized using a Nikon Eclipse E600 microscope equipped with Y-Fl Epi-fluorescence (Melville, NY), a 60× 1.4 NA oil-immersion objective and, rhodamine isothiocyanate (red), FITC (green), and DAPI (blue) filters. Images were captured digitally in real time using a Spot-RT camera (Diagnostic Instruments, Sterling Heights, MI) and processed using NIS Elements BR imaging software (Nikon, Lewisville, TX).
Western Blot for Detection of G1-ITEGE
Total protein was extracted using cell lysis buffer containing protease inhibitor mixture. Twenty micrograms of total protein per sample was loaded and separated on Novex 4–12% gradient SDS-PAGE gels (Invitrogen). After electroblot transfer onto nitrocellulose membranes and blocking in 5% nonfat dry milk, membranes were incubated with primary antibodies followed by HRP-conjugated secondary antibodies. Detection was performed using chemiluminescence (Novex ECL, Invitrogen). In some cases the blots were stripped using stripping buffer (0.76 g of Tris base, 2 g of SDS, and 700 μl of β-mercaptoethanol volume to 100 ml with water, pH 6.8) for 30 min at room temperature and re-probed using another primary antibody. Specific antibodies used for analysis were rabbit affinity-purified anti-CD44 cytoplasmic tail antisera (1:10,000) (37, 38), rabbit anti-ITEGE373 (0.5 μg/ml), and rabbit anti-G1 (1:1000) (19, 21) as well as mouse anti-CD44 IM7.8.1 (1:1000) (3) and β-actin.
RESULTS
Aggrecan G1-ITEGE Is Internalized by Articular Chondrocytes
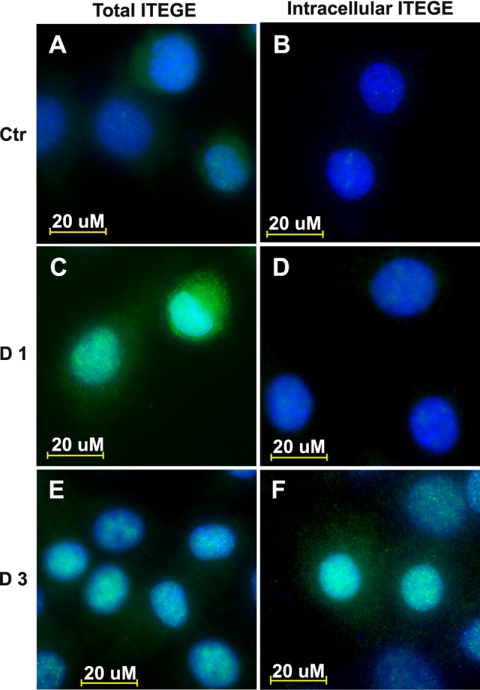
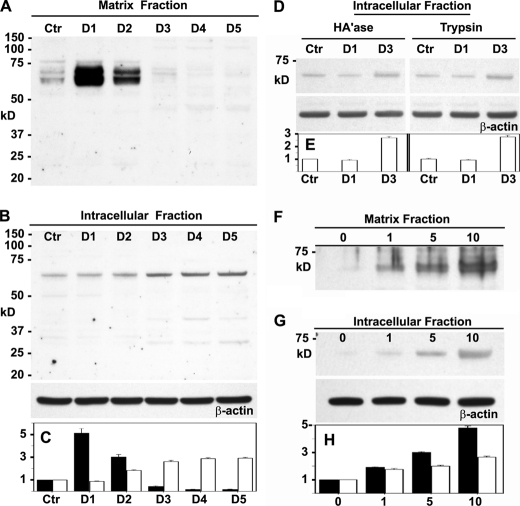
Chondrocytes at all times of culture exhibited a background level of ITEGE neoepitope primarily localized at the cell surface (Fig. 1A). After 24 h of treatment with IL-1β, the levels of G1-ITEGE were substantially enhanced (Fig. 1C), even more so than at 3 days (Fig. 1E). To visualize whether the G1-ITEGE was internalized, the chondrocytes were treated either with trypsin (data not shown) or hyaluronidase to enzymatically release the cell-associated matrix pool of neoepitope. G1-ITEGE that remains with the cells after hyaluronidase and is presumably intracellular was visualized in IL-1β-treated chondrocytes (Fig. 1D) but was more evident at the 3-day time point (Fig. 1F). Cell surface-bound and intracellular G1-ITEGE was also detected on Western blots. As shown in Fig. 2A, a heterogeneous doublet band between 68 and 72 kDa was evident in the hyaluronidase-released fraction of bovine chondrocytes. We have termed this cell-associated matrix fraction, the matrix fraction; it represents extracellular matrix dependent on HA for retention. The 68–72-kDa bands were similar in size to the G1-ITEGE domain present in the conditioned medium of IL-1β-treated explant cultures of bovine articular cartilage (supplemental Fig. 1, lane +). The accumulation of G1-ITEGE bands within the matrix fraction of chondrocytes peaked after 24 h of IL-1β treatment (Fig. 2, A and C, black bars). Within the intracellular fraction (lysates from intact cells remaining after hyaluronidase treatment, Fig. 2, B and C, white bars), only background levels of G1-ITEGE were detectable on days 0–2 of IL-1β treatment. However, intracellular G1-ITEGE increased on days 3–5, during the same period as there was a reduced matrix G1-ITEGE. When trypsin treatment (rather than hyaluronidase) was used to discern intracellular G1-ITEGE, an increased accumulation of G1-ITEGE was also observed on day 3 in both hyaluronidase and trypsin treatment groups (Fig. 2, D and E). A progressive increase in G1-ITEGE was also observed in the matrix (Fig. 2, F and H, black bars) and intracellular (Fig. 2, G and H, white bars) fractions in response to 24 h treatment with increasing concentrations of IL-1β. The strongest immunostaining for G1-ITEGE in both fractions was detected at 10 ng/ml IL-1β, and this concentration was used for all subsequent experiments.
FIGURE 1.
G1-ITEGE are bound and internalized by articular bovine articular chondrocytes. Bovine articular chondrocytes, grown on chamber slides, were incubated in the absence (A and B) or presence of 10 ng/ml IL-1β for 1 (C and D) or 3 (E and F) days under serum free conditions. Panels A, C, and E represent total G1-ITEGE, whereas panels B, D, and F represent intracellular accumulation of G1-ITEGE revealed after testicular hyaluronidase treatment to remove cell surface-associated G1-ITEGE. After treatments, the cells were fixed, permeabilized, and immunostained for G1-ITEGE. Coverslips were mounted with medium containing DAPI, and cells were visualized by fluorescence microscopy. Shown are digital overlay images of green and blue fluorescence channels. Ctr, control.
FIGURE 2.
Changes in G1-ITEGE accumulation in bovine articular chondrocytes. Bovine articular chondrocytes were incubated in the absence or presence IL-1β for varying times and concentrations and then analyzed by Western blot analysis for G1-ITEGE. Panel A, shown is the matrix fraction released from chondrocytes with testicular hyaluronidase; aliquots used represent equivalent volumes of samples. Panel B, shown is the intracellular fraction of chondrocytes after pretreatment with testicular hyaluronidase. Aliquots used represent equivalent protein of samples, verified by reprobing of the Western blot for β-actin. Panel D, shown is the intracellular fraction from another set of chondrocytes after pretreatment with testicular hyaluronidase (HA'ase) or trypsin with Western blots reprobed for β-actin. Panel F depicts the effect of varying concentration of IL-1β on the matrix, and Panel G depicts intracellular fractions with Western blots reprobed for β-actin. Bar graphs represent the average -fold increase in pixel intensity ± S.D. of bands representing G1-ITEGE, obtained from three separate Western blot analyses for each cell condition. Gel images were subjected to densitometric analysis using Image J software (rsb.info.nih.gov). -Fold increase in pixel density was obtained by normalizing band intensity for each condition to untreated, control sample values (Ctr). Relative band intensity of control values was set to 1. In addition, each Western blot of cell lysates was re-probed for expression of β-actin, and for each condition, the relative ITEGE band intensity values were normalized for changes in respective β-actin pixel intensity (as compared with β-actin of control condition). The normalized -fold increase changes in pixel intensity for each condition, derived from three separate experiments, were averaged, and S.D. was determined. Quantification of the matrix fraction is represented by dark bars (panels C and H), and the intracellular fraction is represented by white bars (panels C, E, and H). D1–D5, days of incubation with IL-1β.
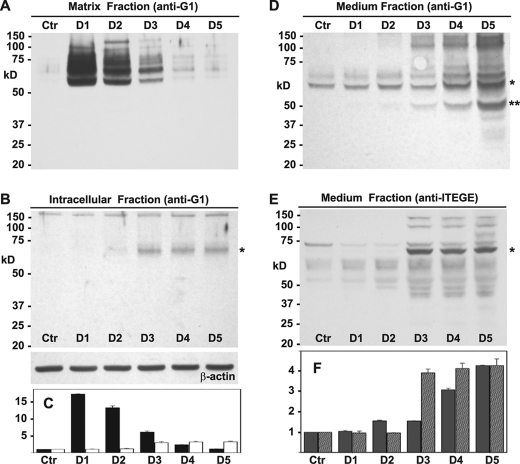
In others experiments, chondrocyte lysates were also examined using an anti-G1 antibody (Fig. 3). Again, the highest level of total G1 domains within the matrix fraction was observed after 24 h of IL-1β treatment, but there was less apparent reduction of G1 domains on days 2 and 3 (Fig. 3, A and C, black bars). Within the intracellular pool (Fig. 3, B and C, white bars) a faint 68-kDa band (asterisk) could be detected using the anti-G1 antibody in day 2 lysates, but the highest level of accumulation was again observed on day 3. In all subsequent experiments, the 24-h time point is shown for the hyaluronidase-released matrix fraction, and the 72 h time point is shown for the intracellular fraction. In an effort to determine whether aggrecan G1 domains were also being shed, concentrated conditioned media from these same chondrocyte cultures was analyzed using the anti-G1 (Fig. 3, D and F, gray bars) or anti-ITEGE (Fig. 3, E and F, gray striped bars) antibodies. Doublet bands of 68–72 kDa for G1 domains (asterisk) increased in medium of day 4 through day 5 cultures, as did an ∼60-kDa band (double asterisk). Upon detection with that anti-ITEGE antibody, 68–72-kDa bands (asterisk) were most prominent in day 3–5 media samples (Fig. 3, E and F, gray striped bars).
FIGURE 3.
Changes in accumulation of aggrecan G1 domains in bovine articular chondrocytes. Bovine articular chondrocytes were incubated in the absence or presence IL-1β for varying times, and medium, matrix, and intracellular fractions were analyzed by Western blot analysis for immunoreactivity with anti-G1 or anti-ITEGE antisera as labeled. Panel A, shown is the matrix fraction released from chondrocytes with testicular hyaluronidase. Aliquots used represent equivalent volumes of samples. Panels B, shown is the intracellular fraction of chondrocytes after pretreatment with testicular hyaluronidase. Aliquots used represent equivalent protein of samples, verified by reprobing of the Western blot for β-actin. Panels D and E represent serum-free medium samples collected from cultures shown in panel A, concentrated 10-fold, and equivalent volumes analyzed by Western blotting using anti-G1 (D) or anti-ITEGE (E) antisera. *, bands indicative of G1-ITEGE; **, band likely indicative of G1-DIPEN. Bar graphs represent the normalized average -fold increase in pixel intensity for aggrecan G1 domain or G1-ITEGE as labeled for each condition and including data derived from three separate experiments. Error bars depict S.D. In panel C, quantification of the matrix fraction is represented by dark bars, and the intracellular fraction is represented by white bars; panel F, medium G1 domains are gray bars, and medium G1-ITEGE are gray striped bars. Ctr, untreated control cultures; D1–D5, days of incubation with IL-1β.
G1-ITEGE Domain Internalization Is Dependent on CD44
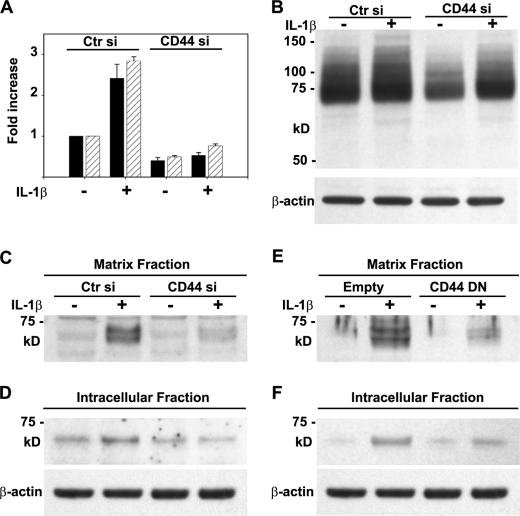
Using a single, CD44-specific siRNA transfected into primary bovine chondrocytes, CD44 mRNA was knocked down by ∼50% in chondrocytes compared with cells transfected with a nonspecific control siRNA (Fig. 4A). Moreover, the IL-1β-induced increase in CD44 expression was blocked in the presence of the CD44 siRNA. An approximate 50% knockdown of CD44 was confirmed by Western blot analysis (Fig. 4B). In IL-1β-treated chondrocytes transfected with control siRNA, G1-ITEGE was retained in the matrix fraction (Fig. 4C) and, after 3 days of incubation, could also be observed within the intracellular fraction (Fig. 4D). However, in the CD44-specific siRNA-treated chondrocytes, there was no accumulation of matrix fraction G1-ITEGE even with IL-1β treatment (Fig. 4C). Likewise, accumulation of intracellular G1-ITEGE was reduced by treatment with CD44-specific siRNA (Fig. 4D). As a second approach, bovine articular chondrocytes were transfected with a CD44 dominant negative mutant (CD44-DN) (30). After IL-1β stimulation G1-ITEGE was reduced in both the matrix and the intracellular fraction of cells transfected with CD44-DN (Fig. 4, E and F).
FIGURE 4.
Altering CD44 expression or function in bovine articular chondrocytes affects the retention and internalization of G1-ITEGE. Bovine articular chondrocytes were transfected as labeled in panels A–D with either control or CD44-specific siRNAs or in panels E and F, an empty control pcDM8 plasmid or CD44-DN/pcDM8 (30, 41). Two days after transfection, the cells were incubated in the absence or presence IL-1 and then analyzed by Western blot analysis for changes in G1-ITEGE (panels C–F). Panel A depicts CD44 expression as measured by real time RT-PCR after 1 day (black bars) or 3 days (striped bars) of IL-1 treatment; panel B shows CD44 protein expression on Western blots probed with an anti-CD44 cytotail antibody. Panels C and E, shown is the matrix fraction released from chondrocytes with testicular hyaluronidase. Aliquots used represent equivalent volumes of samples. Panels D and F, shown is the intracellular fraction of chondrocytes after pretreatment with testicular hyaluronidase. Aliquots used represent equivalent protein of samples, verified by reprobing of the Western blot for β-actin. Ctr, control.
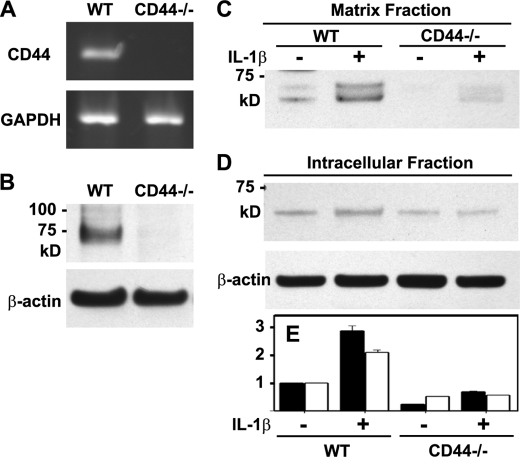
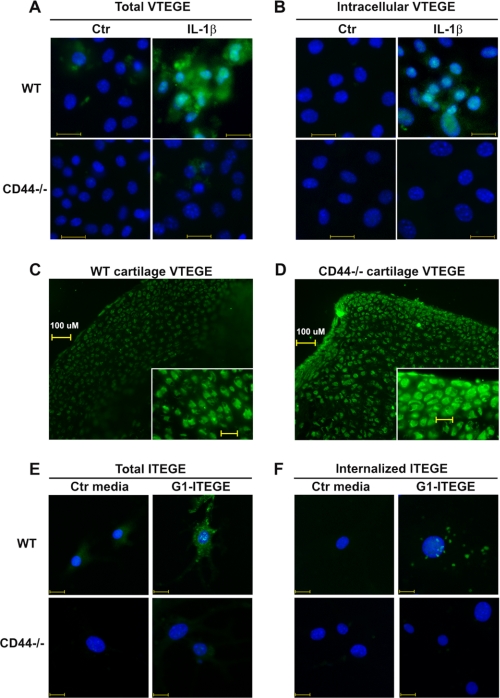
To further substantiate the role of CD44 in G1-ITEGE retention and internalization, experiments were done using chondrocytes derived from CD44-null (CD44−/−) or wild type mice. As expected, chondrocytes from CD44 null mice do not express CD44 mRNA (Fig. 5A) or protein (Fig. 5B). In primary chondrocytes derived from wild type mice, IL-1β treatment for 24 h generated G1-VTEGE (mouse sequence) retained in the matrix fraction (Figs. 5, C and E, black bars and 6A). This G1-VTEGE domain is approximately the same size as G1-ITEGE observed for bovine chondrocytes (Fig. 2A). After 3 days of treatment with IL-1β, an intracellular pool of G1-VTEGE was visualized in chondrocytes from wild type mice (Fig. 5, D and E, white bars and Fig. 6B). However, chondrocytes from CD44−/− mice had a substantially reduced level of matrix G1-VTEGE even with IL-1 stimulation (Figs. 5C and 6A), and no internalized G1-VTEGE was detected (Fig. 6B). Moreover, although a faint band for intracellular G1-VTEGE was seen in CD44 null chondrocytes (Fig. 5, D and E, white bars), there was no enhancement or accumulation after stimulation with IL-1β. Although G1-VTEGE is reduced in CD44−/− cells, this is not because of less HA or proteoglycan at the surface of these cells as compared with wild type. CD44−/− and wild type chondrocytes exhibit similar cell surface-associated HA and proteoglycan (supplemental Fig. 3). In both cell types, the HA was removed by treatment with testicular or Streptomyces hyaluronidase, which in turn resulted in the loss of stained proteoglycan.
FIGURE 5.
Changes in accumulation of G1-VTEGE in murine articular chondrocytes. Wild type (WT) and CD44−/− murine articular chondrocytes were first characterized for the expression of CD44 by conventional RT-PCR using GAPDH as a control (panel A) or Western blotting using IM7.8.1, an anti-mouse CD44 antibody (panel B). Wild type and CD44−/− mouse chondrocytes were then incubated in the absence or presence IL-1β and then analyzed by Western blot analysis for G1-VTEGE. Panel C, the matrix fraction was released from chondrocytes with testicular hyaluronidase. Aliquots used represent equivalent volumes of samples. Panel D, shown is the intracellular fraction of chondrocytes after pretreatment with testicular hyaluronidase. Aliquots used represent equivalent protein of samples, verified by reprobing of the Western blot for β-actin. The bar graph (panel E) shows the normalized average -fold increase in pixel intensity for G1-VTEGE in each condition, derived from three separate experiments, of the matrix fraction (dark bars) and the intracellular fraction (white bars). Error bars depict S.D.
FIGURE 6.
Binding and internalization of endogenous G1-VTEGE or exogenous G1-ITEGE domains by wild type and CD44 null murine articular chondrocytes. Murine articular chondrocytes, grown on chamber slides, were incubated in the absence or presence of 10 ng/ml IL-1β under serum-free conditions as labeled. Panel A represents total G1-VTEGE, whereas panel B represents intracellular G1-VTEGE revealed after testicular hyaluronidase treatment to remove cell surface-associated G1-VTEGE. Wild type chondrocytes (WT) and CD44−/− cells are labeled as shown. Cells were fixed, permeabilized, and immunostained for G1-VTEGE, mounted in medium containing DAPI, and visualized by fluorescence microscopy. Shown are digital overlay images of green and blue fluorescence channels. In a separate study, explants cultures of wild type (panel C) or CD44−/− (panel D) femoral heads were incubated with 10 ng/ml IL-1β for 7 days. The tissue explants were then fixed, embedded, cryostat-sectioned, and immunostained for G1-VTEGE domains. In panels E and F, passaged murine articular chondrocytes, grown on chamber slides, were incubated with control media (Ctr) or G1-ITEGE-containing medium derived from bovine cartilage explants cultures. Cells were fixed and immunostained for G1-ITEGE, as the cells shown in panels A and B. Panel E represents total G1-ITEGE retained, whereas panel F represents intracellular G1-ITEGE, revealed after testicular hyaluronidase treatment to remove cell surface-associated G1-ITEGE. Bars in panels A, B, E, and F indicate 20 μm.
These data suggest that CD44 is required for G1-ITEGE retention and internalization by chondrocytes. However, the assays using murine primary chondrocytes depend on cell responsiveness to IL-1β to generate endogenous G1-VTEGE and adequate levels of aggrecan and aggrecanase synthesis. As an alternative approach, G1-ITEGE-containing conditioned medium, obtained from explant cultures of bovine articular cartilage (supplemental Fig. 1), was added to cultures of chondrocytes derived from wild type or CD44 null mice as a source of exogenous G1-ITEGE. However, in this series of experiments the mouse chondrocytes were allowed to de-differentiate for two passages. Under these conditions, no endogenous aggrecan is synthesized, and thus, no endogenous G1-VTEGE domain can be generated. By immunohistochemistry, bovine G1-ITEGE could only be observed binding to wild type mouse chondrocytes (Fig. 6E). No G1-ITEGE could be detected on chondrocytes derived from CD44−/− mice. When the cells were treated with hyaluronidase to reveal intracellular neoepitope, bovine-derived G1-ITEGE had accumulated within the wild type chondrocytes but not within the CD44−/− chondrocytes (Fig. 6F). To exclude the possibility that residual IL-1β in the explant-conditioned media had resulted in endogenous mouse G1-ITEGE, the cells were treated with IL-1β directly, and no G1-ITEGE accumulation was observed (data not shown). Taken together, these data suggest that CD44 expression is required for G1-ITEGE internalization.
If G1-VTEGE generation does occur in CD44−/− mouse chondrocytes in response to IL-1 (Figs. 5C and 6A), but internalization is limited (Figs. 5D and 6B), G1-VTEGE would be expected to accumulate within the intact cartilage of CD44−/− mice. To investigate this hypothesis, intact newborn femoral heads from wild type and CD44 null mice were incubated in media containing IL-1β for 5 days, similar to culture conditions used to culture bovine cartilage slices. Substantially more G1-VTEGE accumulation was observed in sections of the femoral heads of CD44−/− mice (Fig. 6D) as compared with wild type mice (Fig. 6C).
G1-ITEGE Internalization Is Dependent on Cholesterol-rich Membrane Microdomains and Protein Palmitoylation
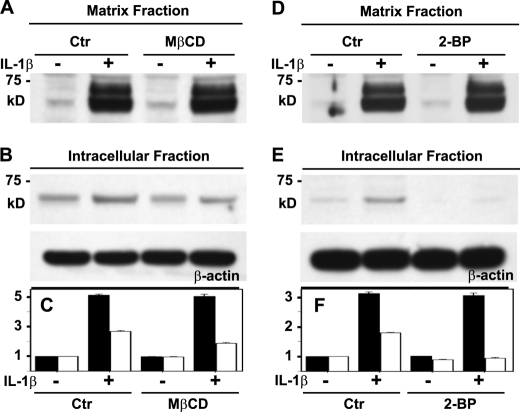
We have shown previously that HA internalization via CD44 in transfected cells was dependent on CD44 palmitoylation and the transit of the receptor into lipid rafts (32). Whether a similar mechanism occurs in chondrocytes and is an event necessary for the co-internalization of aggrecan G1 domains is not known. One approach to examine this question was to chelate chondrocyte membrane cholesterol using MβCD (32). In control non-MβCD-treated bovine articular chondrocytes, IL-1β treatment increased G1-ITEGE within the matrix fraction (Fig. 7, A and C, black bars) as well as the intracellular fraction (Fig. 7, B and C, white bars). Upon pretreatment of chondrocytes with MβCD, the IL-1β-mediated increase in G1-ITEGE accumulation within the matrix fraction was still observed (Fig. 7, A and C, black bars). However, within the intracellular fraction, no increase in G1-ITEGE due to IL-1β was observed after treatment with MβCD (Fig. 7, B and C, white bars). Thus, blocking lipid raft-dependent CD44 internalization blocked accumulation of intracellular G1-ITEGE. Another approach was to use the palmitoylation inhibitor 2-BP. As with the MβCD-treated cells, 2-BP had no effect on matrix G1-ITEGE retained at the cell surface (Fig. 7, D and F, black bars), but 2-BP blocked uptake and accumulation of intracellular G1-ITEGE (Fig. 7, E and F, white bars). The results suggest that conditions that limit CD44 endocytosis also prevent G1-ITEGE uptake. IL-1β treatment affects an increase in overall CD44 expression as we have shown previously (27); however, MβCD or 2-BP had no effect on this change in CD44 (data not shown).
FIGURE 7.
Altering CD44 capacity to transit into lipid rafts affects internalization but not retention of G1-ITEGE domains. Bovine articular chondrocytes were pretreated with or without either 10 mm MβCD (panels A–C) or 10 μm 2-BP (panels D–F). The cells were next incubated in the absence or presence IL-1β and then analyzed by Western blot analysis for accumulation of G1-ITEGE. Panels A and D depict the matrix fraction released from chondrocytes with testicular hyaluronidase. Aliquots used represent equivalent volumes of samples. Panels B and E depict the intracellular fraction of chondrocytes after pretreatment with testicular hyaluronidase. Aliquots used represent equivalent protein of samples, verified by reprobing of the Western blot for β-actin. Bar graphs in panels C and F represent the normalized average -fold increase in pixel intensity for G1-ITEGE in each condition, derived from three separate experiments. Error bars depict S.D. Quantification of the matrix fraction is represented by dark bars, ad the intracellular fraction is represented by white bars. Ctr, control.
G1-ITEGE Internalization Is Dependent on CD44 but Also Occurs in Synovial Fibroblasts
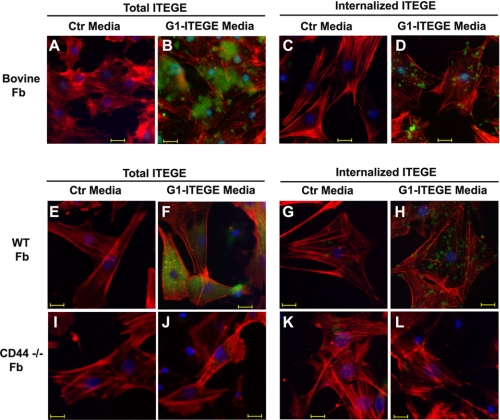
Although HA and bound aggrecan G1 domains are internalized locally by CD44-positive chondrocytes, a certain amount of the HA is also thought to be lost from the tissue (6, 25). To address the possible fate of this fraction, G1-ITEGE uptake was examined on cultures of bovine and mouse synovial fibroblasts. Bovine synovial fibroblasts (supplemental Fig. 2, white bars) express CD44 and ADAMTS5 mRNA but show no change in expression of CD44 or ADAMTS5 in response to treatment with IL-1β compared with cultures of bovine articular chondrocytes (supplemental Fig. 2, black bars). No expression of ADAMTS4 or aggrecan mRNA was observed in cultures of bovine synovial fibroblasts as compared with bovine articular chondrocytes. Thus, although the synovial fibroblasts exhibit a basal level of ADAMTS5, they do not express sufficient endogenous aggrecan to generate significant endogenous G1-ITEGE, and this is validated in control cultures stained for G1-ITEGE (Fig. 8A). However, when conditioned medium containing bovine G1-ITEGE (collected from IL-1 stimulated bovine cartilage slices) was added to the synovial fibroblasts, G1-ITEGE was retained at the cell surface (Fig. 8B). Moreover, upon hyaluronidase treatment of these cells, intracellularly localized G1-ITEGE domains could also be detected in synovial fibroblasts (Fig. 8D). Fibroblast cultures were established from the loose connective tissue immediately adjacent to knee joints of newborn mice. These cells were used as a model for mouse synovial fibroblasts. Like the bovine synovial fibroblasts, wild type mouse fibroblasts bound (Fig. 8F) and internalized (Fig. 8H) bovine G1-ITEGE, whereas no binding (Fig. 8J) or internalization (Fig. 8L) was observed on synovial fibroblasts from CD44−/− mice.
FIGURE 8.
Binding and internalization of exogenous G1-ITEGE by bovine or murine synovial fibroblasts. Bovine synovial or murine limb fibroblasts (Fb), grown on chamber slides, were incubated with control (A, C, E, G, I, and K) or G1-ITEGE-containing media (B, D, F, H, J, and L) derived from bovine cartilage explant cultures. Panels labeled Total ITEGE represent direct immunodetection of all cell-associated G1-ITEGE, whereas panels labeled Internalized ITEGE depict G1-ITEGE revealed after testicular hyaluronidase treatment to remove cell surface-associated G1-ITEGE. Bovine synovial fibroblasts are shown in panels A–D. WT mouse Fb are shown in panels E–H, and CD44−/− fibroblasts are shown in panels I–L. After treatments, the cells were fixed, permeabilized, and immunostained for G1-ITEGE and rhodamine isothiocyanate-phalloidin. Coverslips were mounted in medium containing DAPI, and cells were visualized by fluorescence microscopy. Shown are digital overlay images of red, green, and blue fluorescence channels. Bars in these images indicate 20 μm. Ctl, control.
DISCUSSION
In this study the cellular fate of aggrecan G1-ITEGE in chondrocytes was determined. Although previous studies have documented that G1-ITEGE can be internalized by chondrocytes (19, 33), these earlier works were primarily based on immunohistological/cytological analyses. One goal of this study was to demonstrate directly the retention and internalization of the 68–72-kDa G1-ITEGE by way of Western blotting. Interestingly, although a doublet band for G1-ITEGE was commonly observed in the cell-associated matrix fraction, only the single, smaller band is observed within the intracellular fraction. At present it is not known whether the larger band was not internalized or internalized and then rapidly degraded. A single band for the intracellular-localized ITEGE-G1 band was also observed when blots were probed with an anti-G1 antibody. Moreover, the detection by this second antibody (the anti-G1 antibody that targets an epitope independent from the C-terminal ITEGE neo-epitope) provides confirmation that these 68–72-kDa aggrecan G1 domains are retained and internalized by chondrocytes.
Changes in the matrix fraction pool of G1-ITEGE are likely due to a balance between continued generation of G1-ITEGE and turnover, with turnover mediated via internalization and shedding of the G1 domains. A progressive increase in G1 domains in the medium fractions was observed that closely matched the decrease in matrix fraction G1 domains. Interestingly, a proportion of the G1-ITEGE in the matrix fraction may also be cleaved further by matrix metalloproteinases and converted into G1-DIPEN domains. A progressive increase in a 60-kDa band detected with the anti-G1 antibody was observed in the medium fractions from day 3 to day 5 cultures, which is indicative of G1-DIPEN. However, at present it is not known whether the G1 domains present in the medium fraction represent G1 domains shed from the cell-associated matrix or aggrecan monomer degraded within the medium itself. Intracellular accumulation also likely represents the slow but continuous uptake of G1 domains from the cell surface. Nonetheless, considering day 2 as a snapshot in time, the intracellular pool of G1-ITEGE represents ∼10% of the total G1-ITEGE associated with the chondrocytes in both pools. These results are in good agreement with our early studies documenting the internalization of 3H-labeled HA by rat chondrosarcoma chondrocytes. In that study, 11% of the total [3H]HA was intracellular 8 h after adding exogenous [3H]HA (26). Notwithstanding, G1-ITEGE is released from the tissue (7, 22, 39, 40). However, the shedding of G1-ITEGE from intact cartilage is more closely aligned with HA loss described in earlier studies by Ng et al. (6) wherein only 9% of the loss of total newly synthesized HA could be attributed to release from the tissue.
Another outcome of this study is that the HA receptor CD44 is required for accumulation of intracellular G1-ITEGE. The simplest model to explain these results is that CD44 mediates the internalization of HA together with small molecules that remain bound to the HA; that is, molecules such as the G1-ITEGE. The current data are consistent with our previous work on the requirement of CD44 for the endocytosis of HA and that reagents that prevent the transit of CD44 into lipid rafts block the endocytosis of HA (32). If G1-ITEGE is generated primarily within the extracellular space and there is a defect in the local CD44-mediated turnover of these fragments, it would be expected that these domains would accumulate within the matrix. Therefore, we also explored cartilage and chondrocytes derived from CD44−/− mice. Accumulation of G1-VTEGE within intact cartilage of CD44−/− mice was substantially elevated as compared with similarly treated wild type mouse cartilage. This suggests that local CD44-mediated endocytosis does represent a major mechanism for the clearance of G1 domains after aggrecanolysis. We predict that the accumulation of degradation products within cartilage will eventually with age be detrimental to the health of the tissue. For example the accumulation of degradation products may obstruct cartilage repair by limiting available binding sites on HA and, thus, reduce the retention of newly synthesized aggrecan. To our knowledge there are no reports on cartilage changes with aging in CD44−/− mice, and thus, it remains one of our long term goals as we continue to age this colony.
We have previously shown that HA decorated with intact aggrecan monomers cannot be internalized by bovine chondrocytes in culture (31). However, when the monomers are cleaved, the HA and bound G1 domains are readily internalized. Thus, we propose one mechanism in which aggrecanase cleavage releases the chondroitin sulfate-rich domain of aggrecan from aggregates followed by the immediate uptake of the residual HA-G1 complexes by local chondrocytes. The extent of this uptake combined with shedding from the tissue would need to match the overall loss of aggrecan. To be effective this would necessitate aggrecanase cleavage within an area close enough to the chondrocyte cell surface to allow CD44 binding and uptake. However, in CD44−/− chondrocytes there is less G1-VTEGE present in the matrix fraction as compared with wild type mouse chondrocytes. Both wild type and CD44−/− chondrocytes exhibit similar levels of pericellular HA as well as stainable proteoglycan, retained at the cell surface via HA (supplemental Fig. 3). Thus, the deficit in G1-VTEGE associated with CD44−/− chondrocytes cannot be explained by a deficit HA or proteoglycan substrate for aggrecanases. This result may indicate that 1) CD44-retained HA/aggrecan aggregate is preferentially cleaved by aggrecanases, or 2) after aggrecanolysis, HA/G1 domain complexes are more readily retained at the cell surface in CD44-expressing cells for subsequent endocytosis. Coordinate turnover of aggrecan and HA may, thus, be regulated by spatial organization of CD44 and aggrecanase to generate a temporal activity for cartilage homeostasis. In this model the turnover of both aggrecan and HA would be both initiated and regulated by the activity of an aggrecanase. However, if a defect occurs in CD44 function or aggrecan is degraded within the more distant extracellular matrix, HA and G1-ITEGE will likely accumulate.
Supplementary Material
Acknowledgments
We thank Dr. Tibor T. Glant and Dr. Katalin Mikecz (Rush University Medical Center, Chicago, IL) for graciously providing the CD44−/− mice (BALB/c background). We also thank Christy Holland and Joani Zary for technical assistance.
This work was supported, in whole or in part, by National Institutes of Health Grants RO1-AR43384 (to W. K.) and R01-AR39507 (to C. B. K.).

The on-line version of this article (available at http://www.jbc.org) contains supplemental Figs. 1–3.
- HA
- hyaluronan
- 2-BP
- 2-bromopalmitate
- MβCD
- methyl-β-cyclodextrin
- MMP
- matrix metalloproteinase
- ADAMTS
- a disintegrin and metalloprotease with thrombospondin motifs.
REFERENCES
- 1.Hardingham T. E., Fosang A. J. (1992) FASEB J. 6, 861–870 [PubMed] [Google Scholar]
- 2.Knudson W., Knudson C. (2004) Curr. Opin. Orthop. 15, 369–375 [Google Scholar]
- 3.Knudson W., Aguiar D. J., Hua Q., Knudson C. B. (1996) Exp. Cell Res. 228, 216–228 [DOI] [PubMed] [Google Scholar]
- 4.Knudson C. B., Knudson W. (2001) Semin. Cell Dev. Biol. 12, 69–78 [DOI] [PubMed] [Google Scholar]
- 5.Morales T. I., Hascall V. C. (1988) J. Biol. Chem. 263, 3632–3638 [PubMed] [Google Scholar]
- 6.Ng C. K., Handley C. J., Preston B. N., Robinson H. C. (1992) Arch. Biochem. Biophys. 298, 70–79 [DOI] [PubMed] [Google Scholar]
- 7.Sandy J. D., Verscharen C. (2001) Biochem. J. 358, 615–626 [DOI] [PMC free article] [PubMed] [Google Scholar]
- 8.Fosang A. J., Rogerson F. M., East C. J., Stanton H. (2008) Eur. Cell Mater. 15, 11–26 [DOI] [PubMed] [Google Scholar]
- 9.Lark M. W., Bayne E. K., Flanagan J., Harper C. F., Hoerrner L. A., Hutchinson N. I., Singer I. I., Donatelli S. A., Weidner J. R., Williams H. R., Mumford R. A., Lohmander L. S. (1997) J. Clin. Invest. 100, 93–106 [DOI] [PMC free article] [PubMed] [Google Scholar]
- 10.Tortorella M. D., Burn T. C., Pratta M. A., Abbaszade I., Hollis J. M., Liu R., Rosenfeld S. A., Copeland R. A., Decicco C. P., Wynn R., Rockwell A., Yang F., Duke J. L., Solomon K., George H., Bruckner R., Nagase H., Itoh Y., Ellis D. M., Ross H., Wiswall B. H., Murphy K., Hillman M. C., Jr., Hollis G. F., Newton R. C., Magolda R. L., Trzaskos J. M., Arner E. C. (1999) Science 284, 1664–1666 [DOI] [PubMed] [Google Scholar]
- 11.Tortorella M. D., Pratta M., Liu R. Q., Austin J., Ross O. H., Abbaszade I., Burn T., Arner E. (2000) J. Biol. Chem. 275, 18566–18573 [DOI] [PubMed] [Google Scholar]
- 12.Abbaszade I., Liu R. Q., Yang F., Rosenfeld S. A., Ross O. H., Link J. R., Ellis D. M., Tortorella M. D., Pratta M. A., Hollis J. M., Wynn R., Duke J. L., George H. J., Hillman M. C., Jr., Murphy K., Wiswall B. H., Copeland R. A., Decicco C. P., Bruckner R., Nagase H., Itoh Y., Newton R. C., Magolda R. L., Trzaskos J. M., Burn T. C. (1999) J. Biol. Chem. 274, 23443–23450 [DOI] [PubMed] [Google Scholar]
- 13.Stanton H., Rogerson F. M., East C. J., Golub S. B., Lawlor K. E., Meeker C. T., Little C. B., Last K., Farmer P. J., Campbell I. K., Fourie A. M., Fosang A. J. (2005) Nature 434, 648–652 [DOI] [PubMed] [Google Scholar]
- 14.Glasson S. S., Askew R., Sheppard B., Carito B., Blanchet T., Ma H. L., Flannery C. R., Peluso D., Kanki K., Yang Z., Majumdar M. K., Morris E. A. (2005) Nature 434, 644–648 [DOI] [PubMed] [Google Scholar]
- 15.van Meurs J. B., van Lent P. L., Singer II, Bayne E. K., van de Loo F. A., van den Berg W. B. (1998) Arthritis Rheum. 41, 647–656 [DOI] [PubMed] [Google Scholar]
- 16.van Meurs J. B., van Lent P. L., Holthuysen A. E., Singer II, Bayne E. K., van den Berg W. B. (1999) Arthritis Rheum. 42, 1128–1139 [DOI] [PubMed] [Google Scholar]
- 17.van Meurs J. B., van Lent P. L., van de Loo A. A., Holthuysen A. E., Bayne E. K., Singer II, van den Berg W. B. (1999) Ann. Rheum. Dis. 58, 350–356 [DOI] [PMC free article] [PubMed] [Google Scholar]
- 18.Lohmander L. S., Hoerrner L. A., Lark M. W. (1993) Arthritis Rheum. 36, 181–189 [DOI] [PubMed] [Google Scholar]
- 19.Fosang A. J., Last K., Stanton H., Weeks D. B., Campbell I. K., Hardingham T. E., Hembry R. M. (2000) J. Biol. Chem. 275, 33027–33037 [DOI] [PubMed] [Google Scholar]
- 20.Lark M. W., Gordy J. T., Weidner J. R., Ayala J., Kimura J. H., Williams H. R., Mumford R. A., Flannery C. R., Carlson S. S., Iwata M., Sandy J. D. (1995) J. Biol. Chem. 270, 2550–2556 [DOI] [PubMed] [Google Scholar]
- 21.Mercuri F. A., Doege K. J., Arner E. C., Pratta M. A., Last K., Fosang A. J. (1999) J. Biol. Chem. 274, 32387–32395 [DOI] [PubMed] [Google Scholar]
- 22.Little C. B., Hughes C. E., Curtis C. L., Janusz M. J., Bohne R., Wang-Weigand S., Taiwo Y. O., Mitchell P. G., Otterness I. G., Flannery C. R., Caterson B. (2002) Matrix Biol. 21, 271–288 [DOI] [PubMed] [Google Scholar]
- 23.Rogerson F. M., Stanton H., East C. J., Golub S. B., Tutolo L., Farmer P. J., Fosang A. J. (2008) Arthritis Rheum. 58, 1664–1673 [DOI] [PubMed] [Google Scholar]
- 24.Sztrolovics R., Recklies A. D., Roughley P. J., Mort J. S. (2002) Biochem. J. 362, 473–479 [DOI] [PMC free article] [PubMed] [Google Scholar]
- 25.Durigova M., Roughley P. J., Mort J. S. (2008) Osteoarthritis Cartilage 16, 98–104 [DOI] [PubMed] [Google Scholar]
- 26.Hua Q., Knudson C. B., Knudson W. (1993) J. Cell Sci. 106, 365–375 [DOI] [PubMed] [Google Scholar]
- 27.Chow G., Knudson C. B., Homandberg G., Knudson W. (1995) J. Biol. Chem. 270, 27734–27741 [DOI] [PubMed] [Google Scholar]
- 28.Aguiar D. J., Knudson W., Knudson C. B. (1999) Exp. Cell Res. 252, 292–302 [DOI] [PubMed] [Google Scholar]
- 29.Jiang H., Knudson C. B., Knudson W. (2001) Arthritis Rheum. 44, 2599–2610 [DOI] [PubMed] [Google Scholar]
- 30.Jiang H., Peterson R. S., Wang W., Bartnik E., Knudson C. B., Knudson W. (2002) J. Biol. Chem. 277, 10531–10538 [DOI] [PubMed] [Google Scholar]
- 31.Embry J. J., Knudson W. (2003) Arthritis Rheum. 48, 3431–3441 [DOI] [PubMed] [Google Scholar]
- 32.Thankamony S. P., Knudson W. (2006) J. Biol. Chem. 281, 34601–34609 [DOI] [PMC free article] [PubMed] [Google Scholar]
- 33.Embry Flory J. J., Fosang A. J., Knudson W. (2006) Arthritis Rheum. 54, 443–454 [DOI] [PMC free article] [PubMed] [Google Scholar]
- 34.Ohno S., Im H. J., Knudson C. B., Knudson W. (2006) J. Biol. Chem. 281, 17952–17960 [DOI] [PMC free article] [PubMed] [Google Scholar]
- 35.Szántó S., Gál I., Gonda A., Glant T. T., Mikecz K. (2004) J. Immunol. 172, 6723–6734 [DOI] [PubMed] [Google Scholar]
- 36.Ghatak S., Misra S., Toole B. P. (2005) J. Biol. Chem. 280, 8875–8883 [DOI] [PubMed] [Google Scholar]
- 37.Okamoto I., Kawano Y., Tsuiki H., Sasaki J., Nakao M., Matsumoto M., Suga M., Ando M., Nakajima M., Saya H. (1999) Oncogene 18, 1435–1446 [DOI] [PubMed] [Google Scholar]
- 38.Okamoto I., Kawano Y., Matsumoto M., Suga M., Kaibuchi K., Ando M., Saya H. (1999) J. Biol. Chem. 274, 25525–25534 [DOI] [PubMed] [Google Scholar]
- 39.Struglics A., Larsson S., Pratta M. A., Kumar S., Lark M. W., Lohmander L. S. (2006) Osteoarthritis Cartilage 14, 101–113 [DOI] [PubMed] [Google Scholar]
- 40.Chockalingam P. S., Zeng W., Morris E. A., Flannery C. R. (2004) Arthritis Rheum. 50, 2839–2848 [DOI] [PubMed] [Google Scholar]
- 41.Peterson R. S., Andhare R. A., Rousche K. T., Knudson W., Wang W., Grossfield J. B., Thomas R. O., Hollingsworth R. E., Knudson C. B. (2004) J. Cell Biol. 166, 1081–1091 [DOI] [PMC free article] [PubMed] [Google Scholar]
Associated Data
This section collects any data citations, data availability statements, or supplementary materials included in this article.


