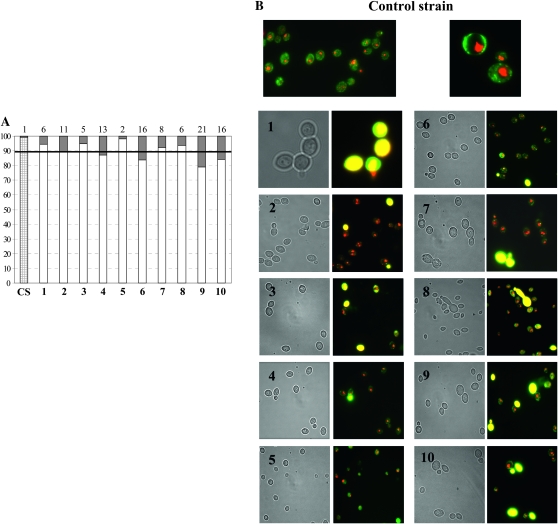
Figure 7.—
Viability test. (A) Representation of the percentage of dead cells at the late exponential phase of growth. The exact percentage of dead cells of each strain is reported on the top of the graph and is represented by shading on the bars. The dark horizontal line indicates the 10% value. CS: control strain; bars 1–10: SUSU1–SUSU10 translocants. (B) Fluorescence microphotography of FUN1-stained cells. Metabolically active/alive yeast cells containing CIVSs and dead/not metabolically active cells are shown in yellow. (1–10) SUSU1–SUSU10 translocants.

