

Abstract
Purpose
To develop methods to quantify cyclic strain, motion, and curvature of the murine abdominal aorta in vivo.
Materials and Methods
C57BL/6J and apoE−/− mice underwent 3D time-of-flight MR angiography to position cardiac-gated 2D slices at four locations along the abdominal aorta where circumferential cyclic strain and lumen centroid motion were calculated. From the 3D data, a centerline through the aorta was created to quantify geometric curvature at 0.1mm intervals. Medial elastin content was quantified with histology post-mortem. The location and shape of abdominal aortic aneurysms (AAAs), created from angiotensin II infusion, were evaluated qualitatively.
Results
Strain waveforms were similar at all locations and between groups. Centroid motion was significantly larger and more leftward above the renal vessels than below (p<0.05). Maximum geometric curvature occurred slightly proximal to the right renal artery. Elastin content was similar around the circumference of the vessel. AAAs developed in the same location as the maximum curvature and grew in the same direction as vessel curvature and motion.
Conclusion
The methods presented provide temporally and spatially resolved data quantifying murine aortic motion and curvature in vivo. This non-invasive methodology will allow serial quantification of how these parameters influence the location and direction of AAA growth.
Keywords: aorta, time-of-flight MRA, vessel motion, curvature, aneurysm, cyclic strain
Introduction
Abdominal aortic aneurysm (AAA) is a complex disease that leads to significant morbidity and mortality (1). AAAs are typically defined as a pathological increase of 1.5-fold or larger in vessel diameter (2). Diagnosis and monitoring are usually performed using non-invasive ultrasound, while only surgical options exist to prevent continued vessel growth and potential rupture. Vessel rupture is associated with a mortality rate as high as 90% (3).
As a way to better study disease progression, murine AAA models have been created that mimic the human disease (4). Any animal model has limitations, but working with mice has allowed the use of transgenics to probe genetic and molecular pathways, test new experimental therapeutics, and obtain tissue at different stages of disease progression, all of which are difficult, if not impossible, to achieve in human aneurysm studies. Commonly used murine AAA models include subcutaneous delivery of angiotensin II into apolipoprotein E-deficient (apoE−/−) mice via an implanted osmotic pump (5), infusing elastase into the infrarenal aorta (6), or applying calcium chloride periarterially (7).
Despite the efforts made in developing murine models of AAA, small animal imaging is under-utilized in the area of aneurysm research. Commonly used methods for assessing aneurysm geometry and progression remain simplistic: for example, categorical analysis based on the gross appearance of the aorta (8). Others often only measure maximum diameter in situ (9) or try to estimate luminal diameter ex vivo (10) with a “shrinkage index.” All of these methods necessarily limit measurements to a single timepoint. Until recently, few in vivo imaging studies have been conducted on small animal models of AAA. Of these serial studies performed using ultrasound (US), all measured aortic diameters at three or fewer locations along the vessel (11–14). Similarly, previous murine AAA MRI studies approximated maximum vessel diameter from 2D slices (0.8 to 1 mm thick), limiting overall vessel resolution (15,16). Few studies to date have fully leveraged the capability of MRI to non-invasively image large extents of murine vascular anatomy, visualize the aorta with high-resolution isotropic 3D scans, and quantify vessel motion and curvature.
Studying vessel mechanics is important in understanding cardiovascular disease. Previous work has shown that decreased wall motion inhibits the progression of atherosclerosis in animal models, likely due to reductions in cellular proliferation and lipid uptake into the vessel wall (17). Others have used pulse wave velocity (PWV) as a general index for in vivo vascular stiffness (18) to demonstrate apoE−/− mice infused with angiotensin II for 30 days have significantly increased vessel stiffness compared to control groups. While useful, aortic PWV does not provide localized data, something that US, MR, and computed tomography (CT) imaging can accomplish. For example, research using porcine models has quantified arterial wall motion and vessel strain from MR images in vivo at specific anatomic locations (19,20). This work also showed non-uniform circumferential deformation of the aorta, something that was also confirmed in humans using dynamic US, MR, and CT imaging techniques (21–23). Finally, US work has shown that, while infrarenal aortic wall dynamics are similar regardless of species, actual wall motion increases linearly with diameter and allometrically with body mass (24). These imaging studies have advanced our understanding of in vivo aortic motion, but minimal work has focused on determining aortic motion at specific anatomic locations in murine disease models.
Biomechanical factors also likely contribute to AAA development, progression, and rupture (25). In human patients, an asymmetric AAA resulted in elevated wall stress on the opposite surface (26). This may be clinically relevant as AAA rupture is believed to occur when the local mechanical stress exceeds the strength of the wall. Further work has gone on to use finite element simulations of patient-specific AAAs to estimate in vivo wall stresses (27). While these simulations have shown that AAA shape may be as important as maximum diameter (28), none have adapted these techniques for murine models of aneurysm disease.
The purpose of this study was to develop MRI methods for the quantification of overall aortic geometry and pulsatile motion in C57BL/6J wild-type (WT) and apoE−/− mice at four levels along the abdominal aorta. We used these imaging techniques to calculate strain waveforms, lumen centroid motion at each level, and geometric curvature along the length of the abdominal aorta. Post-mortem, the number of medial lamellar units (MLUs) and amount of medial elastin were also quantified in the suprarenal and infrarenal aorta. Our results demonstrated significant differences in aortic motion above and below the renal arteries. Furthermore, AAAs consistently developed at the location of maximum geometric curvature and appeared to expand in the direction of aortic motion. The imaging and analysis methods developed and described here will allow us to quantitatively test the hypothesis that aortic motion and curvature influence the direction of aneurysm expansion.
Materials and Methods
All experiments were carried out with local institutional animal care and use committee approval.
Animal Model
Adult male 24- to 41-week-old wild-type (WT) and apoE−/− mice (C57BL/6J background for both) were used in this study. For all surgical procedures and imaging, animals were anesthetized with 2% isoflurane in 2 L/min of medical air. Animal temperature was maintained between 36° and 38°C using a heating pad during surgery and warm air during imaging.
Vessel Imaging
Animals were placed in the supine position for imaging (WT, n = 9; apoE−/−, n = 9). All MR imaging was performed at 4.7 T using a Direct Drive console (Varian, Inc., Palo Alto, CA, USA) and a 4 cm inner diameter transmit-receive volume coil (Morris Instruments Inc., Ottawa, Ontario, Canada). A 3D time-of-flight (TOF) sequence was used to acquire a scout image of the aorta above and below the renal arteries (TR/TE 15/3 ms, FOV (3 cm)3, flip angle (α) 20°, matrix 1283 zero-filled to 2563, slab thickness 15 mm, NEX 2). A 4 mm saturation band was placed approximately 2 mm below the excitation slab to null the signal from venous flow. The imaging parameters were chosen to enhance signal in moving blood (i.e. bright-blood), where flowing fluid in the vessel lumen appears brighter than the partially saturated surrounding tissue. Coronal and sagittal maximum intensity projections (MIPs) of these images were used to plan image planes orthogonal to the vessel immediately proximal to the celiac artery (supraceliac - SC), between the celiac and right renal artery (suprarenal - SR), halfway between the left renal artery and aortic trifurcation formed by the two iliac and tail arteries (infrarenal - IR), and immediately proximal to the tail artery (supratrifurcation - STri) levels. A cardiac-gated 2D TOF sequence with 12 cine frames was used to quantify lumen expansion throughout the cardiac cycle in each of the four locations (TR 96–126 ms depending upon heart rate, TE 4 ms, FOV (2 cm)2, α 20°, matrix 1282 zero-filled to 2562, slice thickness 2 mm, NEX 8). A saturation band (20 mm) was placed approximately 2 mm below the slice of interest to null the venous signal. Two subcutaneous ECG leads and a respiratory monitor (SA Instruments, Inc., NY) were utilized for prospective triggering off the R-wave only during exhalation. The total imaging time per animal was approximately 40 minutes.
For comparison, these same mice were imaged at the SR and IR levels with a small animal US system (Vevo770; VisualSonics Inc., Toronto, Canada). The diminutive vessels (the aorta in mice is roughly 1 mm in diameter above the renal arteries and 0.8 mm below) and rapid heart rates in rodents required a transducer stabilizing system consisting of a heated platform to maintain body temperature and a transducer mount with an integrated rail system. A depilatory cream was used to remove hair over the abdomen before imaging. Images from an anteroposterior projection over the aorta were collected with a single element transducer (RMV-707B; center frequency, 30MHz; focal length, 12.7 mm; axial resolution, 55 µm; lateral resolution, 115 µm). Cardiac-gated b-mode loops were collected using the ECG-gated kilohertz visualization (EKV™) function, creating a loop representing one cardiac cycle. SC and STri levels were not imaged with US because of the technical difficulties associated with imaging near the diaphragm and through the bowel. Furthermore, the SR and IR levels were of more interest as these are the levels where AAAs typically form in commonly-used murine models.
Image Quantification
Using the 2D TOF images, the lumen boundary in each frame was defined using thresholding or manual segmentation, depending on image quality, with vascular modeling software (29). These segmentations were then Fourier smoothed to eliminate high frequency noise with 8 modes. The number of Fourier modes was empirically determined to provide enough image detail without over smoothing. In a smaller set of images, 2–3 people segmented and compared lumen expansion data at all four aortic locations; the error between analyses was less than 10%. As described previously (22), the perimeter (P) of each segmentation was calculated by summing the distances between consecutive points around the circumference (MATLAB, The Mathworks Inc., Natick, MA, USA). The US images were analyzed in a similar manner at 12 equally-spaced time frames using a manual segmentation technique within the Vevo770 software. Green-Lagrange circumferential cyclic strain waveforms were calculated as follows (30):
| [1] |
where Pi is the perimeter at any given time frame (with ‘i’ varying between 1 and 12) and Pdias is the perimeters of the vessel at end diastole (the minimum or assumed unloaded dimension). The magnitude of lumen centroid motion was determined by measuring the distance between the centroids at peak systole and end diastole. The direction of lumen centroid motion was determined by measuring the angle between anterior (defined as 0°) and the vector between the lumen centroids at peak systole and end diastole. Positive angles represent the animals’ left; negative angles represent the animals’ right (Figure 3A).
Figure 3.
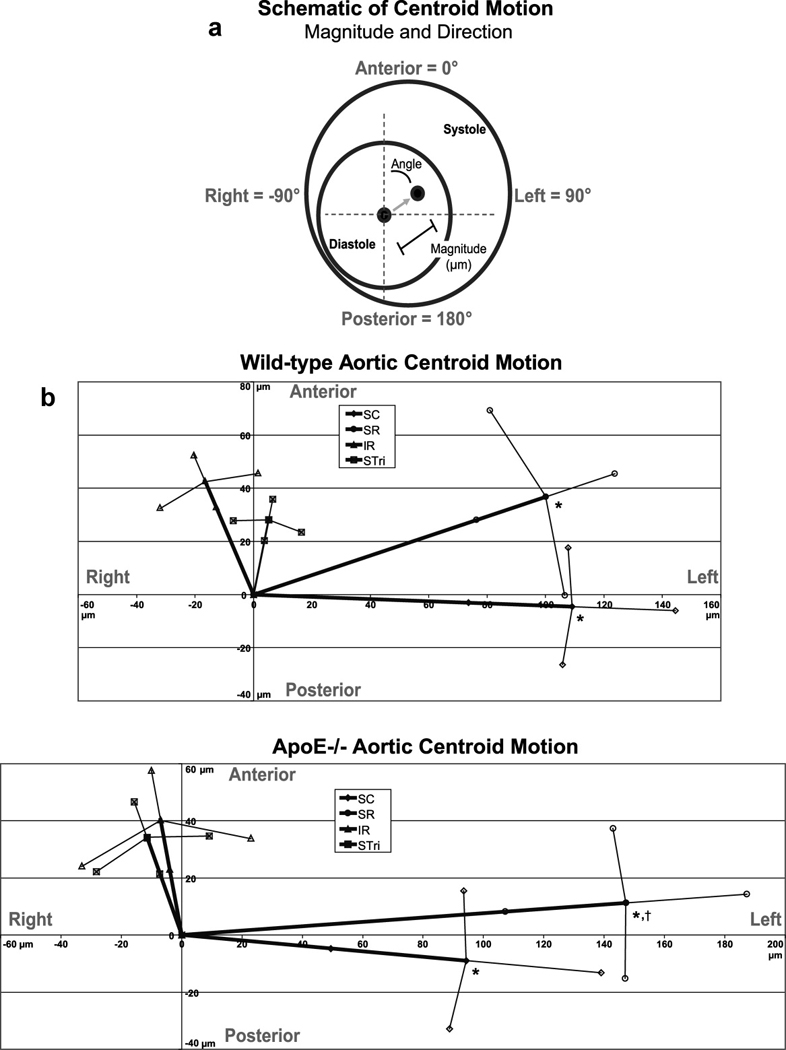
Lumen centroid motion through the cardiac cycle. (A) Schematic showing magnitude and angle of centroid motion. The anterior direction was defined as 0°, left as 90°, right as −90°, and posterior as ±180°. (B) WT and apoE−/− centroid motion at all four locations (SC, SR, IR, and STri). The magnitude values at both the SC and SR levels were significantly greater than either the IR or STri levels for both WT and apoE−/− mice (*p < 0.01). The magnitude of the SR level in apoE−/− mice was also significantly larger than the SC level (†p < 0.01). Furthermore, the direction of centroid motion at both the SC and SR levels was much more leftward than either the IR or STri levels for both genotypes. Data shown as mean ± SD for both the magnitude and angle values.
Aortic Histology
After in vivo image acquisition, all animals were euthanized by CO2 inhalation and pressure perfused with 4% paraformaldehyde at 100 mmHg through the left ventricle for five minutes (WT, n=5; apoE−/−, n=6). The aortas were removed and striped with four different colored dyes to keep track of vessel orientation (anterior, left, posterior, and right) after processing. Vessels were embedded in paraffin and 5 µm slices were taken at IR and SR levels. Again, SC and STri levels were not sectioned because these levels do not develop aneurysms in typical murine AAA models. Sections were stained with hematoxylin and eosin (H&E) and elastic van-Gieson (EVG). The number of medial lamellar units (MLUs) was counted at both SR and IR levels from the EVG images by two blinded observers at four equally-spaced circumferential locations. The amount of medial elastin area was quantified with a thresholding technique that produced a binary image of the elastin pixels (MATLAB). A region of interest (ROI) was hand-selected in each quadrant and, in addition to elastin area, the inner vessel perimeter was calculated for each region. Elastin area was then divided by the inner vessel perimeter to produce a normalized medial elastin area metric that was independent of the size of the ROI.
Aortic Curvature
Methods for quantifying geometric curvature from vessel centerlines have been described in detail previously for large human vessels (31). We modified these methods for the murine aorta. Briefly, the centroids of 100 segmentations along the aorta from the 3D TOF scans were calculated to create an aortic centerline. Irregularities along the centroid-based centerline were removed by Fourier smoothing (31). A circumscribed circle was created by connecting three points separated along the centerline (Figure 6A). The total distance between the three points, or window size, was set to approximately twice the aortic diameter (2 mm suprarenally, 1.5 mm infrarenally) at each image location. The geometric curvature (κ) was defined by the inverse of the radius of this circle as follows:
| [2] |
Curvature was calculated in increments of 0.1 mm down the length of the abdominal aorta. The location of the maximum curvature was calculated in reference to the right renal artery. In order to compare the direction of aortic motion over the cardiac cycle (angle 1) and direction of aortic curvature (angle 2), a correlation factor was defined as follows:
| [3] |
Thus, a difference between angles of zero corresponds to a factor of one and shows total correlation, a difference of 90 corresponds to a factor of zero, and a difference of 180 corresponds to a factor of −1 (reflecting an opposite correlation).
Figure 6.
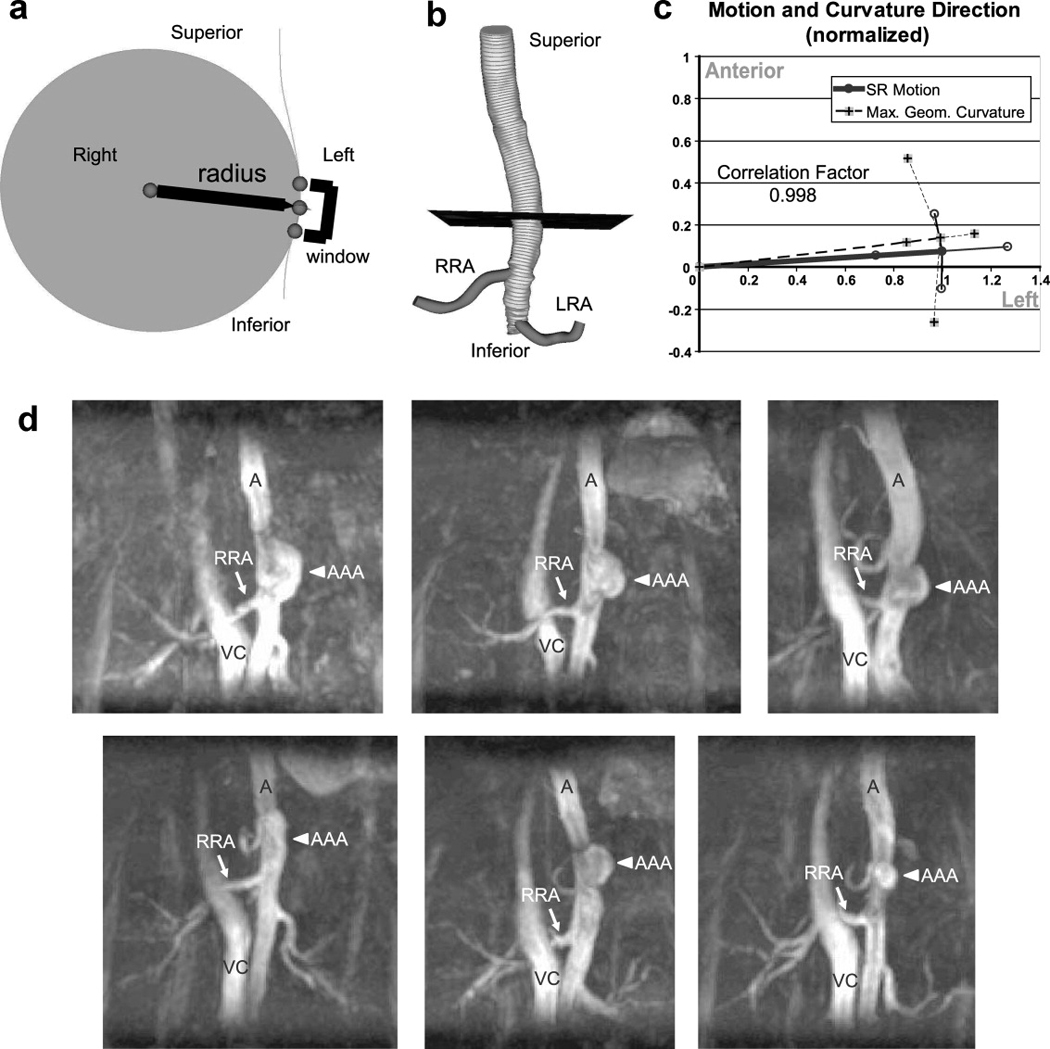
Curvature schematics, comparison to motion, and representative MIPs of murine AAAs. (A) A circumscribed circle (grey region) connected through three points (spheres) along the aortic centerline was used to compute the curvature of the vessel. The points were separated a total of 2 mm in the suprarenal and 1.5 mm in the infrarenal aorta (window size). The aortic curvature was calculated as 1/radius (mm−1) at 0.1 mm intervals along the centerline to find the location of maximum curvature. (B) The location of maximum curvature (black plane) was located an average of 1.65 ± 0.53 mm above the right renal artery (RRA). In mice, the RRA is slightly proximal to the left renal artery (LRA). The 99 segmentations, shown as thin grey lines, were used to calculate the centerline of the aorta. (C) A comparison of the direction of SR motion and maximum geometric curvature location in apoE−/− mice (both values normalized to 1). There was a high correlation factor between the direction of motion and curvature in the SR location (0.998). All data shown as mean ± SD. (D) Coronal MIPs of six suprarenal murine AAAs after 28 days of angiotensin II infusion. The aorta (A), vena cava (VC), RRA (arrow), and AAA (arrowhead) are labeled in each image. In the angiotensin II model, AAA formation qualitatively correlates with the location of maximum aortic curvature. The lumen of each AAA appears to be expanding to the left (the same direction as aortic centroid motion above the renal arteries).
Murine Aneurysm Model
In a separate cohort of mice, AAAs were created using a commonly used murine model (5). Briefly, 24-week-old apoE−/− mice (n = 6) had osmotic pumps (model 2004, Durect Co., Cupertino, CA, USA) surgically implanted that delivered angiotensin II subcutaneously at a rate of 1000 ng/kg/min. These mice typically develop AAAs directly above the right renal artery (16), usually between days 4 and 10 post-implantation (32). In our experience, approximately 75% of apoE−/− mice infused with angiotensin II at this age develop suprarenal AAAs. All mice underwent MR imaging with the same 3D TOF angiography sequence 28 days after pump implantation. In order to see the vena cava for anatomical reference, the venous saturation pulse was not used in these scans.
Statistical Analysis
All data are plotted as mean ± standard deviation (SD). Statistical analysis was done using one-way analysis of variance (ANOVA) using JMP (SAS Institute, Inc., Cary, NC, USA). Within each ANOVA, the P-values used to assess the statistical significance of pairwise comparisons were adjusted for multiplicity by the Tukey–Kramer method.
Results
Three-Dimensional MIPs Enabled Positioning of Slices Orthogonal to the Aorta
Coronal and sagittal MIPs from the 3D TOF images provided us with the capability to reproducibly place 2D imaging planes at specific anatomical locations (Fig. 1A). Branching vessels, such as the celiac artery (CA), superior mesenteric artery (SMA), right renal artery (RRA), and iliac arteries (I), can be easily seen in either the suprarenal or infrarenal scans and were used as anatomical markers for slice placement. The gated 2D TOF data, acquired orthogonal to the aorta at four locations (SC, SR, IR, and STri), shows typical aortic expansion throughout the cardiac cycle (Fig. 1B). The spine, running posterior to the aorta, is closer to the vessel distal to the renal arteries than in the SR and SC locations. Other supportive tissue, such as back musculature (M), surrounds different circumferential regions of the aorta at each slice location. A thresholding technique was generally used to segment the aortic lumen from surrounding tissue, but some images required manual correction due to flow imaging artifacts (primarily complex systolic flow and partial volume effects) or branching vessels running alongside the aorta. This was most often seen in the IR and STri locations where the testicular arteries (TeA; Figure 1A, IR and STri axial slices) reside directly anterior to the aorta.
Figure 1.
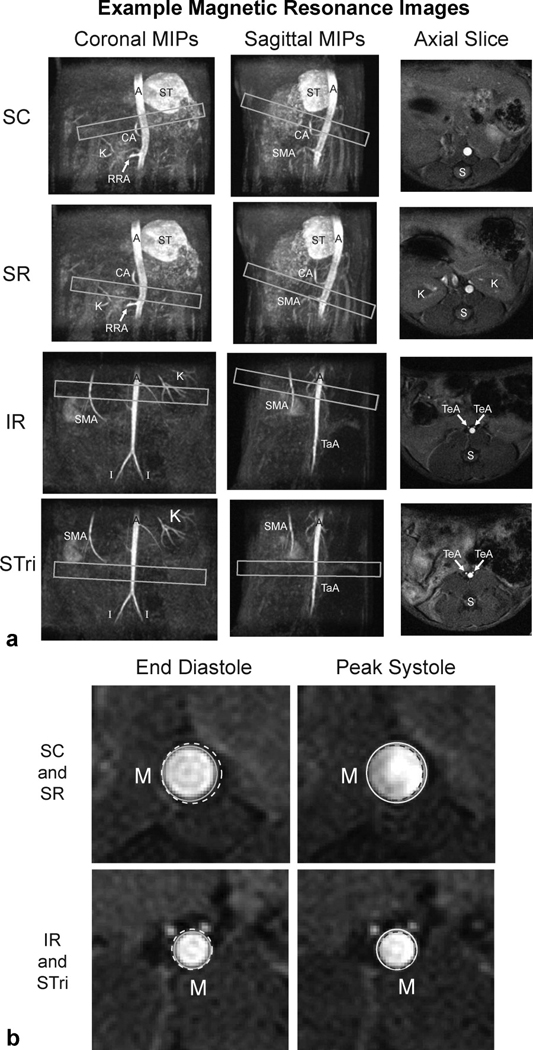
Representative MIPs and axial images of the aorta above and below the renal arteries. (A) Slice planning at four axial locations along the vessel (boxes) shown over coronal and sagittal MIPs (SC, SR, IR, and STri). The aorta (A), celiac artery (CA), iliac arteries (I), kidney vasculature (K), right renal artery (RRA), spine (S), stomach (ST), superior mesenteric artery (SMA), tail artery (TaA), and testicular arteries (TeA) are labeled. (B) Enlarged images of the axial slices above and below the renal arteries show typical aortic expansion from end diastole to peak systole (circles). Supportive back musculature (M) is labeled. The voxel dimensions for the 3D scans are (117 µm)3 and the 2D scans are (78 µm)2 with a 2 mm thick slice.
Abdominal Aortic Motion Differs Above and Below the Renal Arteries
Green-Lagrange circumferential cyclic strain curves at all four aortic locations for both WT and apoE−/− mice are shown in Fig. 2. Similar waveforms were observed with both MR and US images in the SR and IR locations. WT and apoE−/− mice had similar strain values at all four locations. The SD error bars are larger at maximum systole than at end diastole because the strain calculation normalizes our results to the assumed unloaded dimension (i.e. end diastole, usually occurring at frame 12). No significant difference was seen when comparing average maximum strain between genotypes or aortic locations (Table 1). The coordinates of the lumen centroid from each cine frame were also calculated, with the magnitude and direction of motion shown in Fig. 3 and Table 1. While there was no difference in motion between WT and apoE−/− mice, the centroid of the vessel at the SC and SR locations moved a significantly greater distance than the IR and STri locations (p < 0.01). The direction of this motion was also different above and below the renal arteries; SC and SR segments moved from right to left (mean angles between 69° and 96°), while IR and STri segments moved posterior to anterior, with only slight motion to the animals’ right (mean angles between −9° and −22°). Vessel motion did not change when the animal was imaged in the prone position (images and data not shown).
Figure 2.
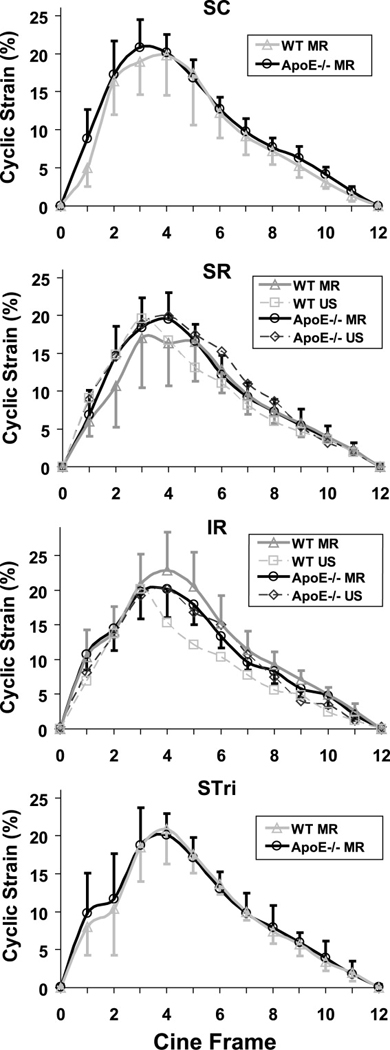
Green-Lagrange circumferential cyclic strain waveforms as a percentage of the diastolic diameter throughout the cardiac cycle at four axial locations (SC, SR, IR, and STri). WT and apoE−/− mice were measured with MR (solid lines) at all four locations, while ultrasound (dashed lines) was used to measure aortic motion at SR and IR levels. There was no significant difference in average maximum strain between genotypes or aortic locations (p > 0.55). MR data shown as mean ± SD. US data shown only as mean for figure clarity (the SD from the US measurements were bounded within SD of MR data).
Table 1.
Maximum circumferential cyclic strain and centroid motion data.
| Location and Genotype |
Maximum Circumferential Cyclic Strain (%) |
Centroid Motion | ||
|---|---|---|---|---|
| Magnitude (µm) | Angle (°) | |||
| SC | WT | 21.5 ± 6.3 | 109 ± 35* | 92.4 ± 11.6 |
| apoE−/− | 21.8 ± 3.0 | 95 ± 45* | 95.4 ± 14.8 | |
| SR | WT | 19.1 ± 5.5 | 107 ± 25* | 69.8 ± 20.4 |
| apoE−/− | 20.8 ± 3.7 | 148 ± 40*,† | 85.7 ± 10.3 | |
| IR | WT | 23.0 ± 5.5 | 46 ± 11 | −21.2 ± 23.1 |
| apoE−/− | 21.1 ± 2.8 | 41 ± 18 | −9.8 ± 43.9 | |
| STri | WT | 20.9 ± 4.6 | 29 ± 8 | −10.5 ± 24.4 |
| apoE−/− | 21.1 ± 3.1 | 36 ± 13 | −18.6 ± 33.4 | |
SC, supraceliac; SR, suprarenal; IR, infrarenal; STri, supratrifurcation; apoE−/−, apolipoprotein-E knock-out mice; WT, wild-type;
p < 0.01 – centroid motion magnitude values were significantly greater than either the IR or STri levels for both WT and apoE−/− mice;
p < 0.01 – apoE−/− SR magnitude value also significantly greater than the apoE−/− SC level.
Histology Reveals Similar Elastin Content Around the Circumference of the Vessel
Representative aortic sections of the suprarenal aorta of an apoE−/− mouse stained with H&E and EVG are shown in Fig. 4A. Applying colored dyes at known positions around the circumference allowed us to successfully orient each tissue section after staining. Enlarged images showing MLUs at the four circumferential locations can be seen in Fig. 4B (black dye for anterior; blue dye for left). Elastin sheets (arrows) are readily seen in each image. In addition, intimal macrophage infiltration, the earliest stage of atherosclerosis, was visible in a small number of sections (arrowhead), as would be expected for apoE−/− mice of this age (33). The number of MLUs was counted by two blinded observers at three different locations within each circumferential quadrant. These data showed little variation around the vessel. As expected (34), there were more MLUs in the suprarenal aorta than infrarenal (Fig. 4C). The amount of medial elastin per vessel perimeter, quantified from a user-defined region-of-interest (Fig. 5A), showed a non-significant increase at the SR level compared to the IR level, likely due to large standard deviations (Fig. 5B). There were no significant differences in elastin content around the circumference of the vessel for either WT or apoE−/− mice.
Figure 4.
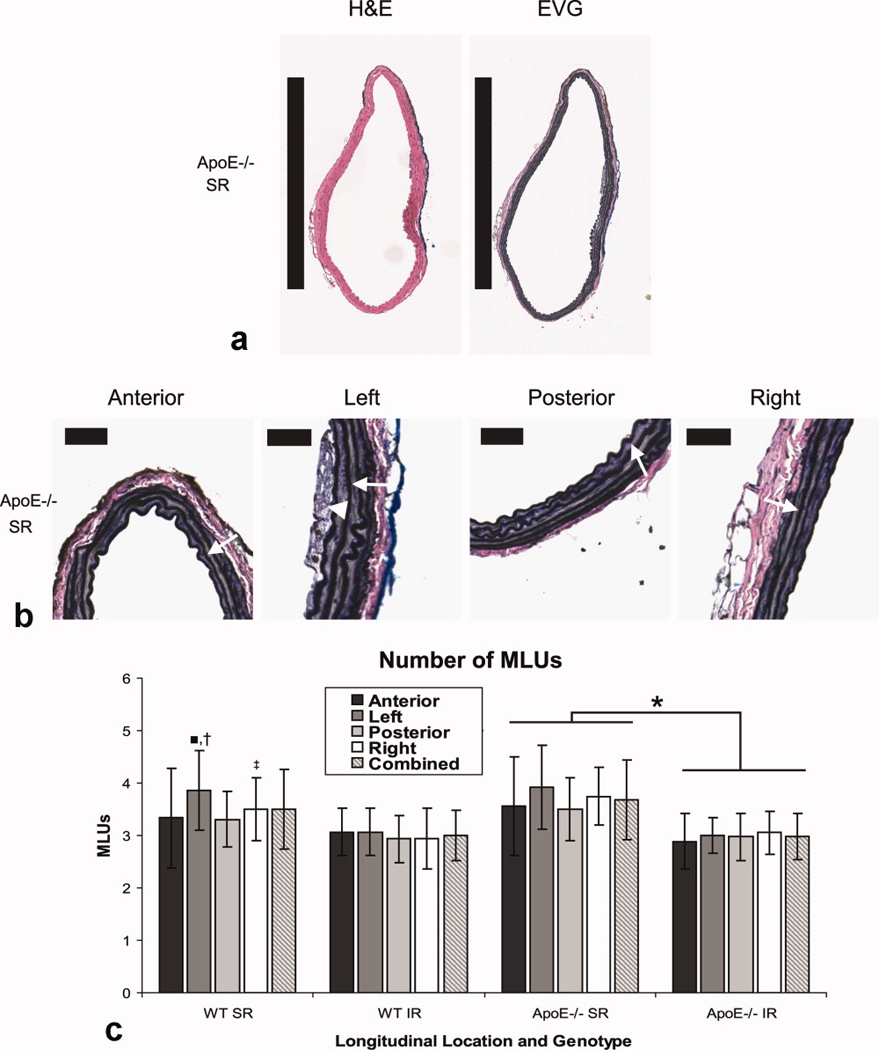
Axial histology sections, stained with H&E and EVG, and quantification of medial lamellar units. (A) Representative sections of the suprarenal region of an apoE−/− mouse at 100× magnification. Black bars represent 1mm. (B) Enlarged EVG images of the anterior, left, posterior, and right quadrants at 200× magnification highlighting elastin sheets within medial lamellar units (arrows). Black bars represent 50 µm. The earliest stage of atherosclerosis, a common characteristic of apoE−/− mice, is also seen in the left quadrant as macrophage accumulation within the intima (arrowhead). (C) Number of MLUs in WT and apoE−/− mice at both the SR and IR levels in four quadrants and the combined average. When comparing data within each genotype and aortic level, there were no significant differences except for the SR level in WT mice (MLUs in the left quadrant were greater than those in the anterior and posterior quadrants; ■p < 0.05). We also compared between aortic levels: in apoE−/− mice, all SR levels had more MLUs than any IR level (*p < 0.01). For WT mice, SR left was larger than all IR quadrants (†p < 0.01), and SR right was significantly larger than IR posterior and IR left (‡p < 0.05).
Figure 5.
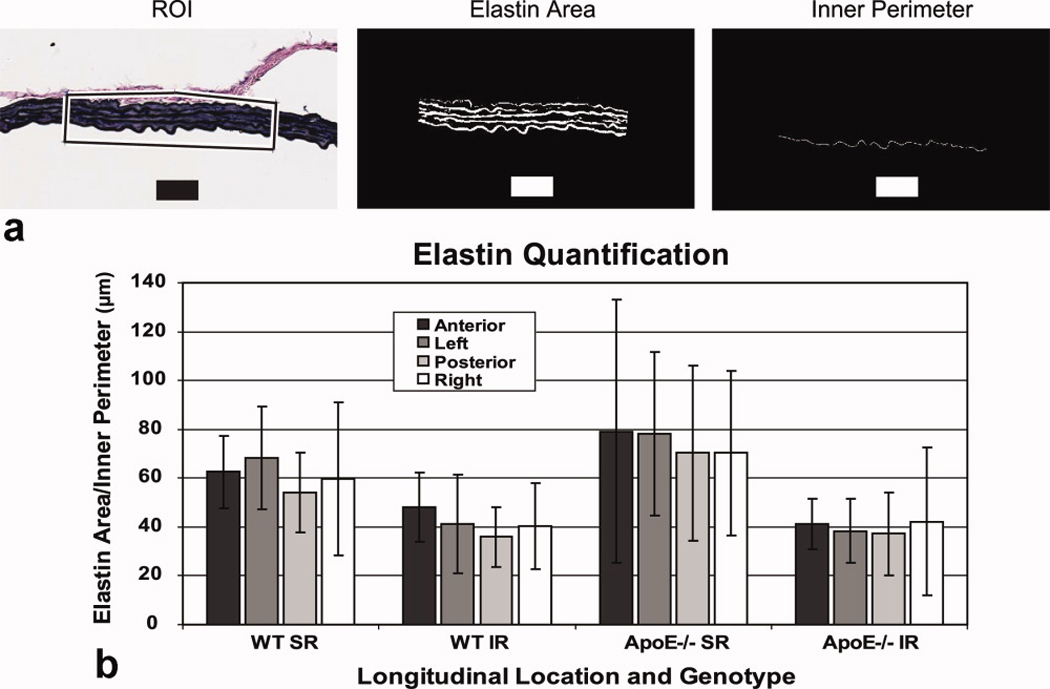
Quantification of medial elastin content. (A) Illustration of technique used for measurement of elastin within the medial layer. The region of interest (ROI - box), mask showing pixels defined as medial elastin, and the inner vessel perimeter were quantified using a threshold technique. Black and white bars represent 50 µm. (B) The ratio of elastin area over inner vessel perimeter of an ROI from each quadrant showed a non-significant increase in elastin at the SR level compared to the IR level. Differences around the vessel within each longitudinal location were not significant for either the SR or IR levels. All data shown as mean ± SD.
Maximum Abdominal Aortic Curvature Occurs Above the Right Renal Artery
The maximum geometric curvature of the abdominal aorta was 0.14 ± 0.02 mm−1 and occurred an average of 1.65 ± 0.53 mm above the right renal artery (Fig. 6A and B). The geometric curvature in the infrarenal section (0.078 ± 0.02 mm−1) was approximately half as much as the curvature in the suprarenal section. The direction of aortic curvature at the maximum value was 82.0 ± 23.1° to the left of anterior (angle defined in the same manner as for centroid motion). By comparing this to the motion of the aorta at the SR location in apoE−/− (85.7 ± 10.3°), we calculated the correlation factor to be 0.998 (equation 3, Fig. 6C). Varying the window size between 1 and 4 mm slightly changed the curvature values, but did not alter the location or direction of maximum curvature (data not shown).
Angiotensin II-Induced Aneurysms form Above the Right Renal Artery and Expand Leftward
The location of maximum aortic curvature above the right renal artery is noteworthy, as this is the same location angiotensin II-induced AAAs also develop (Fig. 6D). While previous research has shown that these AAAs are characterized by a focal dissection in the elastin lamellae, with an adventitial hematoma (thrombus) often forming between the media and adventitia (32), our 3D MR images further show that these aneurysms reproducibly expand leftward.
Discussion
Using 3D TOF and cardiac-gated MRA sequences, we quantified aortic motion and curvature at multiple locations along the abdominal aorta in WT and apoE−/− mice. We have shown that not only can MR techniques accurately track pulsatile lumen expansion in mice, but the amount of cyclic strain the aorta experiences is similar along the abdominal section of the vessel. Overall aortic dynamics were similar between WT and apoE−/− mice at the age investigated in this study. The direction of vessel expansion differs greatly above and below the renal arteries, with large leftward expansion suprarenal and smaller anterior expansion infrarenal. This observation is not easily attributed to variations in medial lamellar number or elastin structure. Instead, it is likely that natural vessel curvature and support from surrounding tissue (i.e. muscle, spine, liver, stomach, diaphragm, branching vessels, etc.) play a role in direction of pulsatile aortic expansion. Indeed, the diaphragm musculature and spine are often predominantly located to the right of the vessel above the renal arteries, and directly posterior in the infrarenal section. Comparison of our MR data to US measurements at the SR and IR locations (waveforms in Fig. 2) give us confidence that our technique accurately measures luminal expansion.
These methods represent an improvement over current techniques in assessing murine vasculature. First, non-invasive imaging alleviates the necessity of estimating in vivo geometry from post-mortem specimens and allows for data collection at multiple timepoints. Second, the 3D capabilities of MRA provide more information than previous murine AAA imaging studies (11–16), where only an estimate of maximum aortic diameter was measured. While others have noted the ability of MRI to non-invasively assess murine AAA development at multiple time points (16), our MRA technique produces high resolution 3D image data with isotropic voxels (117×117×117 µm3) that can be used to create maximum intensity projections and quantify vessel curvature. This vastly improves our ability to accurately visualize murine vasculature over 2D MR sequences which acquire consecutive axial slices 0.8 mm or thicker (15,16). High resolution data is especially important in mice where vessels are diminutive and diseased portions can be small and tortuous. Furthermore, the ability to reproducibly visualize branching vessels and other anatomical landmarks with MR makes reproducibly positioning imaging slices easier than with US, where signal artifacts due to intestinal gas are common. Third, measuring the perimeter of the aorta, instead of the diameter, improved our strain measurements. For example, above the renal arteries, the typical number of pixels across the aorta (or effective diameter) expanded from roughly 17 pixels at end diastole to 19 pixels at peak systole (Fig. 1B). Similarly, below the renal arteries, the number of pixels across the aorta expanded from roughly 12 to 13 pixels. But since we are measuring the vessel perimeter, our ability to quantify vessel expansion is more accurate. The perimeter in the SR location expands from roughly 3.3 to 4.0 mm, a difference of 0.7 mm or 9 pixels. Likewise, the perimeter in the IR location expands from roughly 2.2 to 2.6 mm, a difference of 0.4mm or 5 pixels. Thus, measuring changes of 5 to 9 pixels with the 2D technique is easier and more accurate than 1 to 2 pixel difference seen in a 1D diameter analysis. Finally, pulsatile lumen expansion from 2D axial images was more easily measured with MR than with US. This was because the bright lumen signal seen in the gated-TOF MR images could be easily segmented, whereas with US, the lateral walls of the aorta in axial B-mode US images were difficult to visualize as they were parallel to the transducer. A bright lumen also made calculating the direction and magnitude of centroid motion easier.
Our strain measurements compare well with previously published results (24). Since the waveforms in Fig. 2 were similar, we used the maximum circumferential strain value as the salient feature for comparisons between aortic locations and genotypes. Most published US data report a linear definition of maximum strain (or percent change in aortic diameter), which neglects nonlinear contributions. A study looking at the ascending thoracic aorta in newborn mice found 15.5 ± 3.3% change in aortic diameter (35). Others measured linear strain in the abdominal aorta of WT mice to be 15.7 ± 2.5% (24). While linear strain is a useful metric, arteries clearly experience finite deformations in vivo, making nonlinear measures of strain more appropriate (30). The corresponding Green-Lagrange metric would be slightly higher, making our measurements [19.1% – 23.0%] comparable to previous work. Our technique also eliminates the need to assume a circular cross-section, something that is necessary when tracking only aortic diameter. Furthermore, previous imaging studies have shown the aorta expanding non-uniformly in humans and animals (19,20). Specifically in mice, anterior wall expansion of the abdominal aorta was more than 3 times larger than the posterior wall (24), confirming our results showing anterior expansion of the aorta below the renal arteries.
Developing advanced imaging and quantification techniques for murine vessel geometry and dynamics will help to increase our understanding of vascular diseases and will hopefully impact future work. Many different areas of cardiovascular research, all of which use small animal models, could benefit from these methods. First, atherosclerosis has been shown to increase lipid accumulation within the wall, promote smooth muscle cell migration into the intima, and stiffen arteries (36). While aortic PWV, a measure of overall arterial stiffness, has been shown to be elevated in mice prone to atherosclerosis (18), circumferential strain at multiple abdominal aortic locations has not been quantified. Thus, our methods could be applied to quantify circumferential strain as atherosclerosis develops with age or application of a high-fat diet. Second, increased vessel stiffness has also been shown to be a feature of diabetes in both humans and animal models (37). Murine aortic motion could be quantified before and after administration of streptozotocin, a chemical that induces pancreatic necrosis, in order to compare glucose levels to vessel strain as the vasculature stiffens. Third, a relationship between vascular development and motion could be investigated by assessing aortic dynamics in mice with elastin haploinsufficiency or Williams-Beuren syndrome (38), both of which are disorders that affect MLU formation. Finally, the presented techniques could also be used to measure changes in aortic strain after administration of therapeutics, such as statins, anti-hypertensive, and anti-inflammatory drugs.
The focus of this study was to develop methods that could eventually be applied to the quantification of AAA development in small animal models. Of particular interest is the motion and curvature of the aorta in the regions where vessel expansion occurs in murine AAA models. The high correlation factor (0.998) between the direction of SR motion (85.7 ± 10.3°) and aortic curvature above the renal arteries (82.0 ± 23.1°) suggests a close relationship between lumen expansion and curvature (Fig. 6C). The leftward direction for both of these metrics is of particular interest, as this is the exact location where leftward expansion appears in the angiotensin II induced aneurysms (Fig. 6D). This location and direction of aneurysm growth is consistent with previously published results concerning this model (5), where a focal dissection of the medial layer is the initial event observed in AAA formation (32). Thus, our data suggest that aortic curvature may influence the location of angiotensin-induced AAA formation, while the direction of curvature and lumen expansion may be a factor in where medial dissection occurs around the circumference and the amount of AAA expansion asymmetry. Future work will need to use a time-course study to track aneurysm development and compare the progression of angiotensin II induced AAAs with other murine models, including an intraluminal infusion of elastase into the infrarenal aorta (6). Furthermore, aortic stiffening is often associated with the pathological expansion that occurs in aneurysmal disease (39). Similar work assessing vascular stiffness and the pressure-strain elastic modulus could be done in murine AAA models if systolic and diastolic pressures were measured in combination with vessel motion.
This study is not without limitations. First, small vessels branching off or running close to the aorta (i.e. the superior mesenteric, celiac, and testicular arteries) necessitate manual segmentation of some images. While not ideal, our manual segmentations still followed a thresholding contour, with only a small portion corrected so as to not include nearby vessels. Second, our histology analysis showed more medial elastin at the SR level than the IR, but this increase was not significant due to the relatively large standard deviations (Figure 5B). This increase in elastin was expected as wall thickness and elastin content is correlated with arterial diameter (34). Increasing the number of animals may help reduce the variability between animals, but any advanced quantification of histology will include some intrinsic variability associated with the staining. Finally, we used mice from a range of ages in this study (24- to 41-weeks-old), possibly leading to varied amounts of atherosclerotic development. Previous work has shown that 13-month-old apoE−/− mice have extensive atherosclerotic lesions, covering 61 ± 4% of the vessel, greatly increasing pulse wave velocity and vascular stiffness (40). Yet, younger 4-month-old apoE−/− had only moderate atherosclerotic lesions (23 ± 5%) and no significant changes in vascular stiffness (40). Since we did not see a difference between WT and apoE−/− mice, we can conclude that either the atherosclerotic burden in apoE−/− mice was not great enough to affect aortic dynamics, or our methods are not sensitive enough to detect slight atherosclerotic induced increases in vascular stiffness at this age. Thus, future work could use the methods described here to image apoE−/− mice of vastly different ages and determine if and when atherosclerotic burden is great enough to affect cyclic strain and motion at specific locations along the aorta.
In conclusion, the methods presented in this study provide sensitive endpoints for quantifying vessel motion and geometry in murine models of human cardiovascular disease. The results of this study suggest a possible relationship between aortic curvature, the direction of lumen expansion, and aneurysm shape. Further work will need to utilize the methods presented here to quantify aortic lumen expansion during AAA progression and determine if the location of AAA formation in murine models is correlated with vessel curvature. Such studies will hopefully help elucidate biomechanical contributions to aneurysm disease.
Acknowledgments
The authors would like to acknowledge Guanglei Xiong for help with image conversion, Lean Duong for assistance processing MR data, and Prahallad Iyengar for help developing centroid calculation techniques.
Grant Support:
Funding provided by the National Institutes of Health (1 P50 HL 83800-04) and to C.J.G. by an American Heart Association Predoctoral Fellowship (0815293F).
References
- 1.Brady AR, Thompson SG, Fowkes FG, Greenhalgh RM, Powell JT. Abdominal aortic aneurysm expansion: risk factors and time intervals for surveillance. Circulation. 2004;110:16–21. doi: 10.1161/01.CIR.0000133279.07468.9F. [DOI] [PubMed] [Google Scholar]
- 2.Johnston KW, Rutherford RB, Tilson MD, Shah DM, Hollier L, Stanley JC. Suggested standards for reporting on arterial aneurysms. Subcommittee on Reporting Standards for Arterial Aneurysms, Ad Hoc Committee on Reporting Standards, Society for Vascular Surgery and North American Chapter, International Society for Cardiovascular Surgery. J Vasc Surg. 1991;13:452–458. doi: 10.1067/mva.1991.26737. [DOI] [PubMed] [Google Scholar]
- 3.Assar AN. Pharmacological therapy for patients with abdominal aortic aneurysm. Expert Rev Cardiovasc Ther. 2009;7:999–1009. doi: 10.1586/erc.09.56. [DOI] [PubMed] [Google Scholar]
- 4.Daugherty A, Cassis LA. Mouse models of abdominal aortic aneurysms. Arterioscler Thromb Vasc Biol. 2004;24:429–434. doi: 10.1161/01.ATV.0000118013.72016.ea. [DOI] [PubMed] [Google Scholar]
- 5.Daugherty A, Manning MW, Cassis LA. Angiotensin II promotes atherosclerotic lesions and aneurysms in apolipoprotein E-deficient mice. J Clin Invest. 2000;105:1605–1612. doi: 10.1172/JCI7818. [DOI] [PMC free article] [PubMed] [Google Scholar]
- 6.Pyo R, Lee JK, Shipley JM, et al. Targeted gene disruption of matrix metalloproteinase-9 (gelatinase B) suppresses development of experimental abdominal aortic aneurysms. J Clin Invest. 2000;105:1641–1649. doi: 10.1172/JCI8931. [DOI] [PMC free article] [PubMed] [Google Scholar]
- 7.Chiou AC, Chiu B, Pearce WH. Murine aortic aneurysm produced by periarterial application of calcium chloride. J Surg Res. 2001;99:371–376. doi: 10.1006/jsre.2001.6207. [DOI] [PubMed] [Google Scholar]
- 8.Daugherty A, Manning MW, Cassis LA. Antagonism of AT2 receptors augments angiotensin II-induced abdominal aortic aneurysms and atherosclerosis. Br J Pharmacol. 2001;134:865–870. doi: 10.1038/sj.bjp.0704331. [DOI] [PMC free article] [PubMed] [Google Scholar]
- 9.Bergoeing MP, Arif B, Hackmann AE, Ennis TL, Thompson RW, Curci JA. Cigarette smoking increases aortic dilatation without affecting matrix metalloproteinase-9 and -12 expression in a modified mouse model of aneurysm formation. J Vasc Surg. 2007;45:1217–1227. doi: 10.1016/j.jvs.2007.01.058. [DOI] [PubMed] [Google Scholar]
- 10.Sho E, Sho M, Nanjo H, Kawamura K, Masuda H, Dalman RL. Hemodynamic regulation of CD34+ cell localization and differentiation in experimental aneurysms. Arterioscler Thromb Vasc Biol. 2004;24:1916–1921. doi: 10.1161/01.ATV.0000142805.20398.74. [DOI] [PubMed] [Google Scholar]
- 11.Barisione C, Charnigo R, Howatt DA, Moorleghen JJ, Rateri DL, Daugherty A. Rapid dilation of the abdominal aorta during infusion of angiotensin II detected by noninvasive high-frequency ultrasonography. J Vasc Surg. 2006;44:372–376. doi: 10.1016/j.jvs.2006.04.047. [DOI] [PubMed] [Google Scholar]
- 12.Chiou AC, Chiu B, Oppat WF, Matsumura JS, Chisholm RL, Pearce WH. Transrectal ultrasound assessment of murine aorta and iliac arteries. J Surg Res. 2000;88:193–199. doi: 10.1006/jsre.1999.5790. [DOI] [PubMed] [Google Scholar]
- 13.Knipp BS, Ailawadi G, Sullivan VV, et al. Ultrasound measurement of aortic diameters in rodent models of aneurysm disease. J Surg Res. 2003;112:97–101. doi: 10.1016/s0022-4804(03)00114-8. [DOI] [PubMed] [Google Scholar]
- 14.Martin-McNulty B, Vincelette J, Vergona R, Sullivan ME, Wang YX. Noninvasive measurement of abdominal aortic aneurysms in intact mice by a high-frequency ultrasound imaging system. Ultrasound Med Biol. 2005;31:745–749. doi: 10.1016/j.ultrasmedbio.2005.02.012. [DOI] [PubMed] [Google Scholar]
- 15.McFadden EP, Chaabane L, Contard F, et al. In vivo magnetic resonance imaging of large spontaneous aortic aneurysms in old apolipoprotein E-deficient mice. Invest Radiol. 2004;39:585–590. doi: 10.1097/01.rli.0000138089.98165.88. [DOI] [PubMed] [Google Scholar]
- 16.Turner GH, Olzinski AR, Bernard RE, et al. In vivo serial assessment of aortic aneurysm formation in apolipoprotein E-deficient mice via MRI. Circ Cardiovasc Imaging. 2008;1:220–226. doi: 10.1161/CIRCIMAGING.108.787358. [DOI] [PubMed] [Google Scholar]
- 17.Tropea BI, Schwarzacher SP, Chang A, et al. Reduction of aortic wall motion inhibits hypertension-mediated experimental atherosclerosis. Arterioscler Thromb Vasc Biol. 2000;20:2127–2133. doi: 10.1161/01.atv.20.9.2127. [DOI] [PubMed] [Google Scholar]
- 18.Hartley CJ, Reddy AK, Madala S, et al. Hemodynamic changes in apolipoprotein E-knockout mice. Am J Physiol Heart Circ Physiol. 2000;279:H2326–H2334. doi: 10.1152/ajpheart.2000.279.5.H2326. [DOI] [PubMed] [Google Scholar]
- 19.Draney MT, Arko FR, Alley MT, et al. Quantification of vessel wall motion and cyclic strain using cine phase contrast MRI: in vivo validation in the porcine aorta. Magn Reson Med. 2004;52:286–295. doi: 10.1002/mrm.20137. [DOI] [PubMed] [Google Scholar]
- 20.Draney MT, Herfkens RJ, Hughes TJ, et al. Quantification of vessel wall cyclic strain using cine phase contrast magnetic resonance imaging. Ann Biomed Eng. 2002;30:1033–1045. doi: 10.1114/1.1513566. [DOI] [PubMed] [Google Scholar]
- 21.Malina M, Lanne T, Ivancev K, Lindblad B, Brunkwall J. Reduced pulsatile wall motion of abdominal aortic aneurysms after endovascular repair. J Vasc Surg. 1998;27:624–631. doi: 10.1016/s0741-5214(98)70226-5. [DOI] [PubMed] [Google Scholar]
- 22.Morrison TM, Choi G, Zarins CK, Taylor CA. Circumferential and longitudinal cyclic strain of the human thoracic aorta: age-related changes. J Vasc Surg. 2009;49:1029–1036. doi: 10.1016/j.jvs.2008.11.056. [DOI] [PMC free article] [PubMed] [Google Scholar]
- 23.van Herwaarden JA, Muhs BE, Vincken KL, et al. Aortic compliance following EVAR and the influence of different endografts: determination using dynamic MRA. J Endovasc Ther. 2006;13:406–414. doi: 10.1583/06-1848.1. [DOI] [PubMed] [Google Scholar]
- 24.Goergen CJ, Johnson BL, Greve JM, Taylor CA, Zarins CK. Increased anterior abdominal aortic wall motion: possible role in aneurysm pathogenesis and design of endovascular devices. J Endovasc Ther. 2007;14:574–584. doi: 10.1177/152660280701400421. [DOI] [PubMed] [Google Scholar]
- 25.Vorp DA. Biomechanics of abdominal aortic aneurysm. J Biomech. 2007;40:1887–1902. doi: 10.1016/j.jbiomech.2006.09.003. [DOI] [PMC free article] [PubMed] [Google Scholar]
- 26.Doyle BJ, Callanan A, Burke PE, et al. Vessel asymmetry as an additional diagnostic tool in the assessment of abdominal aortic aneurysms. J Vasc Surg. 2009;49:443–454. doi: 10.1016/j.jvs.2008.08.064. [DOI] [PMC free article] [PubMed] [Google Scholar]
- 27.Vande Geest JP, Schmidt DE, Sacks MS, Vorp DA. The effects of anisotropy on the stress analyses of patient-specific abdominal aortic aneurysms. Ann Biomed Eng. 2008;36:921–932. doi: 10.1007/s10439-008-9490-3. [DOI] [PMC free article] [PubMed] [Google Scholar]
- 28.Vorp DA, Raghavan ML, Webster MW. Mechanical wall stress in abdominal aortic aneurysm: influence of diameter and asymmetry. J Vasc Surg. 1998;27:632–639. doi: 10.1016/s0741-5214(98)70227-7. [DOI] [PubMed] [Google Scholar]
- 29.Wilson N, Wang K, Dutton R, Taylor C. Lecture Notes in Computer Science: A software framework for creating patient specific geometric models from medical imaging data for simulation based medical planning of vascular surgery. 2001;2208:449–456. [Google Scholar]
- 30.Humphrey JD, Delange SL. An Introduction to Biomechanics: Solids and Fluids, Analysis and Design. New York: Springer-Verlag; 2004. p. 631. [Google Scholar]
- 31.Choi G, Cheng CP, Wilson NM, Taylor CA. Methods for quantifying three-dimensional deformation of arteries due to pulsatile and nonpulsatile forces: implications for the design of stents and stent grafts. Ann Biomed Eng. 2009;37:14–33. doi: 10.1007/s10439-008-9590-0. [DOI] [PubMed] [Google Scholar]
- 32.Saraff K, Babamusta F, Cassis LA, Daugherty A. Aortic dissection precedes formation of aneurysms and atherosclerosis in angiotensin II-infused, apolipoprotein E-deficient mice. Arterioscler Thromb Vasc Biol. 2003;23:1621–1626. doi: 10.1161/01.ATV.0000085631.76095.64. [DOI] [PubMed] [Google Scholar]
- 33.van Dijk KW, Hofker MH, Havekes LM. Dissection of the complex role of apolipoprotein E in lipoprotein metabolism and atherosclerosis using mouse models. Curr Atheroscler Rep. 1999;1:101–107. doi: 10.1007/s11883-999-0005-y. [DOI] [PubMed] [Google Scholar]
- 34.Wolinsky H, Glagov S. Comparison of abdominal and thoracic aortic medial structure in mammals. Deviation of man from the usual pattern. Circ Res. 1969;25:677–686. doi: 10.1161/01.res.25.6.677. [DOI] [PubMed] [Google Scholar]
- 35.Wagenseil JE, Ciliberto CH, Knutsen RH, Levy MA, Kovacs A, Mecham RP. Reduced vessel elasticity alters cardiovascular structure and function in newborn mice. Circ Res. 2009;104:1217–1224. doi: 10.1161/CIRCRESAHA.108.192054. [DOI] [PMC free article] [PubMed] [Google Scholar]
- 36.Duprez DA, Cohn JN. Arterial stiffness as a risk factor for coronary atherosclerosis. Curr Atheroscler Rep. 2007;9:139–144. doi: 10.1007/s11883-007-0010-y. [DOI] [PubMed] [Google Scholar]
- 37.Sista AK, O'Connell MK, Hinohara T, et al. Increased aortic stiffness in the insulin-resistant Zucker fa/fa rat. Am J Physiol Heart Circ Physiol. 2005;289:H845–H851. doi: 10.1152/ajpheart.00134.2005. [DOI] [PubMed] [Google Scholar]
- 38.Li HH, Roy M, Kuscuoglu U, et al. Induced chromosome deletions cause hypersociability and other features of Williams–Beuren syndrome in mice. EMBO Mol Med. 2009;1:50–65. doi: 10.1002/emmm.200900003. [DOI] [PMC free article] [PubMed] [Google Scholar]
- 39.Long A, Rouet L, Bissery A, Rossignol P, Mouradian D, Sapoval M. Compliance of abdominal aortic aneurysms: evaluation of tissue Doppler imaging. Ultrasound Med Biol. 2004;30:1099–1108. doi: 10.1016/j.ultrasmedbio.2004.08.007. [DOI] [PubMed] [Google Scholar]
- 40.Wang YX, Halks-Miller M, Vergona R, et al. Increased aortic stiffness assessed by pulse wave velocity in apolipoprotein E-deficient mice. Am J Physiol Heart Circ Physiol. 2000;278:H428–H434. doi: 10.1152/ajpheart.2000.278.2.H428. [DOI] [PubMed] [Google Scholar]