Abstract
Purpose
To present a semi-automatic deformable registration algorithm for co-registering T2-weighted (T2w) images of the prostate with whole-mount pathological sections of prostatectomy specimens.
Materials and Methods
Twenty-four patients underwent 1.5-T endorectal MR imaging before radical prostatectomy with whole-mount step-section pathologic analysis of surgical specimens. For each patient, the T2w imaging containing the largest area of tumor was manually matched with the corresponding pathologic slice. The prostate was co-registered using a free form deformation (FFD) algorithm based on B-splines. Registration quality was assessed through differences between prostate diameters measured in right-left (RL) and anteroposterior (AP) directions on T2w images and pathologic slices and calculation of the Dice similarity coefficient, D, for the whole prostate (WP), the peripheral zone (PZ) and the transition zone (TZ).
Results
The mean differences in diameters measured on pathology and MR imaging in the RL direction and the AP direction were 0.49 cm and -0.63 cm, respectively, before registration and 0.10 cm and -0.11 cm, respectively, after registration. The mean D values for the WP, PZ and TZ, were 0.76, 0.65, and 0.77, respectively, before registration and increased to 0.91, 0.76, and 0.85, respectively, after registration. The improvements in D were significant for all three tissues (P < 0.001 for all).
Conclusion
The proposed semi-automatic method enabled successful co-registration of anatomical prostate MR images to pathologic slices.
Keywords: prostate MR imaging, index tumor, deformable registration, step-section pathologic slides, Dice similarity coefficient
INTRODUCTION
Magnetic resonance imaging (MRI) provides exquisitely detailed images of the anatomy of the prostate and is the most sensitive imaging modality available for the detection and local staging of prostate cancer. As a result, MRI is increasingly being used to aid in the various phases of prostate cancer care, from diagnosis to treatment selection to treatment planning and follow-up. The addition of functional and metabolic MRI techniques, such as diffusion-weighted imaging (DWI), dynamic contrast-enhanced MRI (DCE-MRI), and 1H magnetic resonance spectroscopic imaging (1H-MRSI), to conventional MRI can improve prostate cancer detection (1) and staging (2) and provide a better estimate of tumor volume (3-4). Validation of anatomical and functional MRI findings in clinical research requires correlation with surgical pathology, the most reliable reference standard available.
For optimal MR imaging of prostate cancer, an endorectal coil must be used in conjunction with a pelvic phased-array coil (5). However, since the endorectal coil introduces considerable deformation of the prostate and surrounding tissues, the registration of endorectal MR images with pathological sections is especially challenging. Heijmink et al (6) found that insertion of the endorectal coil changed the prostate diameter by 5.5 mm (15.7%) in the anteroposterior direction, 3.5 mm (7.7%) in the right-to-left direction, and 2.2 mm (6.3%) in the craniocaudal direction. Deformation also occurs when the prostate is surgically removed and during the subsequent fixation with formalin injection. Jonmarker et al reported that tissue shrinkage during histological processing caused a decrease of 4.5% in transverse diameters, corresponding to a 15% reduction of volume (7).
Registration of histopathological data to imaging has been explored by a number of investigators. Bardinet et al registered histopathological and post mortem MR data from a cadaver's head by applying a block matching algorithm to perform rigid transformation (8). Mega et al (9) co-registered stained whole-brain sections obtained after death to pre-mortem PET images using a 3D elastic warping algorithm (10) in a patient with Alzheimer's disease to investigate the relationship between neurofibrillary tangle (NFT) staining density and hypometabolism on FDG-PET. Several studies have examined the use of thin-plate splines (TPS) (11) for medical image analysis, including registration of histopathologic and MR images (12-16). TPS is a non-linear warping algorithm based on the direct registration of corresponding landmark points in two image datasets using a multidimensional interpolation method. The registration transformation function transforms the landmarks in one image to the corresponding landmarks in the other and all other points in the image are smoothly interpolated. TPS requires manual selection of control points, although an automatic placement technique that is more efficient and reduces operator bias has been presented (14). A limitation of the TPS method is that each control point influences the whole image. Consequently, if the control points are not well distributed over the image, the TPS method will be less effective in describing local deformations and may cause deformations in regions where no changes are required. Recently, a method based on elastic multimodal registration of MR images to histology was used to evaluate in vivo MR findings (17)
Kybic, et al. used cubic Basis-splines (B-splines) to correct for distortion in echo planar MR brain images and for the registration of MR, SPECT, and CT images of the brain and heart (18). Rueckert, et al. used a free-form deformation (FFD) based on B-splines in combination with a voxel intensity similarity measurement to register dynamic contrast-enhanced MR breast images (19). With B-splines, unlike TPS or elastic-body splines, the translation of a point is only determined by the area immediately surrounding the control points, resulting in locally controlled transformation. As the deformations caused by an endorectal coil are spatially localized, locally controlled transformation would be advantageous for registering endorectal MR images and would result in smooth transformation fields. In addition, the use of an FFD algorithm based on B-splines is computationally efficient even for a large number of control points.
The purpose of this work is to present a semi-automatic image registration algorithm based on the B-splines method described by Rueckert et al (19) and to assess the accuracy of this algorithm for co-registering the T2-weighted (T2w) endorectal MR image containing the largest area of tumor with the corresponding whole-mount pathological slice of the prostate.
MATERIALS AND METHODS
MR Imaging
Our institutional review board waived the requirement for informed consent for this retrospective study, which was compliant with the Health Insurance Portability and Accountability Act. Twenty-four patients with biopsy-proven prostate cancer who were scheduled for prostatectomy and underwent imaging on a 1.5-T whole-body MRI unit (GE Medical Systems, Milwaukee, WI) were selected. A body coil was used for excitation, and a pelvic four-channel phased-array coil combined with a commercially available balloon-covered expandable endorectal coil (Medrad, Pittsburgh, PA) was used for signal reception. The MR images of the prostate included transverse T2w fast spin-echo images (TR, 4000-6000 ms; effective TE, 96-120 ms; echo train length, 12-16; matrix 256 × 192; field of view, 14 × 14 cm2; slice thickness, 3 mm; no inter-slice gap).
Histopathological Analysis
After surgery, the prostate and the seminal vesicles were step-sectioned into 3–5-mm contiguous slices in the transverse plane. The specimens were fixed overnight in 10% buffered formalin, embedded in paraffin, and stained with haematoxylin and eosin (20). The cancer foci were outlined in color inks by a pathologist to denote Gleason score (Gleason grade ≤ 3, green; Gleason grade 4 or 5, black), as well as the presence of extraprostatic extension (blue) and positive margins (red). The whole-mount slides were then digitally scanned.
Image Registration
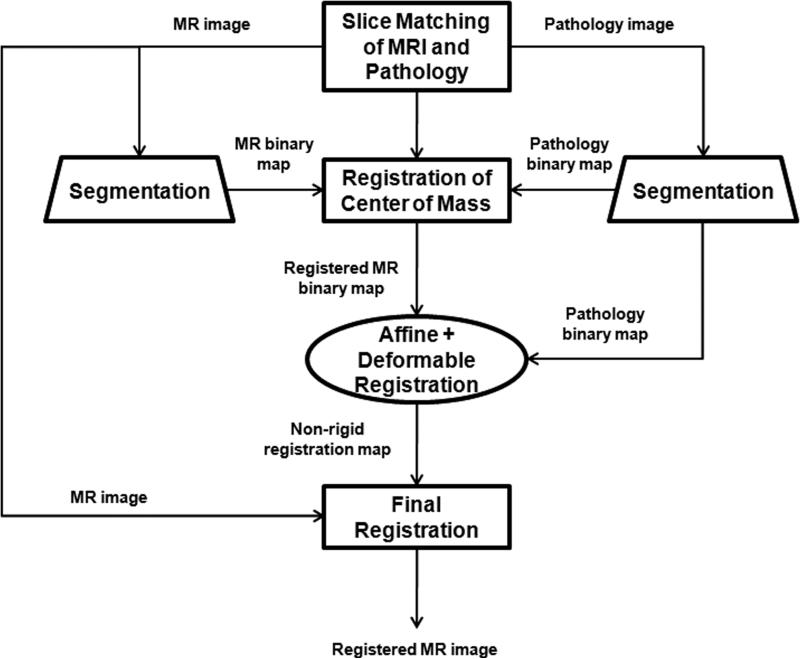
The image registration was performed in five steps (Fig. 1):
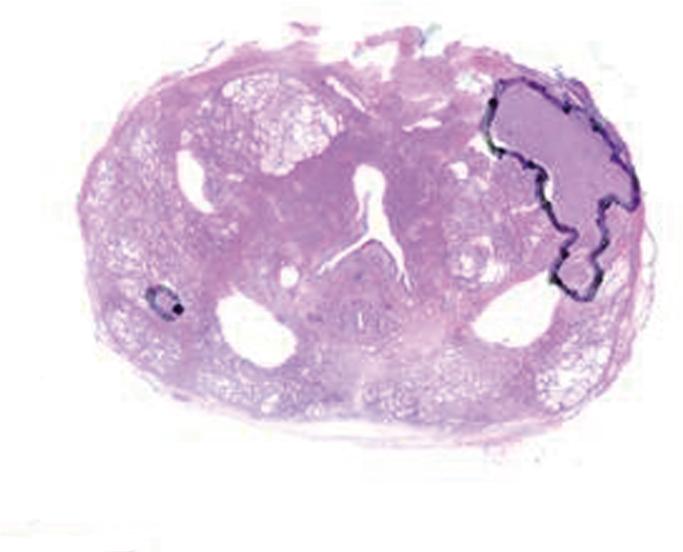
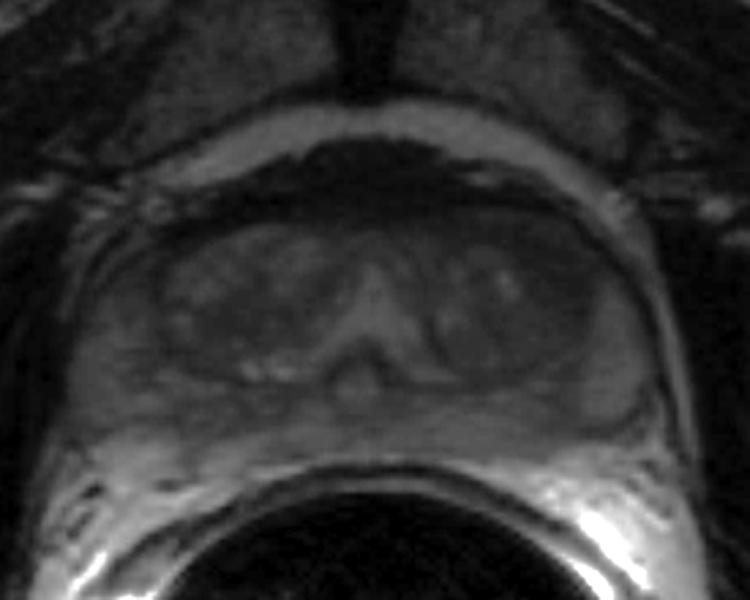
The digitized images of the pathologic slices (Fig. 2a) were matched with the corresponding axial T2w images (Fig. 2b) by a radiologist who selected images and slides according to their level in the prostate. One T2w image and pathologic slice pair containing the largest area of tumor was selected for each patient. The matching was done on the basis of anatomical landmarks, such as the presence of urinary bladder and seminal vesicles in superior MR images, progressive changes in the diameter of the prostate on both MR images and pathology slices, the image and slide with the largest prostate diameter, the thickness of the peripheral zone, the position of the pseudocapsule, and the presence, size, and shape of the transition zone. It is important to recognize that choosing an MR image that corresponds to a pathologic slice is allowed only if we assume that the MR images and the pathologic slices are in the same z-plane and free of any rotation or non-uniform deformation in the z-direction.
The prostate was manually segmented from the background on the images of pathologic slices (Fig. 2c) and from surrounding tissues on T2w images (Fig. 2d). The segmentation map was then used to create a pair of binary maps with the pixel values of the prostate region set to true and those outside the prostate set to false.
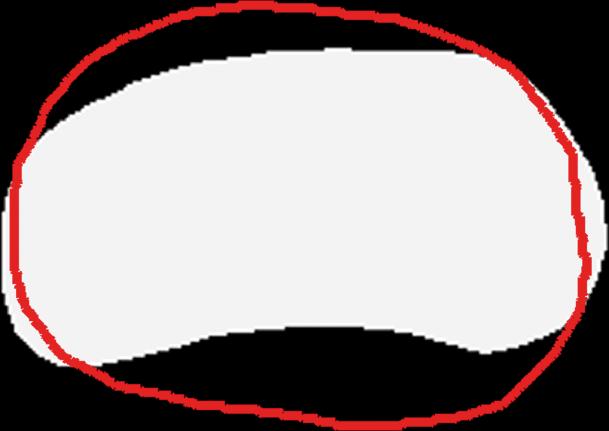
The centers of mass of the two binary maps were registered using rigid registration (Fig. 2e).
The T2w image (floating image) was registered to the pathological slice (reference image) using first affine registration (Fig. 2f) followed by 2D deformable registration (Fig. 2g) as described in the Image Registration Algorithm section, and a transformation map was created.
5. The transformation map was applied to the T2w image to yield a co-registered image.
Figure 1.
The registration method for co-registering T2w images to corresponding pathologic slices.
Figure 2.
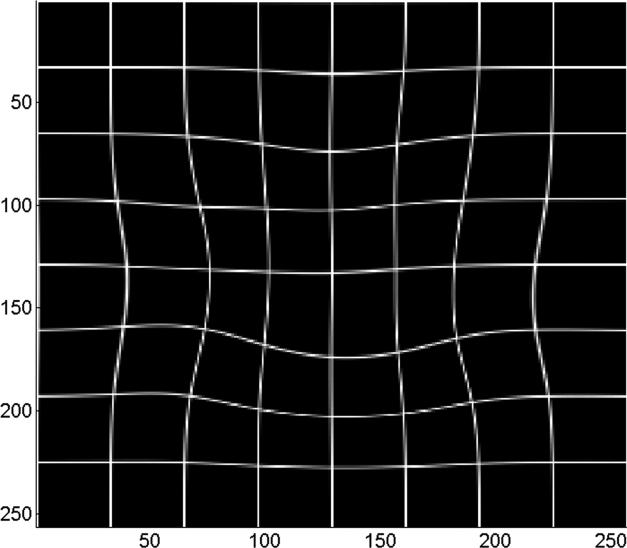
(a) Digital image of the pathologic slice; (b) corresponding T2w image; (c) binary mask for manually segmented prostate on pathologic slice in (a); (d) binary mask for manually segmented prostate on T2w image in (b). (e) The perimeter of the prostate from the pathologic slice is overlaid on the T2w image after the centers of mass of the image and pathologic slice were registered using rigid registration; (f) the binary masks are globally aligned using affine registration. The perimeter of the prostate from the pathologic slice is overlaid on the image; (g) deformable registration of the T2w image binary mask following affine registration.(h) Deformed 7 × 7 grid of control points. In areas where the transformation requires significant change, the deformation is large, whereas in other areas where a lot of deformation is not required the deformation is smaller.
Image Registration Algorithm
The first step is to pre-register the centers of mass of the floating and reference images using rigid registration. The second step is for the images to be registered with affine registration, followed by 2D deformable registration. Our affine transformation in 2D has 7 degrees of freedom (dof). Specifically the 7 transformations consist of translations in the x and y directions (2), rotation clockwise about the origin (1), scaling in the x and y directions (2), and shearing in the xy and yx planes (2).
Deformable co-registration of a two-dimensional (2D) floating image, F, to a reference image, R. was based on the FFD cubic B-splines method described by Rueckert et al (19). B-spline FFDs are non-rigid transformations that manipulate a 2D regularly spaced grid (mesh) of control points, Φ . The transformation of a point (x, y) in the image F to the corresponding point (x′, y′) in the image R is given by the transformation map T(x, y) → (x′, y′) :
| [1] |
The control points, ϕij, are separated by spacings δx and δy in the x and y directions, respectively; are the indices of the control point cell containing the point, (x, y) ; and (u, v) is the relative position of point (x, y) inside that cell (i.e., where square brackets denote rounding to the nearest integer). The basis functions of the cubic B-splines, Bl (l = 0,1,2,3) , are given by the third order polynomials:
| [2A] |
| [2B] |
| [2C] |
| [2D] |
Thus, for any point of the floating image, the transformation T is computed from the positions of the surrounding 4 × 4 control points. Hence, changing the control points ϕij affects the transformation only in the local 4δx × 4δy area surrounding that control point.
Registration is achieved by finding a set of control points that minimizes the cost function, which was defined as the sum of the similarity term and a smoothness penalty term introduced to emulate realistic tissue deformations:
| [3] |
Here λ is an empirically determined coefficient that controls the degree of smoothing. The similarity measure Csimilarity expresses the error in alignment of the two images as the sum of squared differences between the voxel signal intensities of the reference image and the transformed floating image, IR and ITF , respectively:
| [4] |
where X × Y is the matrix size. The smoothness penalty term is defined as the bending energy of a thin two-dimensional sheet of metal, as first proposed by Wahba (21) and used by Rueckert et al (19):
| [5] |
Here V is the volume of the image domain. The minimum of the cost function is found by a multidimensional optimization method, such as the quasi-Newton method used here, and the resulting transformation map is applied to the floating image.
Image Analysis
The deformable registration algorithms presented here were implemented in Matlab (version 6.1, Mathworks, Natick, MA). The initial smoothing of the reference image was performed with a Gaussian filter with a symmetric kernel size of 3 × 3 voxels and standard deviation of 0.5 voxel. For a 7 × 7 grid with cell size of 35 × 35 voxels, the convergence of registration was achieved in approximately 40 iterations. The processing time for non-rigid registration was 2-3 minutes for each image/pathologic slice pair.
Assessment of Registration Accuracy
Additional image analysis was performed in ImageJ (version 1.37a; National Institutes of Health, Bethesda, MD). On each image/pathologic slice pair, the whole prostate (WP), the peripheral zone (PZ), and the transition zone (TZ) were outlined by an experienced radiologist. The maximum prostate dimensions (diameters) in the right-left (RL) and anteroposterior (AP) directions were measured on the T2w image before and after registration and on the pathological slice. The differences between prostate dimensions on MR and pathology were calculated before and after registration and expressed as percentages of the corresponding pathological dimensions and displayed on Bland-Altman plots. Changes in measured quantities after registration were compared using a non-parametric Wilcoxon's test for paired samples, and p ≤ 0.05 was considered statistically significant.
The accuracy of registration was also assessed using the Dice similarity coefficient (22-23):
| [6] |
where a is the number of voxels shared by the floating image and the reference image, and b and c are the number of voxels unique to the floating and reference images, respectively. D was calculated in Matlab for each patient's WP, PZ and TZ before and after registration. Following registration of the centers of mass of the MR image and pathologic slice, the Dice similarity coefficent was calculated. Bland-Altman plots were created to graphically represent the relationship between the MR prostate diameters in the RL and AP directions measured before and after registration and the true pathologic diameters (24).
RESULTS
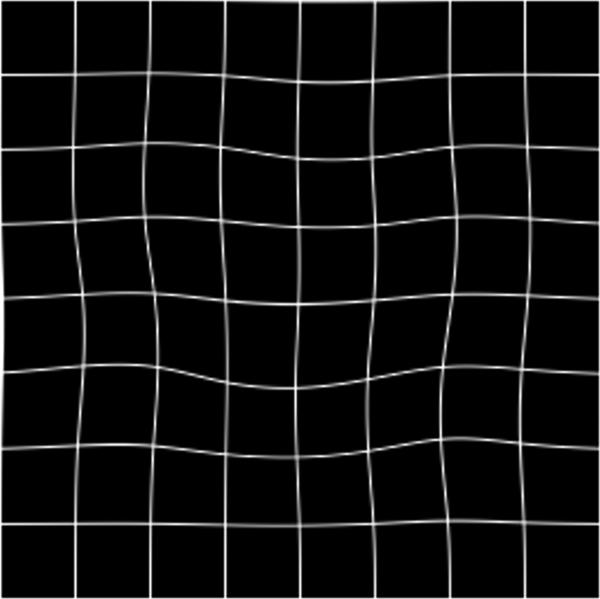
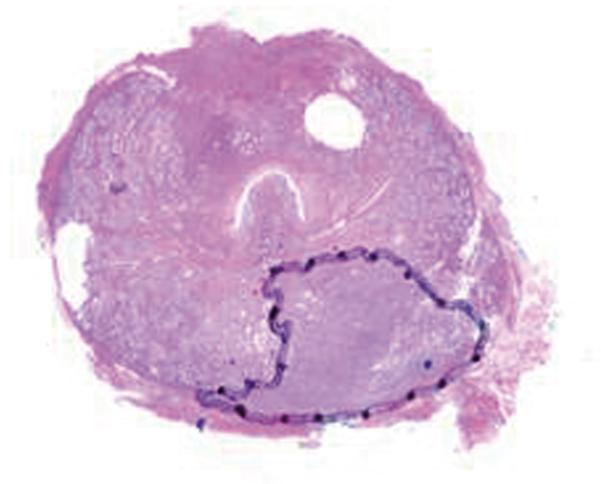
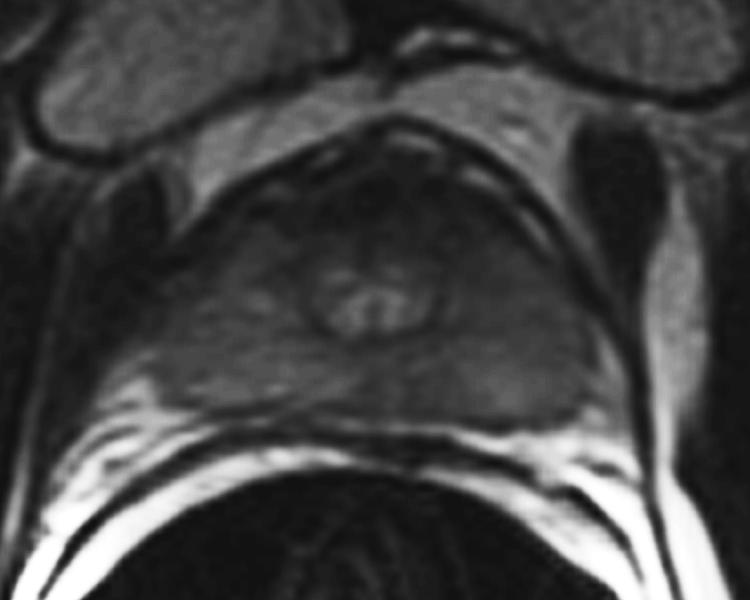
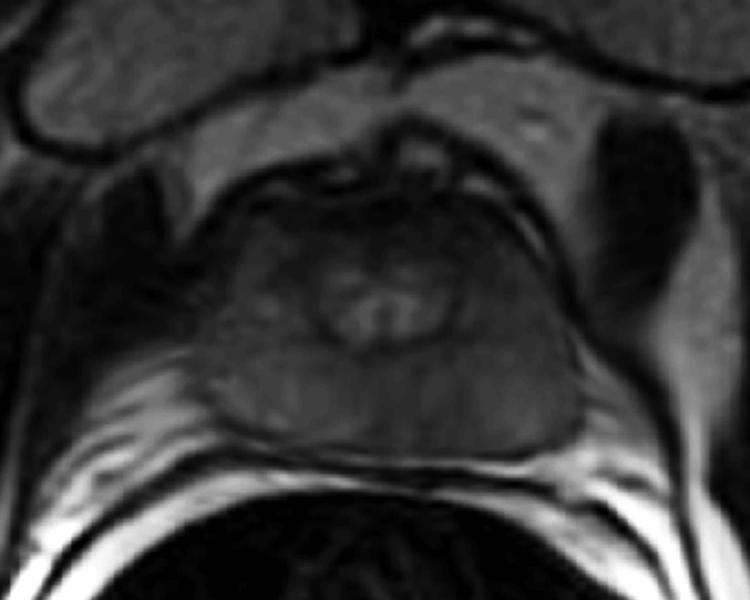
Fig. 3 illustrates the co-registration of an T2w image with the corresponding pathologic slice. The mean diameters in the RL direction on pathology maps, on MR images before registration, and on MR images after registration were 2.95 cm, 2.80 cm, and 2.83 cm, respectively. The mean diameters in the AP direction on pathology, on MR images before registration, and on MR images after registration were 2.36 cm, 1.83 cm, and 2.30 cm, respectively. The D values for WP, PZ and TZ were 0.86, 0.65, and 0.89, respectively, before registration and increased after registration to 0.99, 0.89, and 0.97, respectively.
Figure 3.
Co-registration of 2D MR image and a pathology slice. (a) Pathology slice with the tumor (Gleason score ≥ 4) outlined by a black line; (b) corresponding T2w image before registration; (c) T2w image shown in (b) after registration; (d) deformable registration map visualized by deformation of a regular 7 × 7 grid with each cell containing 35 × 35 voxels.
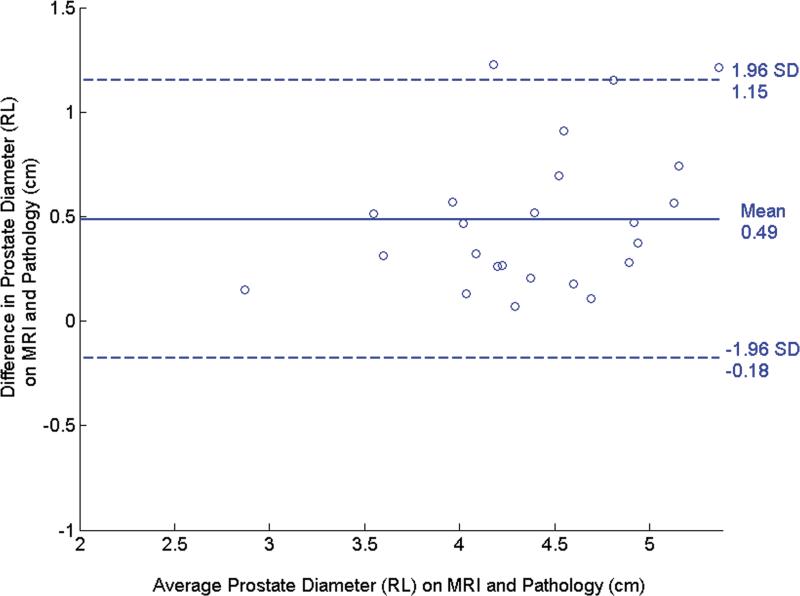
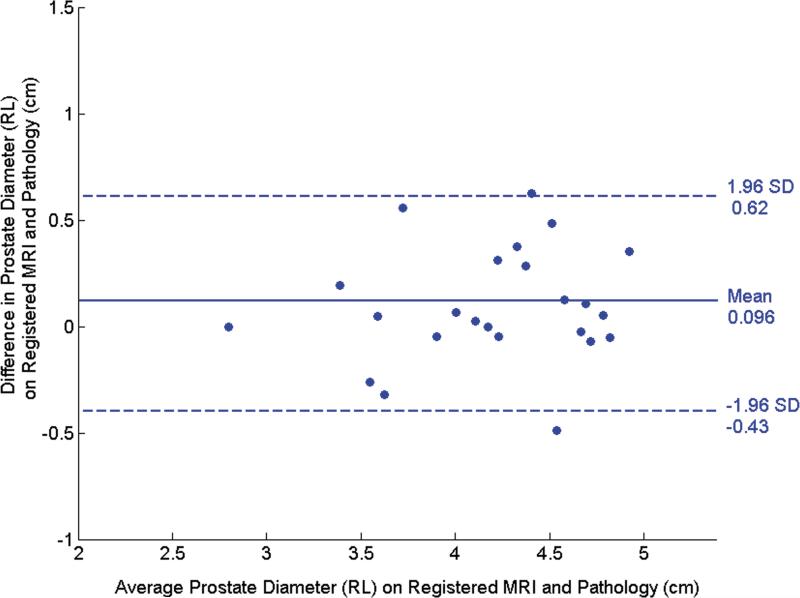
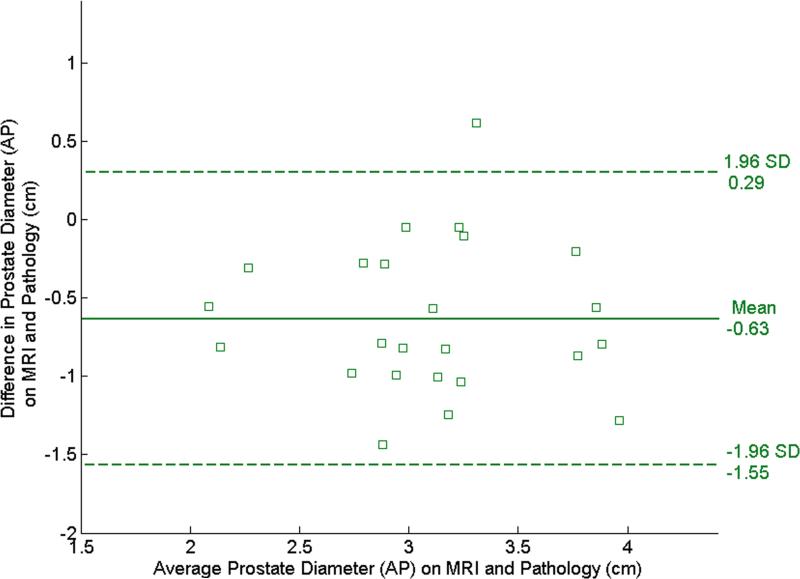
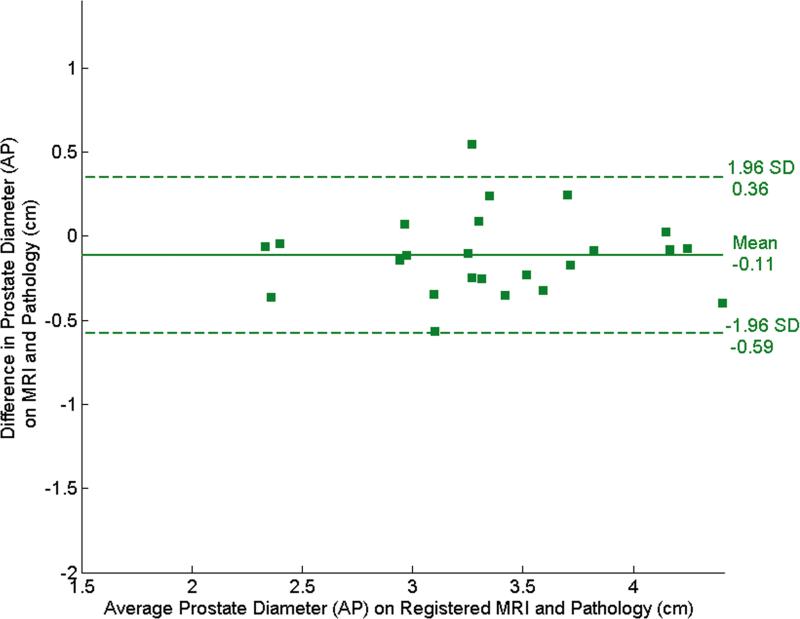
The Bland-Altman plots in Fig. 4 illustrate the agreement between the pre- and post-registration dimensions on MR and pathological images. In the RL direction, the mean difference (mean+1.96 std. dev., mean-1.96 std. dev.) was 0.49 (1.15, -0.18) cm before registration (Fig. 4a) and decreased to 0.096 (0.62,-0.43) cm after registration (Fig. 4b). In the AP direction, the mean difference was -0.63 (0.29,-1.55) cm (Fig. 4c) before registration and became -0.11 (0.36,-0.59) cm after registration (Fig. 4d). The decrease in the diameter difference after registration was significant in both the RL direction and the AP direction (P < 0.001 for both directions). Before registration, RL diameters on MR images were consistently larger than those on pathology and AP diameters are consistently smaller. This suggests that the endorectal coil causes lateral expansion and anteroposterior compression of the prostate.
Figure 4.
Bland-Altman plots show agreement between tumor diameter measurements made with pathology and MRI before and after registration. (a) and (b) show agreement for measurements from pre- and post- MR images in the RL direction, and (c) and (d) show agreement for corresponding measurements made from pre- and post-registration MR images in the AP direction. In each plot, the solid horizontal line corresponds to the mean difference and the dashed horizontal lines correspond to the mean±1.96SD differences between the prostate diameter measured on imaging and the diameter measured on the pathologic slices.
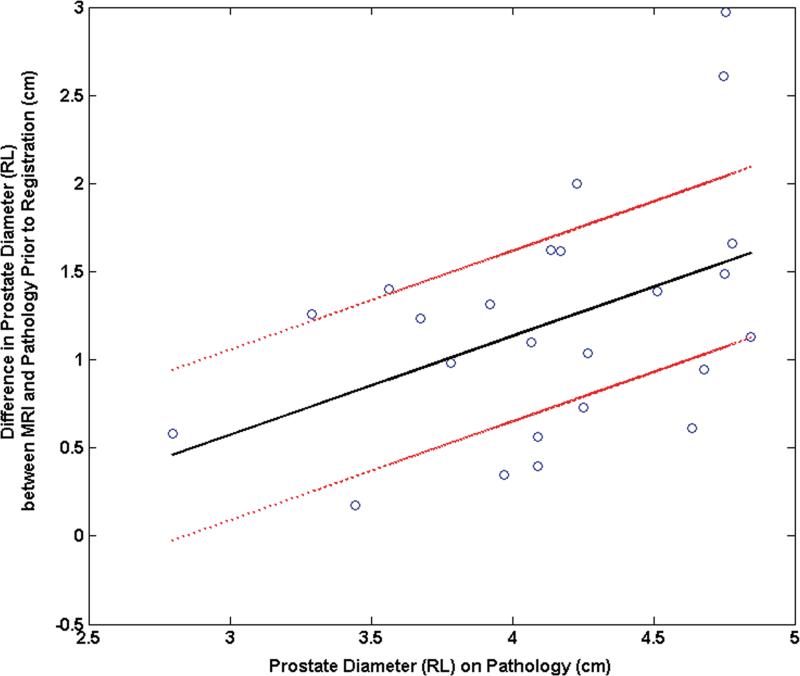
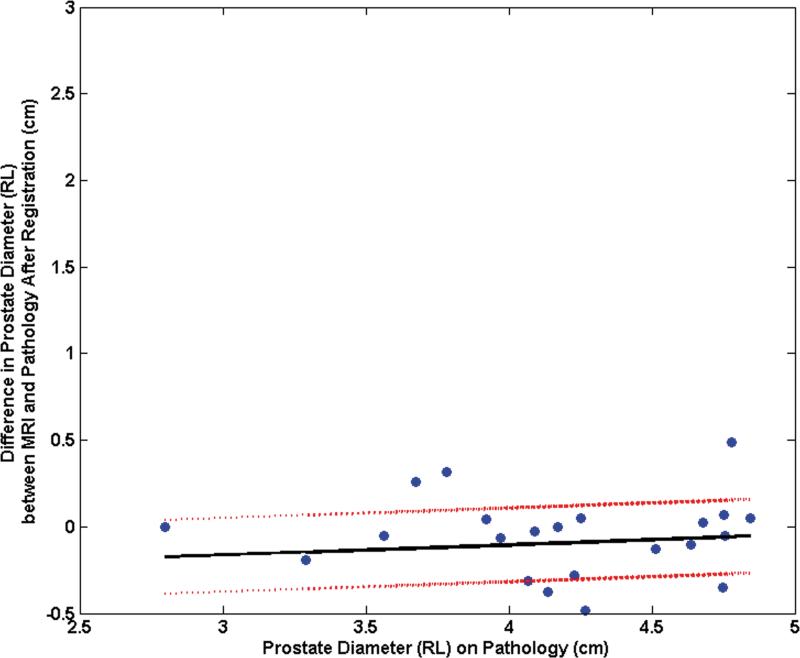
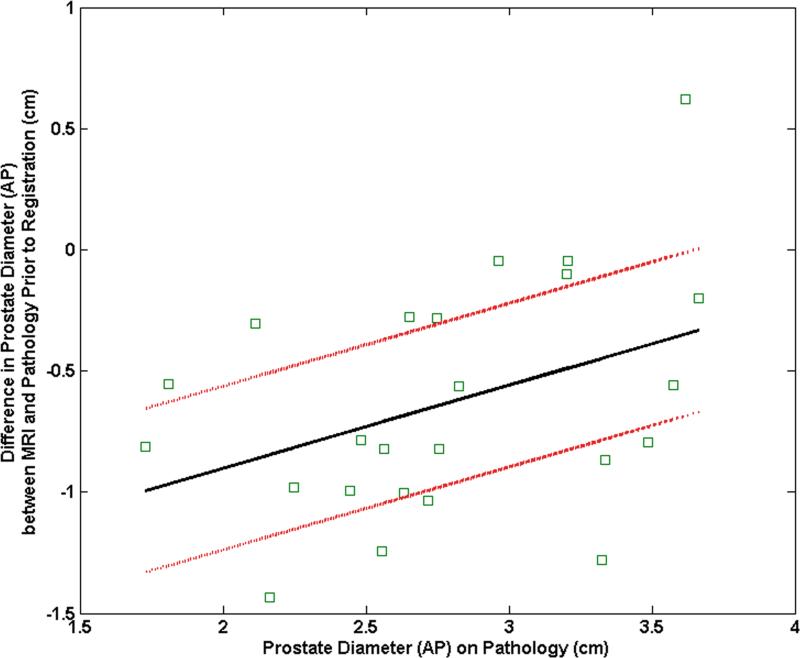
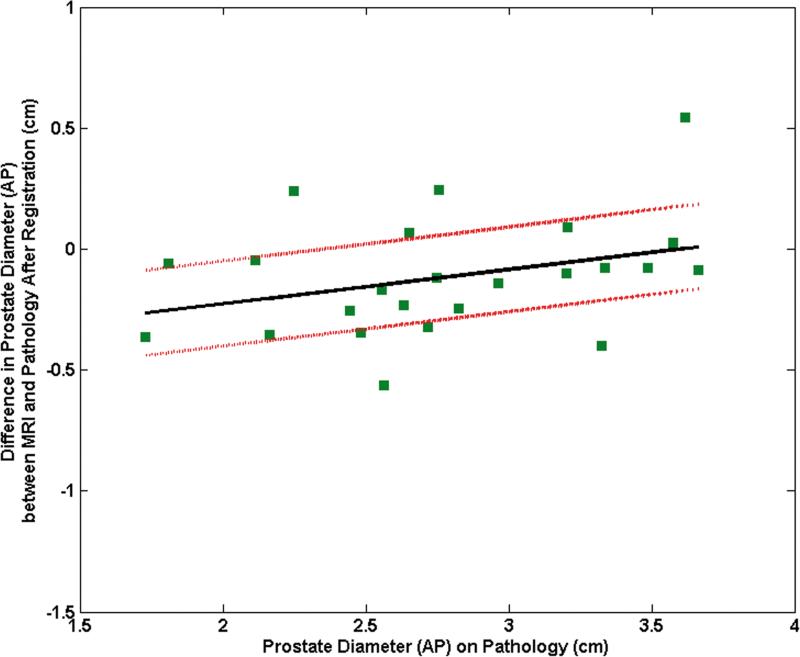
The mean difference between the RL diameters on MRI and pathology was 11.9% (range: 34.5%, 1.7%) before registration and decreased to 2.4% (range: 16.2%, - 10.2%) after registration. The mean difference between the AP diameters on MRI and pathology was -18.0% (range: 20.7%,-39.9%) before registration and became -3.2% (range: 18.1%, -16.7%) after registration. The pre-registration difference in RL diameters correlated significantly with the RL diameter on pathology (correlation coefficient = 0.44, p = 0.03) (Fig. 5a). After registration, this correlation was no longer significant (correlation coefficient = 0.12, p = 0.58) (Fig. 5b). Similarly the difference in pre-registered AP diameters correlated significantly with the AP diameter on pathology (correlation coefficient = 0.40, p = 0.05) (Fig. 5c). After registration, this correlation was no longer significant (correlation coefficient = 0.33, p = 0.12) (Fig. 5d).
Figure 5.
Plot of the mean difference in the RL direction between MRI and pathology (a) prior to registration and (b) after registration as a function of the prostate diameter measured on pathology. Plot of the mean difference mean difference in the AP direction between MRI and pathology (c) prior to registration and (d) after registration as a function of the prostate diameter measured on pathology.
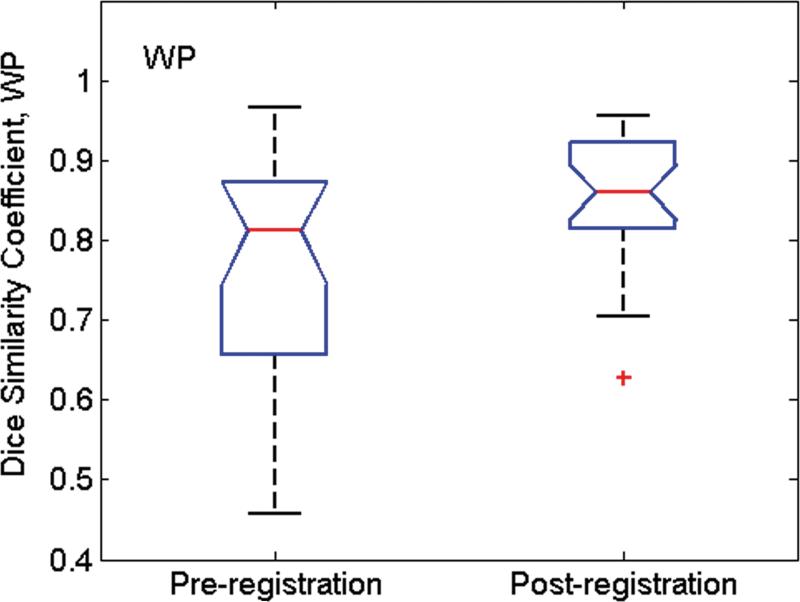
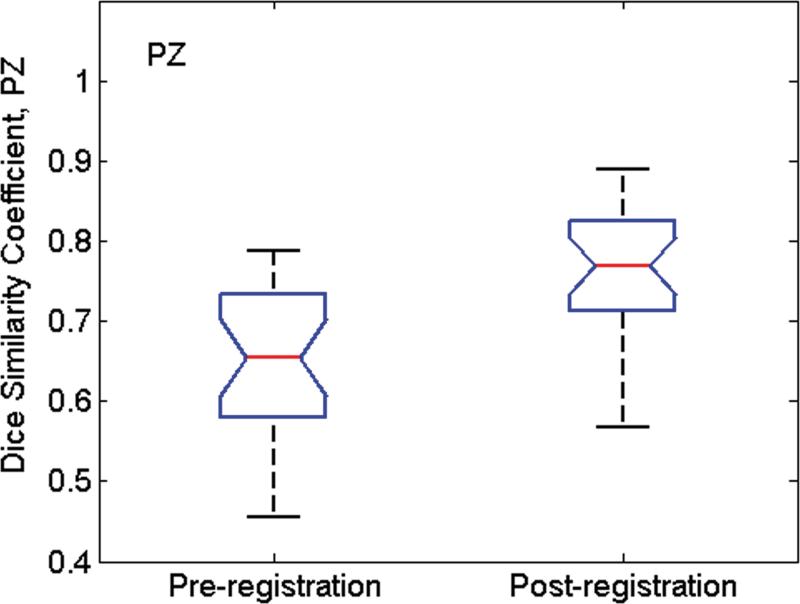
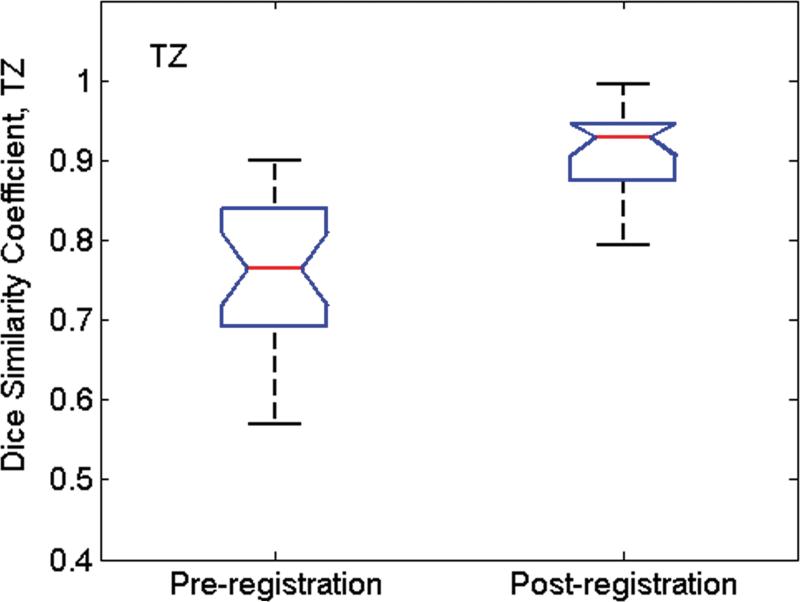
Fig. 6 shows the Dice similarity coefficient (D) values calculated from all MR image/pathologic slice pairs before and after image registration. Before registration, mean (std. dev.) D values for WP, PZ and TZ were 0.76(0.04), 0.65(0.04), and 0.77(0.06), respectively. After image registration, mean D values increased to 0.91(0.02), 0.76(0.03), and 0.85(0.03), respectively. For all three tissue categories, the improvement in alignment was significant (P < 0.001 for all).
Figure 6.
Box whisker plot of D values calculated from all MR image/pathologic slice pairs pre- and post-image registration for (a) whole prostate (WP), (b) peripheral zone (PZ), and (c) the transition zone (TZ) from 24 patients. The whiskers indicate the lower (lowest 25% of data) and upper (highest 25% of data) quartile of mean D values, and the nose indicates the median D value. For the pathology/MR image pair before registration, the Dice similarity coefficent was calculated after co-registration of the center of mass of pathology with that of MRI. After registration, the mean D values were significantly higher for all three groups (P < 0.001).
DISCUSSION
Many studies rely on visual comparison of prostate MR images and pathologic slices for validation of imaging findings. However, because of shrinkage of the pathological specimen and changes in the shape of the prostate caused by the endorectal coil during imaging, only limited accuracy is feasible with the visual approach, and better methods of co-registration are needed. A method that could accurately register in vivo MR images to pathological slices would allow for more precise evaluation of in vivo MR methodologies.
We have presented a non-rigid co-registration method based on B-splines for aligning prostate MR images and pathologic slices. The registration is based on the shape and not the texture of the prostate images, as the texture is very different on MR images and pathology maps. In our study, the proposed technique significantly reduced the differences in lateral and anteroposterior prostate diameters and increased the Dice similarity coefficients for the whole prostate, the peripheral zone and the transition zone. The average pre-registration differences observed in prostate dimensions, caused primarily by the endorectal coil, were in agreement with those observed by Hejmink et al (6).
The main advantage of the proposed method is that it does not require manual designation of landmark points, which is observer-dependent and time consuming, especially when numerous landmarks are selected to facilitate more accurate registration. In our approach, only the initial matching of an MR image with the corresponding pathologic slice was performed by a radiologist. If desired, our registration method could be combined with the use of manually placed landmarks. As the affine transformation alone preserves collinearity, it will not completely address the deformations of the prostate caused by insertion of the endorectal coil and the shrinkage of the specimen post-surgery. Furthermore, the B-splines-based registration method produces smooth transformation maps that can realistically capture smooth, local deformations of the prostate caused by the endorectal coil and the histopathological processing of the resected prostate. B-spline-based methods are also known to be robust to noise and to enable the high-order nonlinear distortions to be restored accurately.
The diameters on MRI in the RL direction were consistently larger than those on pathology, while the diameters in the AP direction are consistently smaller. This suggests that the endorectal coil causes lateral expansion and anteroposterior compression of the prostate. Furthermore, the fact that the pre-registration difference in diameters in both RL and AP directions correlated significantly with the diameters on pathology suggests that the deformation increases with the prostate diameter. After registration, the percentage difference in diameter in both the RL and AP directions is dramatically reduced such that a significant correlation no longer exists
Our approach has several limitations. Firstly, it is not completely automatic. The requirement for manual alignment of MR images to pathological slices reduces work efficiency, introduces inter-user variability, and reduces the overall robustness of the method. Secondly, the matching of the MR images and pathology slices assumes that both are in exactly the same plane and the prostate expands like a balloon. These assumptions only approximations of the truth and thus limit the accuracy of the results. The registration is performed in 2D only and on the MR image/pathologic slice pair that contains the largest area of tumor. Hence the differences in the orientations of MR images and pathology slices are not taken into account. However, limiting the analysis to the largest area of tumor (i.e., the index lesion) is appropriate for the clinical scenario for which the methodology is intended. In prior studies, the presence of secondary lesions did not correlate with important prognostic factors, and PSA progression-free rates were worse in patients with unifocal disease (25). The largest tumor was usually larger than all the other tumors combined and the least differentiated (26). Thirdly, the deformation caused by the endorectal coil is highly local, and the MR images of the prostate, especially of the peripheral zone, are progressively more distorted towards the wall of the rectum. However, the registration algorithm we have presented does not incorporate internal anatomical landmarks and therefore treats the prostate as a uniform volume of tissue. This limitation can be partially alleviated by using images with higher spatial resolution in all three dimensions and also by incorporating anatomical landmarks into the non-rigid registration algorithm (13). However, identifying such landmarks requires expertise and hence limits the usability of the method. Finally, in our analysis we treated pathology as the reference standard although the fixation of the prostatectomy specimen causes tissue shrinkage (7).
For this analysis, we assumed that the in-plane elasticity of the prostate tissue was uniform. In a study in which the finite element method was used to register prostate MR images acquired with and without the endorectal coil, Alterovitz, et al. (27) assigned a Young's elastic modulus of 60 kPa to the central gland and 30 kPa to all surrounding tissues based on ultrasound elastography measurements (28). In another study, also focused on the finite-element-based deformable registration of MR images acquired at different field strengths and patient positions, Bharatha, et al. empirically obtained the Young's modulus values of 30 kPa in central gland and 3 kPa in the PZ (29). In our dataset, the Dice similarity coefficient for the TZ before registration was the highest among the three regions (0.77), but it improved by only 10% after registration. In contrast, in the PZ, D was initially low (0.65)--confirming that the PZ suffers from the greatest deformations--and improved by 17% after registration. Accurate alignment of both the PZ and the TZ may require incorporating the stiffness parameters into the registration algorithm.
The methodology presented here could be useful in studies that require precise mapping on a voxel-by-voxel basis of in-vivo MR images onto pathologic slices of tumor tissue. In one such study, tumor volume was measured with combined T2w imaging and DWI and the findings were correlated with pathological tumor volumes (4). In another such study by Zelhof, et al., ADC maps generated from DWI were correlated with cell density measured from prostatectomy specimens (30). In both studies, whole-mount step-section pathologic slices were matched with the most closely corresponding transverse T2w images and DWI/ADC maps on the basis of anatomical landmarks and without using deformable registration. The use of deformable registration in such studies would improve the alignment of the images and the measurement of the corresponding features of interest (in these cases, tumor volume and tumor cellularity). The coarse-to-fine sampling scheme could be used to refine our approach to make the registration more time-efficient and robust against noise, and to improve overall registration. In this scheme, the images are first Gaussian smoothed, resampled to a low resolution, and registered with a coarse grid. After convergences at low resolution, the grid is refined and higher resolution images are used. The refinement is done iteratively until the initial resolution of the images is reached.
In conclusion, the deformable image registration method proposed provides a high degree of flexibility in co-registering MR images to pathological maps and can assist in more accurate evaluation of MRI findings. Future work will focus on extending the algorithm to three dimensions and further automating it so that it is less user-dependent.
ACKNOWLEDGEMENTS
We are grateful to Ms. Ada Muellner, BA, for editing this manuscript.
Funded by: National Institutes of Health grant #R01 CA76423.
REFERENCES
- 1.Yu KK, Hricak H, Alagappan R, Chernoff DM, Bacchetti P, Zaloudek CJ. Detection of extracapsular extension of prostate carcinoma with endorectal and phased-array coil MR imaging: multivariate feature analysis. Radiology. 1997;202(3):697–702. doi: 10.1148/radiology.202.3.9051019. [DOI] [PubMed] [Google Scholar]
- 2.Futterer JJ, Heijmink SW, Scheenen TW, et al. Prostate cancer localization with dynamic contrast-enhanced MR imaging and proton MR spectroscopic imaging. Radiology. 2006;241(2):449–458. doi: 10.1148/radiol.2412051866. [DOI] [PubMed] [Google Scholar]
- 3.Coakley FV, Kurhanewicz J, Lu Y, et al. Prostate cancer tumor volume: measurement with endorectal MR and MR spectroscopic imaging. Radiology. 2002;223(1):91–97. doi: 10.1148/radiol.2231010575. [DOI] [PubMed] [Google Scholar]
- 4.Mazaheri Y, Hricak H, Fine SW, et al. Prostate tumor volume measurement with combined T2-weighted imaging and diffusion-weighted MR: correlation with pathologic tumor volume. Radiology. 2009;252(2):449–957. doi: 10.1148/radiol.2523081423. [DOI] [PMC free article] [PubMed] [Google Scholar]
- 5.Hricak H, White S, Vigneron D, et al. Carcinoma of the prostate gland: MR imaging with pelvic phased-array coils versus integrated endorectal--pelvic phased-array coils. Radiology. 1994;193(3):703–709. doi: 10.1148/radiology.193.3.7972810. [DOI] [PubMed] [Google Scholar]
- 6.Heijmink SW, Scheenen TW, van Lin EN, et al. Changes in prostate shape and volume and their implications for radiotherapy after introduction of endorectal balloon as determined by MRI at 3T. International journal of radiation oncology, biology, physics. 2009;73(5):1446–1453. doi: 10.1016/j.ijrobp.2008.06.1491. [DOI] [PubMed] [Google Scholar]
- 7.Jonmarker S, Valdman A, Lindberg A, Hellstrom M, Egevad L. Tissue shrinkage after fixation with formalin injection of prostatectomy specimens. Virchows Arch. 2006;449(3):297–301. doi: 10.1007/s00428-006-0259-5. [DOI] [PubMed] [Google Scholar]
- 8.Bardinet E, Ourselin S, Dormont D, et al. Co-registration of histological, optical and mr data of the human brain. Medical Image Computing and Computer-Assisted Intervention. 2002:548–555. [Google Scholar]
- 9.Mega MS, Chen SS, Thompson PM, et al. Mapping histology to metabolism: coregistration of stained whole-brain sections to premortem PET in Alzheimer's disease. NeuroImage. 1997;5(2):147–153. doi: 10.1006/nimg.1996.0255. [DOI] [PubMed] [Google Scholar]
- 10.Thompson P, Toga AW. A surface-based technique for warping three-dimensional images of the brain. IEEE transactions on medical imaging. 1996;15(4):402–417. doi: 10.1109/42.511745. [DOI] [PubMed] [Google Scholar]
- 11.Bookstein F. Principal warps: Thin-plate splines and the decomposition of deformations. IEEE Trans Pat Anal Machine Intelligence. 1989;11:567–85. [Google Scholar]
- 12.Jacobs MA, Windham JP, Soltanian-Zadeh H, Peck DJ, Knight RA. Registration and warping of magnetic resonance images to histological sections. Medical physics. 1999;26(8):1568–1578. doi: 10.1118/1.598671. [DOI] [PubMed] [Google Scholar]
- 13.Zhan Y, Ou Y, Feldman M, Tomaszeweski J, Davatzikos C, Shen D. Registering histologic and MR images of prostate for image-based cancer detection. Academic radiology. 2007;14(11):1367–1381. doi: 10.1016/j.acra.2007.07.018. [DOI] [PMC free article] [PubMed] [Google Scholar]
- 14.Meyer CR, Moffat BA, Kuszpit KK, et al. A methodology for registration of a histological slide and in vivo MRI volume based on optimizing mutual information. Mol Imaging. 2006;5(1):16–23. [PMC free article] [PubMed] [Google Scholar]
- 15.Park H, Piert MR, Khan A, et al. Registration methodology for histological sections and in vivo imaging of human prostate. Academic radiology. 2008;15(8):1027–1039. doi: 10.1016/j.acra.2008.01.022. [DOI] [PMC free article] [PubMed] [Google Scholar]
- 16.Xu J, Humphrey PA, Kibel AS, et al. Magnetic resonance diffusion characteristics of histologically defined prostate cancer in humans. Magn Reson Med. 2009;61(4):842–850. doi: 10.1002/mrm.21896. [DOI] [PMC free article] [PubMed] [Google Scholar]
- 17.Viswanath S, Bloch BN, Genega E, et al. A comprehensive segmentation, registration, and cancer detection scheme on 3 Tesla in vivo prostate DCE-MRI. Med Image Comput Comput Assist Interv. 2008;11(Pt 1):662–669. doi: 10.1007/978-3-540-85988-8_79. [DOI] [PMC free article] [PubMed] [Google Scholar]
- 18.Kybie K, Unser M. Fast parametric elastic image registration. IEEE Trans Image Process. 2003;12(11):1427–1442. doi: 10.1109/TIP.2003.813139. [DOI] [PubMed] [Google Scholar]
- 19.Rueckert D, Sonoda LI, Hayes C, Hill DL, Leach MO, Hawkes DJ. Nonrigid registration using free-form deformations: application to breast MR images. IEEE transactions on medical imaging. 1999;18(8):712–721. doi: 10.1109/42.796284. [DOI] [PubMed] [Google Scholar]
- 20.Yossepowitch O, Sircar K, Scardino PT, et al. Bladder neck involvement in pathological stage pT4 radical prostatectomy specimens is not an independent prognostic factor. The Journal of urology. 2002;168(5):2011–2015. doi: 10.1016/S0022-5347(05)64284-X. [DOI] [PubMed] [Google Scholar]
- 21.Wahba G. Spline models for observational data. Soc Industr Applied Math. 1990 [Google Scholar]
- 22.Zijdenbos AP, Dawant BM, Margolin RA, Palmer AC. Morphometric analysis of white matter lesions in MR images: Method and validation. IEEE Trans Med Imaging. 1994;13:716–724. doi: 10.1109/42.363096. [DOI] [PubMed] [Google Scholar]
- 23.Dice LR. Measures of the amount of ecologic association between species. Ecology. 1945;26:297–302. [Google Scholar]
- 24.Bland JM, Altman DG. Statistical methods for assessing agreement between two methods of clinical measurement. Lancet. 1986;(i):307–310. [PubMed] [Google Scholar]
- 25.McNeal JE, Price HM, Redwine EA, Freiha FS, Stamey TA. Stage A versus stage B adenocarcinoma of the prostate: morphological comparison and biological significance. The Journal of urology. 1988;139(1):61–65. doi: 10.1016/s0022-5347(17)42293-2. [DOI] [PubMed] [Google Scholar]
- 26.Stamey TA, McNeal JE, Yemoto CM, Sigal BM, Johnstone IM. Biological determinants of cancer progression in men with prostate cancer. Jama. 1999;281(15):1395–1400. doi: 10.1001/jama.281.15.1395. [DOI] [PubMed] [Google Scholar]
- 27.Alterovitz R, Goldberg K, Pouliot J, et al. Registration of MR prostate images with biomechanical modeling and nonlinear parameter estimation. Medical physics. 2006;33(2):446–454. doi: 10.1118/1.2163391. [DOI] [PubMed] [Google Scholar]
- 28.Krouskop TA, Wheeler TM, Kallel F, Garra BS, Hall T. Elastic moduli of breast and prostate tissues under compression. Ultrason Imaging. 1998;20(4):260–274. doi: 10.1177/016173469802000403. [DOI] [PubMed] [Google Scholar]
- 29.Bharatha A, Hirose M, Hata N, et al. Evaluation of three-dimensional finite element-based deformable registration of pre- and intraoperative prostate imaging. Medical physics. 2001;28(12):2551–2560. doi: 10.1118/1.1414009. [DOI] [PubMed] [Google Scholar]
- 30.Zelhof B, Pickles M, Liney G, et al. Correlation of diffusion-weighted magnetic resonance data with cellularity in prostate cancer. BJU international. 2009;103(7):883–888. doi: 10.1111/j.1464-410X.2008.08130.x. [DOI] [PubMed] [Google Scholar]


