

Abstract
Calorie restriction (CR) and alternate-day fasting (ADF) reduce cancer risk and reduce cell proliferation rates. Whether modified ADF regimens (i.e., allowing a portion of energy needs to be consumed on the fast day) work, as well as true ADF or CR to reduce global cell proliferation rates, remains unresolved. Here, we measured the effects of true ADF, modified ADF, and daily CR on cell proliferation rates in mice. Thirty female C57BL/6J mice were randomized to one of five interventions for 4 wk: 1) CR-25% (25% reduction in daily energy intake), 2) ADF-75% (75% reduction on fast day), 3) ADF-85% (85% reduction on fast day), 4) ADF-100% (100% reduction on fast day), and 5) control (ad libitum intake). Body weights of the ADF groups did not differ from controls, whereas the CR-25% group weighed less than all other groups posttreatment. Epidermal cell proliferation decreased (P<0.01) by 29, 20, and 31% in the CR-25%, ADF-85% and ADF-100% groups, respectively, relative to controls. Proliferation rates of splenic T cells were reduced (P<0.01) by 37, 32, and 31% in the CR-25%, ADF-85%, and ADF-100% groups, respectively, and mammary epithelial cell proliferation was 70, 65, and 62% lower (P<0.01), compared with controls. Insulin-like growth factor-1 levels were reduced (P<0.05) in the CR-25% and ADF-100% groups only. In summary, modified ADF, allowing the consumption of 15% of energy needs on the restricted intake day, decreases global cell proliferation similarly as true ADF and daily CR without reducing body weight.—Varady, K. A., Roohk, D. J., McEvoy-Hein, B. K., Gaylinn, B. D., Thorner, M. O., Hellersteinm M. K. Modified alternate-day fasting regimens reduce cell proliferation rates to a similar extent as daily calorie restriction in mice. FASEB J. 22, 2090–2096 (2008)
Keywords: cancer, insulin-like growth factor-1, insulin-like growth factor binding protein-3
Calorie restriction (CR), typically involving a 15– 40% reduction in daily energy intake, has been shown to extend life span and prevent cancer (1). CR reduces experimentally induced tumors of skin (2) and mammary tissue (2) and also decreases tumor burden, while prolonging tumor latency in genetically altered mice (3). Epidemiological trials in humans demonstrate an association between limited calorie intake and reduced incidence of breast and colon cancer (1, 4). The antiproliferative effects of CR may account for a considerable portion of the life span extension in mice (1). However, the antiproliferative mechanisms of CR are not known with certainty. Reduced oxidative damage to DNA or other effects on the initiation phase of carcinogenesis (mutagenesis) may be involved. Perhaps the most well-established mechanism is on the promotional phase of carcinogenesis (mitogenesis; ref. 5). CR reduces proliferation rates of several tissues, including breast, colon, prostate, lymphocytes, and liver (1), while reducing levels of various growth factors (3). Since mitogenesis promotes cancer in a several ways (5), global reduction in cell proliferation may represent a central element in the anticarcinogenic actions of CR.
Alternate-day fasting (ADF) is another form of dietary restriction. ADF has also been shown to reduce cell proliferation rates (6, 7), inhibit hepatic preneo-plastic lesion development (8), and increase survival rates after tumor inoculation in rodents (9). ADF regimens generally comprise 24 h periods of fasting (fast day) alternating with 24 h periods of ad libitum feeding (feed day). In a recent study, we (6) reported that mice undergoing 4 wk of ADF experienced significant decreases in prostate and splenic T-cell proliferation. Similarly, Hsieh et al. (7) showed that intermittent feeding in mice, with only a 5% reduction in total calorie intake, reduced proliferation rates of several cell types, including mammary epithelial cells, epidermal cells, and T cells.
An important unresolved question in the ADF field is whether 100% reduction in food intake is required on the fast day (i.e., true ADF) or whether modified fasts that allow a portion of energy needs to be consumed on the fast day can maintain benefits. We showed recently that a 25% reduction in energy intake on the fast day had no effect on cell proliferation (6), whereas a 50% reduction had only a minimal effect on proliferation rates (6), although the latter regimen altered adipose lipid metabolism (10). We concluded that >50% caloric reduction was required on the fast day to reduce cell proliferation. The precise dose was not established, however, and a fundamental question was not answered, namely, whether net negative energy balance (e.g., weight loss and altered body composition) was required for the benefits of dietary restriction regimens to occur.
A related issue is the effect of dietary restriction regimens on circulating growth factors. Insulin-like growth factor-1 (IGF-1) plays a role in tumor growth by stimulating cell proliferation and inhibiting apoptosis (5). Circulating concentrations of IGF-1 are mainly determined by hepatic synthesis, which is regulated by growth hormone (GH) and nutritional status (5). Insulin-like growth factor binding protein-3 (IGFBP-3) regulates IGF-1 availability in the circulation (5). Ghrelin, a peptide produced in the stomach, is the endogenous ligand for the GH secretagogue receptor (GHSR) and is a potent stimulator of GH secretion (11). CR regimens reduce IGF-1 levels and stimulate ghrelin release (12, 13), but the effects of ADF regimens have not been established.
Accordingly, the objective of the present study was to compare the effects of true ADF, modified ADF, and daily CR regimens on cell proliferation rates and on the relation between proliferation rates and plasma IGF-1, IGFBP-3, and ghrelin concentrations. Because our previous data (6) showed no effect on cell proliferation with 25% and a hint of an effect with 50% restriction during the modified fast day, we tested modified ADF regimes that restricted intake by >50% on the fast day.
Materials and Methods
Mice and diets
Seven-week-old C57BL/6J female mice were obtained from Charles River Breeding Laboratories (Wilmington, MA, USA), housed individually, and maintained under temperature and light controlled conditions (12 h light/dark cycle: lights on at 7 AM and off at 7 PM) for 1 wk. During this acclimation period, mice were given free access to water and a semipurified AIN-93M diet (Bio-Serv, Frenchtown, NJ, USA), and the daily amount of food consumed by each mouse was recorded.
At 8 wk of age, mice were randomly assigned to one of five intervention groups (n=6 per group) for 4 wk. Mice in the first intervention group (CR-25%) were food restricted daily by 25% of their baseline dietary needs. Mice in the second group (ADF-75%) were fed the semipurified AIN-93M diet ad libitum on the feed day and a 75% calorie-restricted diet on alternate days. Mice in the third group (ADF-85%) were fed the AIN-93M diet ad libitum on the feed day and an 85% calorie-restricted diet on the fast day. Mice in the fourth group (ADF-100%) were fed the AIN-93M diet ad libitum on the feed day and underwent a complete fast on alternate days. Mice in the fifth group served as controls and were fed the AIN-93M diet ad libitum each day. The degree of caloric reduction was calculated based on mean daily food consumption during the acclimation period for each mouse. Food was provided or taken away at 13 h each day and was weighed daily. Body weight was assessed weekly on the same day and time. Mice were sacrificed at 12 wk of age by cardiac puncture under isoflurane anesthesia, followed by cervical dislocation. All procedures and protocols received approval from the University of California Berkeley Animal Use Committee.
Blood collection and 2H2O labeling protocol
Eight-hour fasting blood samples were collected on the last day of the trial (day 28), the morning after a feed day. Mice were given heavy water (2H2O) as described elsewhere (7, 14), starting at the beginning of wk 3 (day 14) and continuing through the last 2 wk of the study (days 14-28). An intraperitoneal injection of isotonic 100% 2H2O (0.18 ml/10 g body weight) was administered on day 14 of the study to bring the 2H2O content of body water up to ∼5%. Animals then received drinking water containing 8% 2H2O ad libitum from days 14–28.
Epidermal cell isolation
Immediately after sacrifice, dorsal hair was removed by application of a hair removal lotion (Nair; Carter Products, New York, NY, USA). The lotion was then cleaned off using an alcohol swab, and a piece of the dorsal skin without hair was dissected (3 cm2). The skin was rinsed with phosphate buffer solution (PBS; Gibco, Grand Island, NY, USA), cut into three small pieces, immersed in dispase II (Roche, Indianapolis, IN, USA), and incubated for 3.5 h at 37°C on a shaker. The epidermis was then separated from the dermis, as described previously (15).
Splenic T-cell isolation
After sacrifice, the spleen was removed, minced, and filtered through a 30 μm nylon mesh. T cells were then isolated from the spleen using anti-CD90 microbeads via a magnetic column method (Miltenyi Biotec, Auburn, CA, USA).
Mammary epithelial cell isolation
Mammary fat pads were dissected, minced, and treated with collagenase (Worthington Biochemical, Lakewood, NJ, USA), as described previously (16). Mammary epithelial cells were then isolated by a magnetic column method, using goat anti-mouse IgG microbeads (Miltenyi Biotec, Auburn, CA, USA), as described elsewhere (5).
Bone marrow cell isolation
Bone marrow cells were collected from the femur. As described previously (17), marrow cells were flushed out using a needle and syringe containing PBS (Gibco).
Measurement of deuterium label enrichment in DNA
DNA was isolated from T cell and epidermal, mammary epithelial, and bone marrow cells using Qiagen kits (Qiagen, Valencia, CA, USA) and then was hydrolyzed to deoxyribonucleosides, as described elsewhere (18). Briefly, DNA was incubated overnight at 37°C with DNase, nuclease P1, snake venom phosphodiesterase, and alkaline phosphatase (Sigma, St. Louis, MO, USA). The deoxyribose (dR) moiety of the released free deoxyribonucleosides was then derivatized to pentane tetra-acetate (18). Positive chemical ionization gas chromatography-mass spectrometry was used to analyze the pentane tetra-acetate with a model 5973 mass spectrometer and a model 6890 gas chromatograph (Agilent, Palo Alto, CA, USA). Selected ion monitoring was performed on mass-to-charge ratios (m/z) of 245 and 246, representing the M+0 and M+1 ions, respectively. Excess fractional M+1 enrichment (EM1) of dR was calculated as:
where sample and standard represent the analyzed sample and unenriched standards, respectively. Unlabeled standards of natural abundance pentane tetra-acetate were analyzed concurrently with samples. Matching the abundance of samples to standards and other corrections have been described in detail elsewhere (18). Fractional replacement (f) of cells was calculated as described previously (14, 19) by comparison to cells from the same animal that were nearly fully turned over after 2 wk of labeling with 2H2O, i.e., bone marrow cells:
Circulating hormone level determinations
Plasma IGF-1 and IGFBP-3 concentrations were determined using an enzyme-linked immunosorbent assay (ELISA) kit (Linco Research, St. Charles, MO, USA, and R&D Systems, Minneapolis, MN, USA, respectively). Ghrelin levels were measured by sandwich ELISA, as described previously (20).
Estrus cycle status
The presence or absence of estrus cycle was determined for all animals via vaginal smear and analysis of cell morphology. Vaginal smears were taken during the last 8 consecutive days of the study, and samples were fixed and stained on slides with Giemsa blood stain (Medical Chemical Corp., Los Angeles, CA, USA), as described previously (21).
Statistical analysis
Differences between groups during the acclimation period and at each week during the study were analyzed by a one-way ANOVA. When significant differences were noted between groups, a Tukey's post hoc test was performed to determine significant differences between group means. Changes within an intervention group throughout the study were measured using repeated-measures ANOVA. Correlation analyses were also performed to evaluate the relationship between cell proliferation rates and hormone levels. A value of P < 0.05 was used as the criterion for statistical significance in all analyses. Data were analyzed by SPSS software (version 11 for Mac OS X, SPSS Inc., Chicago, IL, USA).
Results
Body weight
Mean body weight in each intervention group throughout the 4 wk study is displayed in Fig. 1. There were no differences in body weight between groups during the first week of the study. However, by wk 2, the CR-25% group weighed less (P<0.05) than the ADF and control groups, and this lower body weight persisted through the end of the study. Body weights of the ADF groups did not differ significantly from that of controls. The ADF-75%, ADF-85%, ADF-100%, and control groups all gained (P<0.05) weight from the beginning to the end of the study, whereas the CR-25% lost (P<0.05) weight.
Figure 1.
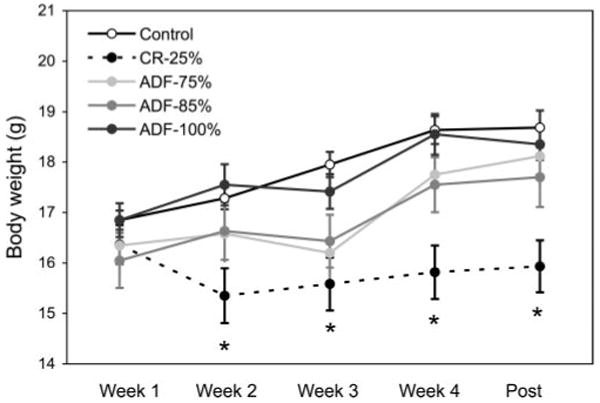
Mean body weight throughout the 4 wk study. Values are means ± SE. Mean body weight in each group was similar during wk 1 of the study. By wk 2, the CR-25% group weighed less than all other groups, and this lower body weight persisted until the last day of the study. There were no differences in body weight between the ADF and control groups throughout the 4 wk study. One-way ANOVA with Tukey's post hoc test was used for all between-group analyses; *P < 0.05.
Food intake
The daily amount of food consumed by each mouse was similar during the acclimation phase (Fig. 2). During wk 1 and 2, mean daily food intake of the CR-25%, ADF-75%, ADF-85%, and ADF-100% groups was less (P<0.0001) than that of controls. However, by wk 3, only the CR-25% group was eating less (P<0.01) than the control group. During the last week of the study (wk 4), all the intervention groups consumed less (P<0.0001) food than controls.
Figure 2.
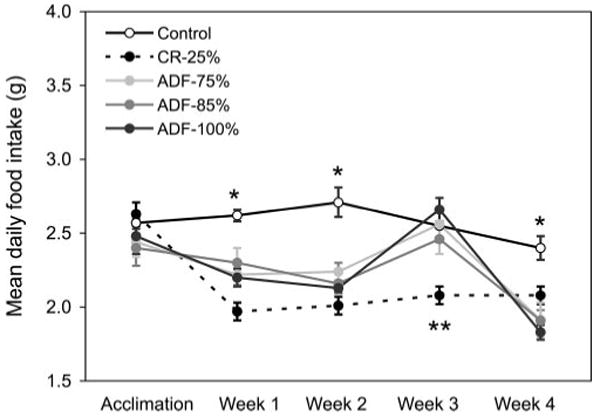
Mean daily food intake throughout the 4 wk study. Values are means ± SE. Each intervention group ate less than control during wk 1, 2, and 4. During wk 3, the CR-25% group ate less than all the other groups. One-way ANOVA with Tukey's post hoc test was used for all between-group analyses; *P < 0.0001, **P < 0.01.
Hyperphagic response to food restriction
A hyperphagic response on the feed day to food restriction on the fast day (P<0.05) shows significant differences between controls vs. ADF-75%, ADF-85%, and ADF-100% groups, during wk 1–4 (Fig. 3). In general, the ADF-75% and ADF-85% groups consumed ∼60 and ∼70% more (P<0.05) food on feed days, respectively, than controls, whereas the ADF-100% group ate ∼85% more (P<0.05) food on feed days than controls.
Figure 3.
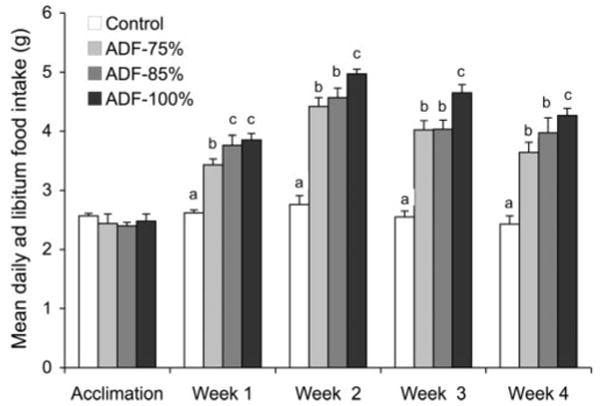
Hyperphagic response on the feed day to food restriction on the restricted (fast) day. Values are means ± SE. Means not sharing a common superscript letter are significantly different (P<0.05). One-way ANOVA with Tukey's post hoc test was used for all between-group analyses.
In vivo proliferation of epidermal cells, splenic T cells, and mammary epithelial cells
Cell proliferation rates of various tissues after 4 wk of CR or ADF are shown in Fig. 4. At the end of the study, epidermal cell (keratinocyte) proliferation rates decreased (P<0.01) by 29, 20, and 31% in the CR-25%, ADF-85% and ADF-100% groups, respectively, relative to controls. Splenic T-cell proliferation was also reduced (P<0.01) by 37, 32, and 31% in the CR-25%, ADF-85%, and ADF-100% groups, respectively, when compared with controls. Mammary epithelial cell proliferation rates were 70, 65, and 62% lower (P<0.01) in the CR-25%, ADF-85%, and ADF-100% groups, respectively, relative to controls. In contrast, no significant effects of ADF-75% on cell proliferation rates were observed for any cell type. Thus, restricting food by 85% on the calorie-restricted day (modified ADF), but not 75% on the calorie-restricted day, resulted in comparable reductions in proliferation rates as restricting food completely on the fast day (true ADF). Moreover, the effects of modified as well as true ADF on cell proliferation rates were comparable to that of daily CR for all tissue types.
Figure 4.
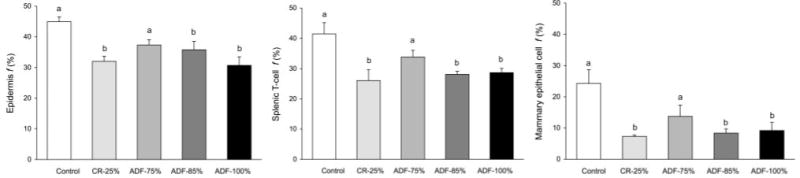
Effect of 4 wk of CR or ADF on epidermal cell, splenic T-cell, and mammary epithelial cell proliferation. Values are means ± SE. ADF-85% and ADF-100% produced similar reductions (P<0.01) in epidermal cell, T cell, and mammary epithelial cell proliferation as CR-25%. One-way ANOVA with Tukey's post hoc test was used for all between-group analyses; means not sharing a common letter are significantly different (P<0.05).
Plasma IGF-1 and IGFBP-3 concentrations
The effects of 4 wk of treatment on circulating hormonal mediators of cell proliferation are displayed in Table 1. Circulating IGF-1 levels were lower (P<0.05) in the CR-25% (197±18 ng/ml, 45% lower than controls) and ADF-100% (190±19 ng/ml, 47% lower than controls) groups, relative to the control group (359±52 ng/ml), but were not significantly altered by any of the modified ADF regimens. Circulating IGF-1 concentrations were positively correlated with in vivo proliferation rates of epidermal cells (r=0.39; P=0.03) and mammary epithelial cells (r=0.63; P=0.001). Circulating IGFBP-3 levels were not affected by any intervention. No associations between posttreatment IGF-1 and IGFBP-3 concentrations were observed.
TABLE 1. Effect of 4 wk of CR or ADF on circulating hormones and growth factors.
| Hormone or growth factor | Control | CR-25% | ADF-75% | ADF-85% | ADF-100% |
|---|---|---|---|---|---|
| IGF-1 (ng/ml) | 359 ± 52* | 197 ± 18# | 303 ± 39* | 270 ± 44* | 190 ± 19# |
| IGFBP-3 (ng/ml) | 9.07 ± 1.21 | 8.16 ± 1.14 | 8.29 ± 0.91 | 7.92 ± 0.95 | 7.78 ± 0.87 |
| Total ghrelin (pg/ml)a | 1003 ± 181 | 1229 ± 125 | 1244 ± 91 | 995 ± 101 | 1283 ± 140 |
| Oct ghrelin (pg/ml)a | 155 ± 27* | 160 ± 19* | 191 ± 79* | 187 ± 63* | 292 ± 64 |
| Des ghrelin (pg/ml)a | 847 ± 188 | 1068 ±144 | 1053 ± 30 | 807 ± 88 | 991 ± 91 |
Values are expressed as means ± SE. Means not sharing a common symbol are significantly different (P<0.05; one-way ANOVA with Tukey post hoc test for IGF-1; t test for ghrelin).
Ghrelin levels were analyzed in a subset of mice (n=3 per group), whereas IGF-1 and IGFBP-3 levels were analyzed in all mice (n=6 per group).
Plasma ghrelin concentrations
Ghrelin is an endogenous ligand of the GHSR and thus acts to stimulate GH secretion. Ghrelin exists in two major forms: n-octanoyl-modified ghrelin (oct ghrelin), which possesses an n-octanoyl modification on serine-3; and des-acyl ghrelin (des ghrelin). The form of ghrelin active at the GHSR (oct ghrelin) was significantly increased (P<0.05) in the ADF-100% group (292±64 pg/ml) relative to controls (155±27pg/ml), although there were no significant differences among any other groups (Table 1). Des and total ghrelin were not affected by any treatment.
Estrus cycle
On the basis of morphological analysis of vaginal cytology, CR mice were anestrus (not cycling), whereas the ADF-75%, ADF-85%, ADF-100%, and control mice were actively cycling (i.e., there was no effect on the 4 day cycling period). The decrease in mammary epithelial cell proliferation in the CR group but not the ADF groups might, therefore, be influenced by a reduction in reproductive hormone levels (22).
Discussion
The question addressed in this study was whether modified ADF regimens, which allow some caloric intake on the restricted day, can reproduce global reductions in cell proliferation rates observed with true ADF and classic CR regimens. Our results document, for the first time, that a modified ADF regimen, which allowed for the consumption of 15% of energy needs on the fast day, produced essentially identical reductions in cell proliferation rates as true ADF. Moreover, both true ADF and modified ADF regimens produced similar reductions as classic 25% CR for all cell types monitored (epidermal cells, splenic T cells, and mammary epithelial cells). Interestingly, the modified ADF regimen, which allowed for consumption of 25% of energy needs on the calorie-restricted day, did not result in such beneficial modulations. These results suggest that a dose-response relationship of a nonlinear type exists between the extent of calorie intake on the restricted day of an ADF regimen and the signals responsible for reducing global cell proliferation and that this dose-response relationship may have a thresh-hold character.
We investigated some of the circulating factors that might act as signals to reduce cell proliferation. ADF-100% and CR-25%, but not modified ADF regimens, reduced circulating IGF-1 levels, consistent with the proposed role of IGF-1 in the hypoproliferative response induced by CR (23). The observation that equivalent reductions in cell proliferation were observed in the ADF-85% regimen without any reduction in IGF-1 levels, however, calls into question the uniqueness of IGF-1 in this regard. It is important to note that these antiproliferative effects in both the true (ADF-100%) and modified ADF (ADF-85%) groups occurred here in the absence of weight loss, suggesting that these outcomes occurred as a result of an energy intake pattern rather than a net negative energy balance. We have previously reported (6) that ADF-100% regimens result in weight loss, due to an inability of the hyperphagic response to compensate fully for the complete absence of caloric intake on the fast day. It has not previously been shown, however, that any regimen that allows energy intake on the restricted day and no change in body weight could reproduce the effects of CR or true ADF.
Cell proliferation plays a central role in the promotional phase of carcinogenesis (5). We demonstrate here that modified ADF regimens work just as well as daily CR to reduce cell proliferation rates in a variety of tissue types of both epithelial (mammary and skin) and mesenchymal (lymphocyte) origin. Although the ability of classic CR to reduce cell turnover is well documented (24–28), very few studies (6, 7) have examined the effect of true and modified ADF regimens on this indicator of cancer risk. In our previous study (6), we showed that modified ADF regimens that allow consumption of 50 and 75% of baseline energy needs on the restricted day, alternating with ad libitum feeding on the feed day, had very little effect on proliferation rates of prostate epithelial or splenic T cells, whereas the group undergoing a complete 24-h fast (ADF-100%) exhibited markedly reduced proliferation rates (6). This led us to test the hypothesis that a reduction in caloric intake on the fast day by >50 but <100% could produce beneficial effects. The results here indicate that 15% of energy needs, but not 25%, can be consumed on the restricted day and achieve similar reductions in cell proliferation rates as daily CR and true ADF. It will be important to confirm in longer term carcinogenesis studies that the reductions in global cell proliferation rates shown here result in reduced cancer rates. If this is confirmed, and data can be extrapolated to ADF in humans, it is possible that subjects need not undergo a complete 24 h fast but may instead consume a portion of energy needs on the restricted day and still achieve benefits such as a reduction in cancer risk. If the results with modified ADF regimens shown here in rodents can be confirmed by studies in man, the feasibility of ADF strategies would be considerably enhanced, as true ADF regimens are generally not well tolerated in human subjects (29, 30).
These antiproliferative effects occurred in the absence of weight loss in the ADF groups. Based on the hyperphagic response observed on the ad libitum feeding day, the ADF groups were able to maintain and gain body weight by compensating on the feed day for the degree of energy restriction experienced on the fast day. More specifically, the mice in the ADF-75%, ADF-85%, and ADF-100% groups ate 60, 70, and 85% more food on the feed days, respectively, than control mice. Reduced activity levels or resting energy expenditure may also contribute but was not evaluated here. The lack of a requirement for weight loss or changes in body fat mass with ADF regimens makes this approach to dietary restriction potentially attractive for normal weight and mildly overweight subjects. Individuals in higher weight classes might be more appropriate for daily CR, as this diet regimen generally results in weight loss.
Evidence has linked circulating IGF-1 concentrations to risk for cancer. Prospective studies (31–33) in humans indicate that individuals with higher plasma IGF-1 concentrations have an increased risk of colon, lung, breast, and prostate cancer. These findings are supported by animal data, which indicate that IGF-1 functions as a mitogen and an antiapoptotic survival factor (34). In the present study, we show that ADF-100% decreases circulating IGF-1 concentrations to an equal extent as daily 25% CR. These reductions in IGF-1 concentrations showed significant, although modest, correlations with epidermal and mammary epithelial cell proliferation rates. Similar associations between ADF-induced decreases in IGF-1 levels and reduced cell turnover rates were observed previously (6). Classic CR has also been shown to reduce plasma IGF-1 levels while decreasing tumorigenesis (12, 13). Interestingly, the decreases in cell proliferation rates observed in the ADF-85% group were not accompanied by significant reductions in IGF-1 levels. Accordingly, the relation between circulating IGF-1 concentrations and the anti-proliferative effects of modified ADF regimens remains uncertain.
Plasma levels of ghrelin have been shown to increase in response to fasting (35) and prolonged CR (36). During periods of starvation, ghrelin is thought to promote the resumption of feeding by activating hypothalamic neurons (37, 38). Ghrelin has also been shown to be a potent stimulator of GH release (39). These actions are dependent on the octanoyl modification of the third serine residue of ghrelin, which is the form of ghrelin active at the GHSR (39). Accordingly, we quantified the circulating levels of oct ghrelin (active ghrelin) as well as des ghrelin after an 8 h fast in all animals. We found that ADF-100%, but not modified ADF, increased plasma levels of oct ghrelin, relative to controls. Interestingly, this effect on oct ghrelin did not occur in the CR group. These preliminary findings suggest that true ADF is a more potent stimulator of ghrelin release than CR during periods of fasting. It may be speculated that the cyclic intake of food in the ADF-100% animals induced patterned release of ghrelin by the stomach in this group. It will be of interest in future studies to measure diurnal changes in ghrelin levels after 24 h of feasting alternated with 24 h fasting.
In summary, our data demonstrate that a modified ADF regimen, consisting of ad libitum feeding on the feed day alternated with the consumption of 15% of energy needs on the calorie-restricted day, decreases global cell proliferation rates to a similar extent as true ADF and daily CR. Over the course of the study, body weight within the ADF groups remained stable, indicating that these antipromotional effects were mediated by signals other than weight reduction or body fat stores. These effects may be mediated in part by decreases in circulating levels of IGF-1, although IGF-1 levels were not reduced in the modified ADF group. Since allowing some food intake on the calorie-restricted day could increase subject compliance and tolerability of ADF regimens, these findings may have practical implications. Direct confirmation of these observations in human subjects will be necessary before the implications for human health or dietary practices can be judged.
Acknowledgments
We thank S. Florcruz, A. Dang, D. Son, and J. Chang for help with the feeding phase of the study. This work was funded by the Natural Science and Engineering Research Council of Canada and the State of California Discovery (BioStar) Program.
References
- 1.Fontana L, Klein S. Aging, adiposity, and calorie restriction. JAMA. 2007;297:986–994. doi: 10.1001/jama.297.9.986. [DOI] [PubMed] [Google Scholar]
- 2.Stewart JW, Koehler K, Jackson W, Hawley J, Wang W, Au A, Myers R, Birt DF. Prevention of mouse skin tumor promotion by dietary energy restriction requires an intact adrenal gland and glucocorticoid supplementation restores inhibition. Carcinogenesis. 2005;26:1077–1084. doi: 10.1093/carcin/bgi051. [DOI] [PubMed] [Google Scholar]
- 3.Patel AC, Nunez NP, Perkins SN, Barrett JC, Hursting SD. Effects of energy balance on cancer in genetically altered mice. J Nutr. 2004;134:3394S–3398S. doi: 10.1093/jn/134.12.3394S. [DOI] [PubMed] [Google Scholar]
- 4.Jolly CA. Diet manipulation and prevention of aging, cancer and autoimmune disease. Curr Opin Clin Nutr Metab Care. 2005;8:382–387. doi: 10.1097/01.mco.0000172577.56396.7a. [DOI] [PubMed] [Google Scholar]
- 5.Yakar S, Leroith D, Brodt P. The role of the growth hormone/insulin-like growth factor axis in tumor growth and progression: lessons from animal models. Cytokine Growth Factor Rev. 2005;16:407–420. doi: 10.1016/j.cytogfr.2005.01.010. [DOI] [PubMed] [Google Scholar]
- 6.Varady KA, Roohk D, Hellerstein MK. Dose effects of modified alternate-day fasting regimens on in vivo cell proliferation and plasma insulin-like growth factor-1 in mice. J Appl Physiol. 2007;103:547–551. doi: 10.1152/japplphysiol.00209.2007. [DOI] [PubMed] [Google Scholar]
- 7.Hsieh EA, Chai CM, Hellerstein MK. Effects of caloric restriction on cell proliferation in several tissues in mice: role of intermittent feeding. Am J Physiol Endocrinol Metab. 2005;288:E965–972. doi: 10.1152/ajpendo.00368.2004. [DOI] [PubMed] [Google Scholar]
- 8.Rocha NS, Barbisan LF, de Oliveira ML, de Camargo JL. Effects of fasting and intermittent fasting on rat hepatocarcinogenesis induced by diethylnitrosamine. Teratog Carcinog Mutagen. 2002;22:129–138. doi: 10.1002/tcm.10005. [DOI] [PubMed] [Google Scholar]
- 9.Siegel I, Liu TL, Nepomuceno N, Gleicher N. Effects of short-term dietary restriction on survival of mammary ascites tumor-bearing rats. Cancer Invest. 1988;6:677–680. doi: 10.3109/07357908809078034. [DOI] [PubMed] [Google Scholar]
- 10.Varady KA, Roohk D, Loe YC, McEvoy-Hein BK, Hellerstein MK. Effects of modified alternate-day fasting regimens on adipocyte size, triglyceride metabolism and plasma adiponectin levels in mice. J Lipid Res. 2007;48:2212–2219. doi: 10.1194/jlr.M700223-JLR200. [DOI] [PubMed] [Google Scholar]
- 11.Higgins SC, Gueorguiev M, Korbonits M. Ghrelin, the peripheral hunger hormone. Ann Med. 2007;39:116–136. doi: 10.1080/07853890601149179. [DOI] [PubMed] [Google Scholar]
- 12.Mai V, Colbert LH, Berrigan D, Perkins SN, Pfeiffer R, Lavigne JA, Lanza E, Haines DC, Schatzkin A, Hursting SD. Calorie restriction and diet composition modulate spontaneous intestinal tumorigenesis in Apc(Min) mice through different mechanisms. Cancer Res. 2003;63:1752–1755. [PubMed] [Google Scholar]
- 13.Berrigan D, Perkins SN, Haines DC, Hursting SD. Adult-onset calorie restriction and fasting delay spontaneous tumorigenesis in p53-deficient mice. Carcinogenesis. 2002;23:817–822. doi: 10.1093/carcin/23.5.817. [DOI] [PubMed] [Google Scholar]
- 14.Neese RA, Misell LM, Turner S, Chu A, Kim J, Cesar D, Hoh R, Antelo F, Strawford A, McCune JM, Christiansen M, Hellerstein MK. Measurement in vivo of proliferation rates of slow turnover cells by 2H2O labeling of the deoxyribose moiety of DNA. Proc Natl Acad Sci U S A. 2002;99:15345–15350. doi: 10.1073/pnas.232551499. [DOI] [PMC free article] [PubMed] [Google Scholar]
- 15.Hsieh EA, Chai CM, de Lumen BO, Neese RA, Hellerstein MK. Dynamics of keratinocytes in vivo using HO labeling: a sensitive marker of epidermal proliferation state. J Invest Dermatol. 2004;123:530–536. doi: 10.1111/j.0022-202X.2004.23303.x. [DOI] [PubMed] [Google Scholar]
- 16.Nandi S, Guzman RC, Yang J. Hormones and mammary carcinogenesis in mice, rats, and humans: a unifying hypothesis. Proc Natl Acad Sci U S A. 1995;92:3650–3657. doi: 10.1073/pnas.92.9.3650. [DOI] [PMC free article] [PubMed] [Google Scholar]
- 17.Macallan DC, Fullerton CA, Neese RA, Haddock K, Park SS, Hellerstein MK. Measurement of cell proliferation by labeling of DNA with stable isotope-labeled glucose: studies in vitro, in animals, and in humans. Proc Natl Acad Sci U S A. 1998;95:708–713. doi: 10.1073/pnas.95.2.708. [DOI] [PMC free article] [PubMed] [Google Scholar]
- 18.Neese RA, Siler SQ, Cesar D, Antelo F, Lee D, Misell L, Patel K, Tehrani S, Shah P, Hellerstein MK. Advances in the stable isotope-mass spectrometric measurement of DNA synthesis and cell proliferation. Anal Biochem. 2001;298:189–195. doi: 10.1006/abio.2001.5375. [DOI] [PubMed] [Google Scholar]
- 19.Collins ML, Eng S, Hoh R, Hellerstein MK. Measurement of mitochondrial DNA synthesis in vivo using a stable isotope-mass spectrometric technique. J Appl Physiol. 2003;94:2203–2211. doi: 10.1152/japplphysiol.00691.2002. [DOI] [PubMed] [Google Scholar]
- 20.Liu J, Gaylinn BD, Calore JD, Weiner RS, Gordon DA, Thorner MO. A new enzyme-linked immunoassay for acylated and des-acylated ghrelin in plasma. Growth Horm IGF Res. 2004;14:131. [Google Scholar]
- 21.Nelson JF, Felicio LS, Randall PK, Sims C, Finch CE. A longitudinal study of estrous cyclicity in aging C57BL/6J mice: I. Cycle frequency, length and vaginal cytology. Biol Reprod. 1982;27:327–339. doi: 10.1095/biolreprod27.2.327. [DOI] [PubMed] [Google Scholar]
- 22.Merry B, Holehan A. Effects of Diet on Aging. CRC Press; Boca Raton, Florida, USA: 1994. [Google Scholar]
- 23.Hursting SD, Lavigne JA, Berrigan D, Perkins SN, Barrett JC. Calorie restriction, aging, and cancer prevention: mechanisms of action and applicability to humans. Annu Rev Med. 2003;54:131–152. doi: 10.1146/annurev.med.54.101601.152156. [DOI] [PubMed] [Google Scholar]
- 24.Lok E, Nera EA, Iverson F, Scott F, So Y, Clayson DB. Dietary restriction, cell proliferation and carcinogenesis: a preliminary study. Cancer Lett. 1988;38:249–255. doi: 10.1016/0304-3835(88)90016-x. [DOI] [PubMed] [Google Scholar]
- 25.Hursting SD, Perkins SN, Phang JM. Calorie restriction delays spontaneous tumorigenesis in p53-knockout transgenic mice. Proc Natl Acad Sci U S A. 1994;91:7036–7040. doi: 10.1073/pnas.91.15.7036. [DOI] [PMC free article] [PubMed] [Google Scholar]
- 26.Lev-Ran A. Mitogenic factors accelerate later-age diseases: insulin as a paradigm. Mech Ageing Dev. 1998;102:95–113. doi: 10.1016/s0047-6374(98)00027-x. [DOI] [PubMed] [Google Scholar]
- 27.Ikeyama S, Kokkonen G, Martindale JL, Wang XT, Gorospe M, Holbrook NJ. Effects of aging and calorie restriction of Fischer 344 rats on hepatocellular response to proliferative signals. Exp Gerontol. 2003;38:431–439. doi: 10.1016/s0531-5565(02)00239-5. [DOI] [PubMed] [Google Scholar]
- 28.Zhu Z, Jiang W, Thompson HJ. Effect of energy restriction on tissue size regulation during chemically induced mammary carcinogenesis. Carcinogenesis. 1999;20:1721–1726. doi: 10.1093/carcin/20.9.1721. [DOI] [PubMed] [Google Scholar]
- 29.Heilbronn LK, Civitarese AE, Bogacka I, Smith SR, Hulver M, Ravussin E. Glucose tolerance and skeletal muscle gene expression in response to alternate day fasting. Obes Res. 2005;13:574–581. doi: 10.1038/oby.2005.61. [DOI] [PubMed] [Google Scholar]
- 30.Heilbronn LK, Smith SR, Martin CK, Anton SD, Ravussin E. Alternate-day fasting in nonobese subjects: effects on body weight, body composition, and energy metabolism. Am J Clin Nutr. 2005;81:69–73. doi: 10.1093/ajcn/81.1.69. [DOI] [PubMed] [Google Scholar]
- 31.Ma J, Pollak MN, Giovannucci E, Chan JM, Tao Y, Hennekens CH, Stampfer MJ. Prospective study of colorectal cancer risk in men and plasma levels of insulin-like growth factor (IGF)-I and IGF-binding protein-3. J Natl Cancer Inst. 1999;91:620–625. doi: 10.1093/jnci/91.7.620. [DOI] [PubMed] [Google Scholar]
- 32.Giovannucci E. Insulin-like growth factor-I and binding protein-3 and risk of Cancer. Horm Res. 1999;51(Suppl. 3):34–41. doi: 10.1159/000053160. [DOI] [PubMed] [Google Scholar]
- 33.Hankinson SE, Willett WC, Colditz GA, Hunter DJ, Michaud DS, Deroo B, Rosner B, Speizer FE, Pollak M. Circulating concentrations of insulin-like growth factor-I and risk of breast cancer. Lancet. 1998;351:1393–1396. doi: 10.1016/S0140-6736(97)10384-1. [DOI] [PubMed] [Google Scholar]
- 34.Jenkins PJ, Bustin SA. Evidence for a link between IGF-I and cancer. Eur J Endocrinol. 2004;151(Suppl. 1):S17–S22. doi: 10.1530/eje.0.151s017. [DOI] [PubMed] [Google Scholar]
- 35.Tschop M, Smiley DL, Heiman ML. Ghrelin induces adiposity in rodents. Nature. 2000;407:908–913. doi: 10.1038/35038090. [DOI] [PubMed] [Google Scholar]
- 36.Gualillo O, Caminos JE, Nogueiras R, Seoane LM, Arvat E, Ghigo E, Casanueva FF, Dieguez C. Effect of food restriction on ghrelin in normal-cycling female rats and in pregnancy. Obes Res. 2002;10:682–687. doi: 10.1038/oby.2002.92. [DOI] [PubMed] [Google Scholar]
- 37.Nakazato M, Murakami N, Date Y, Kojima M, Matsuo H, Kangawa K, Matsukura S. A role for ghrelin in the central regulation of feeding. Nature. 2001;409:194–198. doi: 10.1038/35051587. [DOI] [PubMed] [Google Scholar]
- 38.Lawrence CB, Snape AC, Baudoin FM, Luckman SM. Acute central ghrelin and GH secretagogues induce feeding and activate brain appetite centers. Endocrinology. 2002;143:155–162. doi: 10.1210/endo.143.1.8561. [DOI] [PubMed] [Google Scholar]
- 39.Kojima M, Hosoda H, Date Y, Nakazato M, Matsuo H, Kangawa K. Ghrelin is a growth-hormone-releasing acylated peptide from stomach. Nature. 1999;402:656–660. doi: 10.1038/45230. [DOI] [PubMed] [Google Scholar]