Abstract
Adiabatic pulses are a special class of radio frequency (RF) pulses that may be used to achieve uniform flip angles in the presence of a nonuniform B1 field. In this work, we present a new, systematic method for designing high-bandwidth (BW), low-peak-amplitude adiabatic RF pulses that utilizes the Shinnar–Le Roux (SLR) algorithm for pulse design. Currently, the SLR algorithm is extensively employed to design nonadiabatic pulses for use in magnetic resonance imaging and spectroscopy. We have adapted the SLR algorithm to create RF pulses that also satisfy the adiabatic condition. By overlaying sufficient quadratic phase across the spectral profile before the inverse SLR transform, we generate RF pulses that exhibit the required spectral characteristics and adiabatic behavior. Application of quadratic phase also distributes the RF energy more uniformly, making it possible to obtain the same spectral BW with lower RF peak amplitude. The method enables the pulse designer to specify spectral profile parameters and the degree of quadratic phase before pulse generation. Simulations and phantom experiments demonstrate that RF pulses designed using this new method behave adiabatically.
Keywords: adiabatic, Shinnar-Le Roux, RF pulse, quadratic phase, bandwidth, algorithm
Adiabatic pulses are a special class of radio frequency (RF) pulses that provide B1-insensitive rotation of the magnetization. They have been used extensively in magnetic resonance imaging (MRI) to provide immunity to the nonuniform B1-fields generated by surface coils (1–12). They are also powerful replacements for standard RF pulses in pulse sequences used for high-field MRI and spectroscopy (12–21). B1 inhomogeneity increases significantly at high field strengths, such as 7 Tesla (7T), as the RF operating wavelength approaches the size of the human organ being imaged. Adiabatic pulses make it possible to gain some immunity to these B1 variations. The adiabatic threshold is defined as the amplitude of the adiabatic RF pulse above which a uniform flip angle is achieved irrespective of changes in the B1 field. The degree of immunity to B1 variation is dependent on the percentage by which the amplitude of the pulse may be increased above the adiabatic threshold before reaching the limit of the RF coil/amplifier combination. Thus, when utilizing adiabatic pulses, particularly at high-magnetic fields, low-peak RF amplitude pulse designs are desirable.
Adiabatic pulses are amplitude and frequency modulated pulses that satisfy the adiabatic condition over the desired frequency band for the duration of the pulse. The most widely used adiabatic pulse design is the hyperbolic secant (HS) (22–24) pulse, which employs hyperbolic secant and hyperbolic tangent amplitude and frequency modulation functions, respectively. Several other amplitude and frequency modulated pulses have been proposed (1,3–5,13,25–38). Profile characteristics such as bandwidth (BW) and selectivity may be adjusted by changing certain parameters in the modulation functions that affect the modulation angular frequency, maximum B1 field, and truncation of the pulse. Care must be taken to adjust these parameters without violating the adiabatic condition. Pulses designed using numerically optimized modulation functions (39) or modulation functions that satisfy offset-independent adiabaticity (40,41) may be used to broaden the BW of adiabatic pulses, while minimizing the peak RF power. Gradient modulation may also be used to reduce the peak RF, while maintaining adiabaticity (23,28,36).
In this work, we present a new, systematic method for designing high-BW, low-peak-amplitude adiabatic pulses by using the Shinnar–Le Roux (SLR) algorithm (42) for pulse design. Currently, the SLR algorithm is extensively employed to design nonadiabatic pulses for use in MRI and spectroscopy sequences. We have adapted the SLR algorithm to create RF pulses that also satisfy the adiabatic condition over the desired spectral profile. An interesting characteristic of adiabatic pulses is that they generate a spectral profile with quadratic phase which, in the presence of a linear gradient, is the slice profile. By overlaying sufficient quadratic phase across the spectral profile before the inverse SLR transform, we were able to generate RF pulses that exhibited the required spectral characteristics and adiabatic behavior.
Using this new method, it is possible for the user to specify the spectral profile characteristics (e.g., BW and fractional transition width) and the degree of quadratic phase before using the inverse SLR transform to generate the corresponding adiabatic RF pulse. The use of the SLR algorithm to produce nonadiabatic quadratic-phase RF pulses has been previously proposed (43,44). These pulses were designed to achieve high selectivity and broad BW for use in saturation or inversion. However, the pulses were not designed to be adiabatic. The SLR transform has also been used to design quasi-adiabatic RF pulses (45) that show some immunity to B1 variations. In these techniques, quadratic phase was applied to the pulse to distribute the RF energy more equally, hence reducing peak RF amplitude. Our method employs quadratic phase in a similar manner to distribute RF energy, while maintaining adiabaticity. In this work, we will focus on adiabatic full passage pulses that may be used as inversion pulses or as spin-echo pulses.
METHODS
Overview of Design Algorithm
The SLR algorithm reduces the problem of pulse design into that of designing two polynomials, An(z) and Bn(z), which may be reversibly transformed to yield the RF pulse (42). The polynomials An(z) and Bn(z) may be represented by finite impulse response (FIR) filters and therefore may be generated using standard filter design algorithms. When designing the polynomials for a RF pulse, it is sufficient to first design a Bn(z) polynomial with a frequency response that is equal to the desired spectral profile and then generate a matching minimum-phase An(z) polynomial, which results in a minimum-energy RF pulse. (42).
One property of adiabatic pulses is that they generate a spectral profile with quadratic phase. This is because the phase of the adiabatic RF pulse itself is a quadratic function, which produces a frequency sweep that satisfies the adiabatic condition. We found that when the Bn(z) polynomial is set to the response of a linear phase FIR filter modulated with a properly chosen amount of quadratic phase, the inverse SLR transform yields an RF pulse that is remarkably adiabatic. Not all quadratic phase pulses are adiabatic. However, if quadratic phase is added such that the frequency sweep varies slowly enough to satisfy the adiabatic condition, the pulse can be made adiabatic. Characteristics of the spectral profile such as BW, transition width, and ripple in the passband and stopband are set as inputs to the FIR filter design algorithm. In our case, this algorithm is a least-square algorithm, however an equiripple Parks–McClellan algorithm could be used as well. There may be some differences in the adiabatic behavior for pulses generated using these two algorithms.
In our design algorithm, we use a and b to denote the coefficients of the (n − 1)-order polynomials, An(z) and Bn(z), in the discrete time domain.
| [1] |
The discrete Fourier transforms of a and b are equivalent to the profiles of the polynomials evaluated along frequency.
Pulse Design
A linear phase version of the desired spectral profile is found using the firls function in MATLAB (The Math-works, Natick, MA). firls designs a linear phase FIR filter that minimizes the weighted, integrated squared error between an ideal piecewise linear function and the magnitude response of the filter over a set of desired frequency bands. We begin by setting the sampling rate, fs, in Hz for the filter. fs is required to calculate the physical spectral BW of the pulse, a fundamental quantity that is set before application of quadratic phase. fs determines the sampling period of the pulse, ΔT, in seconds.
| [2] |
Similar to standard SLR pulse design, parameters such as the ripple in the passband and stopband, normalized spectral BW and transition band width are chosen and set as inputs to the firls function. An asymmetric profile may also be specified at this time. The vector inputs to the firls function are given by
| [3] |
where N is the number of samples. F is a vector of frequency band edges given in the range [0, π] but normalized to [0,1] with ωp and ωs denoting the passband and stopband edge angular frequencies. The vector A specifies the desired amplitude of the frequency response of the resultant filter and, in this case, is set for a lowpass filter. W contains the relative ripple amplitudes in the passband and stopband given by δp and δs, respectively. ωp and ωs must be chosen so that the required spectral selectivity is achieved while keeping ripple in the passband and stopband within set limits (42).
The normalized spectral BW for the pulse is given by
| [4] |
and the fractional transition width is
| [5] |
The physical spectral BW in Hz, , is given by
| [6] |
The FIR filter produced by the firls function is zero padded to Ntotal samples and the inverse FT is taken to yield the linear phase spectral profile, Flp(ω). Zero padding is performed to increase the sampling resolution of Flp(ω).
| [7] |
Quadratic phase is overlaid on the linear phase spectral profile as given in Eq. [8], to obtain the final spectral profile, F(ω). The constant, k, determines the number of cycles of quadratic phase that are applied across the spectral profile.
| [8] |
The optimal value of k depends on the transition band width of Flp. The value of k determines the amount of quadratic phase that is applied and therefore the degree by which the RF energy is uniformly distributed over the pulse.
We found empirically that a k value that satisfies Eq. [9] results in sufficient phase applied across the transition bands of the spectral profile. A k value that is significantly below this limit results in the distortion of transition bands at low B1 values, thus reducing the B1 range over which the pulse behaves adiabatically. Equation 9 provides an approximate value for k and it is recommended that a few design iterations during the simulation stage be performed to arrive at the optimal k value for a chosen set of parameters.
| [9] |
The FIR filter given in 3 is of length N + 1. If no quadratic phase were applied, the resultant linear phase SLR pulse would be of duration (N + 1)ΔT (42). The duration of the pulse is inversely related to the effective transition width.
The polynomial coefficients b are given by the Fourier transform of the spectral profile:
| [10] |
A matching minimum-phase An(z) polynomial is then calculated for the Bn(z) polynomial with coefficients b (42). Once An(z) and Bn(z) are specified, an RF waveform is found by applying the inverse SLR transform.
| [11] |
The pulse is truncated to the number of samples, Npulse, chosen such that
| [12] |
where B1,peak is the peak amplitude of the RF waveform. That is, the B1 amplitude at the end of the pulse should be less than 5% of the peak B1 value. Our simulations showed that truncating the pulse to a duration that is smaller than this value significantly degrades the adiabatic behavior. The pulse needs to be truncated because the final duration of the pulse, or equivalently the portion of the waveform generated by Eq. [11] over which the RF energy is spread, is determined by the amount of applied quadratic phase. The final pulse duration, T, is
| [13] |
The complete method is summarized in the flow chart shown in Fig. 1.
FIG. 1.

Flowchart illustrating main steps in the adiabatic SLR algorithm. The linear phase spectral profile is set to be the Fourier transform of a FIR filter produced by the firls function in MAT-LAB. Quadratic phase is overlaid on the linear phase profile. The coefficients b for the Bn (z) polynomial are set to the Fourier transform of the final spectral profile. A minimum-phase An (z) polynomial is calculated. Once An (z) and Bn (z) are specified, they are set as inputs to the inverse SLR transform and the output is truncated to produce the final RF pulse.
Parameter Relationships
The peak B1 and time-bandwidth (TBW) product of the adiabatic SLR pulse are related to the peak B1 and TBW product of the 180° linear phase SLR pulse generated by the FIR filter, if no quadratic phase were applied. Using this algorithm, once the physical spectral BW is set, the initial values for peak B1 and TBW are those of the linear phase SLR pulse (42). The application of quadratic phase increases the pulse duration, T, and decreases the peak B1 value. The physical spectral BW and the selectivity of the profile remain the same. We found that the peak B1 is approximately inversely proportional to the square root of k and T is approximately proportional to k.
Variations on Pulse Design
Our simulations show that multiplying b in Eq. [10] with a constant scaling factor, 0 < c ≤ 1, generates an RF pulse with a slightly different shape and peak amplitude at adiabatic threshold. However, the spectral profile and B1-insensitivity when operating above the adiabatic threshold are similar. This variant of b is given in Eq. [14].
| [14] |
As c approaches 1, the RF pulse approaches the SLR design described in “Pulse Design” section. As c is reduced below 1, the generated RF pulse becomes similar to a Fourier design. The Fourier design refers to setting the RF pulse equivalent to a scaled version of the polynomial coefficients b in Eq. [10], without performing the SLR transform.
Above the adiabatic threshold, both the SLR and Fourier design result in B1-insensitive spectral profiles. The selectivity of the spectral profile produced by the SLR design is consistent with the parameter values used to generate fFIR. The Fourier design generates a spectral profile with marginally thinner transition bands and is therefore more selective. Below the adiabatic threshold, the spectral profile of the Fourier designed RF pulse develops winglike distortions at the edges of the passband that become more pronounced as the amplitude approaches adiabatic threshold. The ripple in the central portion of the passband is lower in the Fourier design when compared with the SLR design. The spectral profile of the SLR pulse retains its shape more faithfully when underdriven, with ripple values in the passband matching those specified for fFIR. Therefore, we have chosen to use the SLR design (i.e., set c = 1) for the pulses in this article. However, the option of using this scaled b design is available to the pulse designer.
Simulations
An example adiabatic pulse was designed to validate the method outlined in “Pulse Design” section. The pulse was designed to have physical spectral BW of 9.8 kHz, pulse duration of 12 msec, and FTW of 0.21. fs was set to 119 kHz. Values used as inputs for the firls function are
| [15] |
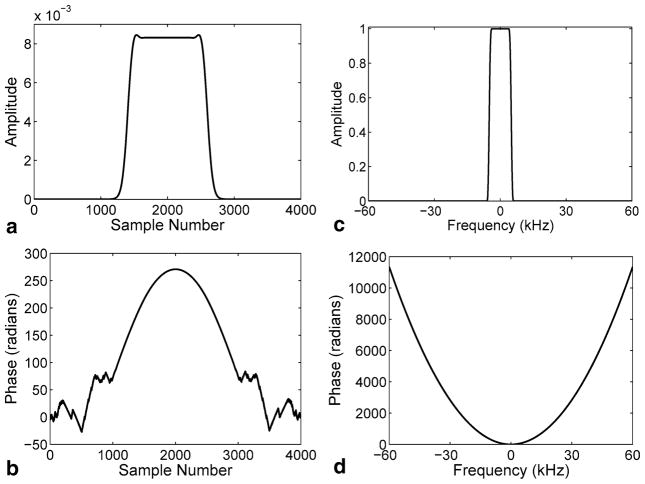
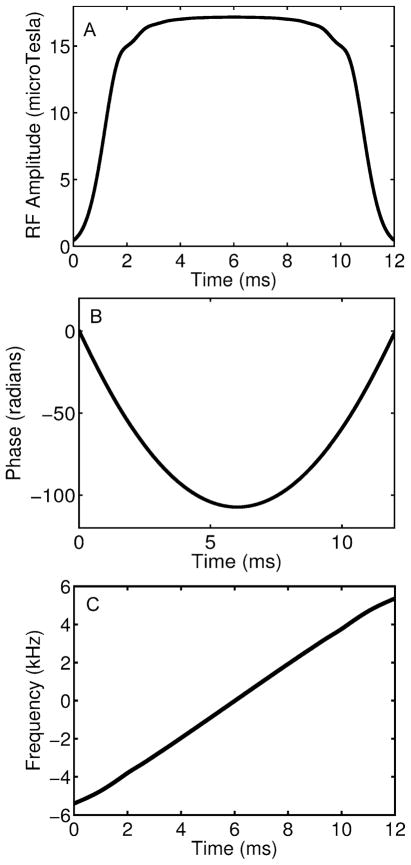
We zero padded the output of the firls function to have Ntotal = 4, 000 samples. A k value of 1,150 was used and the RF waveform was truncated to 12 msec. Fig. 2a,b shows plots of the amplitude and phase of the resultant polynomial coefficients b. The amplitude and phase of the Fourier transform of b, or equivalently, the profile of the Bn(z) polynomial evaluated along frequency are shown in Fig. 2c, d. The magnitude, phase, and frequency waveforms for the adiabatic SLR pulse are shown in Fig. 3. The peak amplitude of the pulse is 17.2 μT. Frequency varies approximately linearly at a rate that satisfies the adiabatic condition for the duration of the pulse.
FIG. 2.
(a) Magnitude and (b) phase of the polynomial coefficients b created by overlaying quadratic phase on the filter that is output by the firls function. (c) Magnitude and (d) phase of the Fourier transform of b. The profile in (c) is the desired spectral profile for the resultant RF pulse.
FIG. 3.
(a) Amplitude, (b) phase, and (c) frequency waveforms for adiabatic SLR pulse with optimal quadratic phase and spectral bandwidth of 9.8 kHz. Frequency varies approximately linearly at a rate that does not violate the adiabatic condition.
Simulations were performed in MATLAB by explicitly multiplying the rotation matrices to obtain the spectral profile of the pulse. In the presence of a slice-select gradient, this is equivalent to the slice profile. T1 and T2 effects were neglected. The spin-echo and inversion profile were simulated for the exemplary RF pulse shown in Fig. 3. The magnitude and phase of the spin-echo profile and the magnitude of the inversion profile were plotted. When used as a single pulse with crusher gradients to produce a spin-echo, the spin-echo profile, Mse, is the spectral profile that is multiplied by the transverse magnetization. When used as an inversion pulse, the inversion profile, Minv, is the spectral profile of the longitudinal magnetization (42). The relationship between the two profiles is given by Minv = 1 − 2|Mse|. Given these definitions, the spectral BW for the two profiles are equivalent.
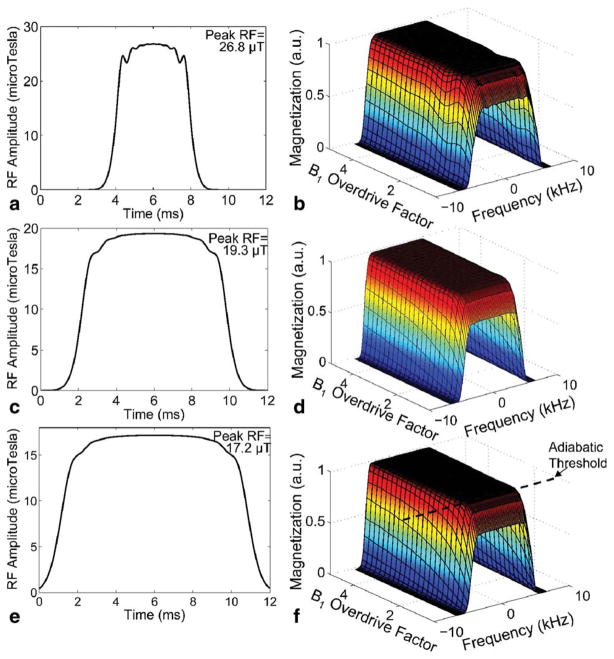
To study the effects of varying applied quadratic phase, RF pulses were generated using the inputs in Eq. [15] for k values ranging from 450 to 1,150. Spectral profiles for a range of B1 overdrive factors above adiabatic threshold were simulated for each pulse and compared. The B1 overdrive factor is equal to the amplitude at which we operate the pulse divided by the amplitude of the pulse at adiabatic threshold. Therefore, a B1 overdrive factor of 1.5 would mean a 50% increase of pulse amplitude above the adiabatic threshold. Spectral profiles were simulated for B1 overdrive factors from 0.5 to 5 to show behavior of the pulse below and above adiabatic threshold.
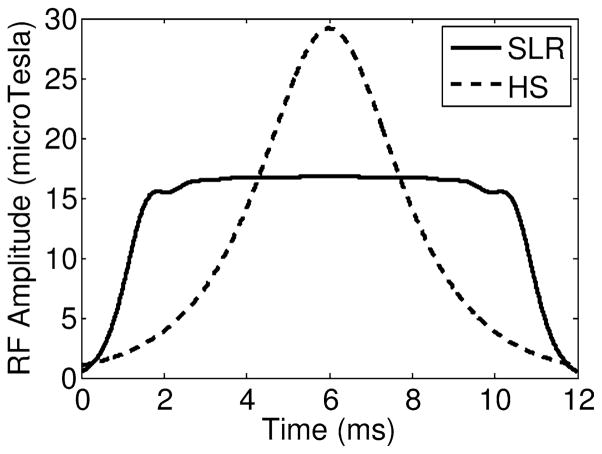
A HS and adiabatic SLR pulse with the same physical spectral BW were generated and the peak RF amplitudes of the pulses were compared.
Phantom Experiments
Phantom experiments were conducted using a standard transmit/receive birdcage head coil at 3 T (Whole-body magnet; GE Healthcare, Waukesha, WI) to validate the pulse performance. Because we were limited by the maximum output of our RF coil/amplifier combination, we used a pulse designed to have a physical spectral BW of 5 kHz and consequently reduced peak RF amplitude of 12.8 μT when compared with the 9.8 kHz pulse shown in Fig. 3. This way, it was possible to overdrive the pulse to check a larger range of adiabatic behavior and better illustrate the pulse performance experimentally. The passband and stop-band edge angular frequencies set as inputs to the firls function were δp = 0.03π and δs = 0.058π, respectively. The k value used was 2,000, which was chosen to be greater than the minimum k required to generate an undistorted profile to uniformly spread the RF energy over the targeted 12 msec pulse duration.
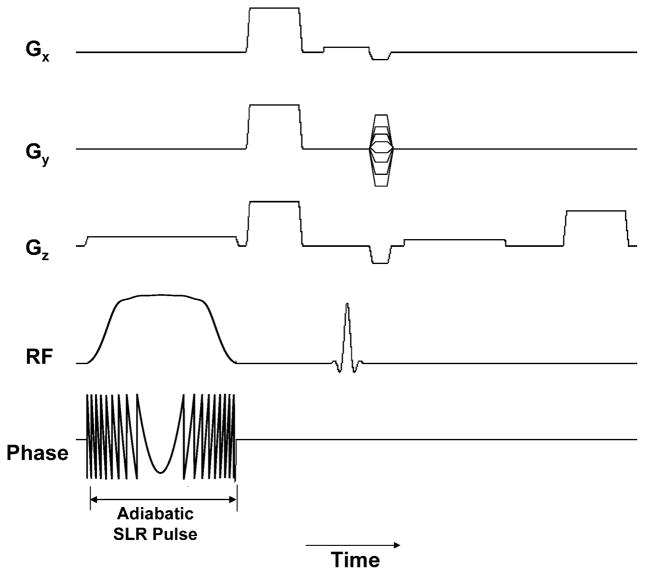
The pulse was added to a standard gradient recalled echo (GRE) sequence as an inversion pulse before the 90° excitation pulse. The amplitude and phase waveforms for the pulse are shown in the pulse sequence diagram in Fig. 4. A slice-selective gradient was played in conjunction with the pulse to invert a 14-mm slice. Frequency and phase encoding dimensions for the GRE sequence were both set to be orthogonal to the excited slice to provide an image of the inversion slice profile. A spherical water phantom was imaged. Several images were obtained with the inversion pulse amplitude set to the nominal B1 (at approximately the adiabatic threshold) and at 25, 50, 75, and 100% above the nominal B1 value. These were subtracted from an image obtained without the adiabatic inversion pulse. Because the objective was to measure the inversion profile for the pulse, a long repetition time (TR) of 5,500 msec was used to allow for full T1 relaxation between pulse applications so that the signal-to-noise ratio of the measurement could be maximized. Acquisition parameters were: TE/TR= 9/5,500 msec, matrix size = 256 × 128, F0V = 24 × 24 cm2 and scan time = 11 : 44 min.
FIG. 4.
RF, phase, and gradient waveforms for the pulse sequence which uses the adiabatic SLR pulse for inversion. The inversion pulse is selective in the z dimension; the 90° excitation pulse is selective in x dimension; the readout gradient is applied in z dimension; and the phase encodes are applied in the y dimension. The image is acquired with the inversion pulse turned on and subtracted from an image acquired with the inversion pulse turned off. In the subtracted image, the inverted slice will appear bright and all other signal will be suppressed.
RESULTS
Simulation Results
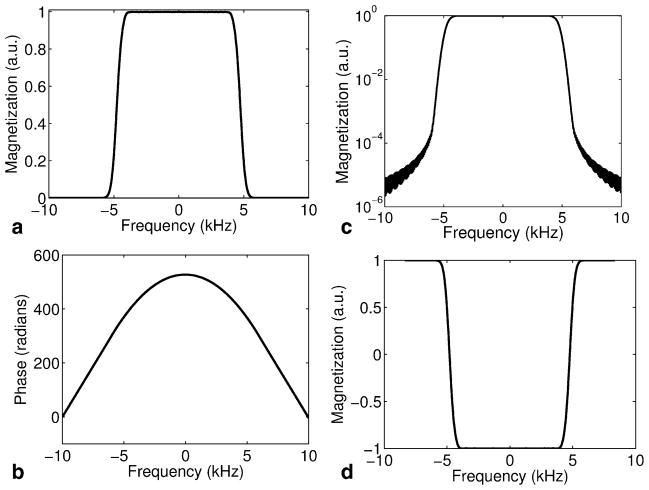
Figure 5a, b shows the magnitude and phase of the simulated spectral profile for the pulse in Fig. 3, when used as a spin-echo pulse. B1 is set to 10% above the adiabatic threshold. As expected, the phase of the spectral profile is quadratic. The log plot of the profile is shown in Fig. 5c. The inversion profile for the pulse is shown in Fig. 5d.
FIG. 5.
(a) Magnitude, (b) phase and (c) log of the magnitude of the magnetization profile simulated for the adiabatic SLR pulse in Fig. 3, when used as a spin-echo pulse. (d) Inversion profile when the pulse is used for inversion of magnetization.
The amplitude of RF pulses generated using a k value of 450, 900, and 1,150 and the simulated spectral profiles over a range of B1 values for each pulse and are shown in Fig. 6. The durations of the RF pulses are 5.1, 9.3, and 12 msec, respectively. As B1 is reduced below the adiabatic threshold, the spectral profile shape does not vary significantly from that at the adiabatic threshold. As the k value reduces below 900, distortion in the transition bands at low B1 values above the adiabatic threshold increases proportionately. At adiabatic threshold, the ripple in the stopband and passband is similar to that of a standard least-square SLR pulse designed using the vector inputs in Eq. [15]. For all k values, there is some increase in the width of the transition band and reduction in passband ripple as B1 increases. RF energy is more uniformly distributed as the k value is increased, resulting in a reduced RF peak amplitude and increased effective pulse duration. A k value of 1,150 resulted in the 12 msec RF pulse shown in Fig. 3, which demonstrates robust adiabaticity and spectral profile integrity.
FIG. 6.
RF pulse shape and adiabatic behavior for different amounts of applied quadratic phase (i.e., k values). The amplitude waveforms of the adiabatic SLR pulses and corresponding spectral spin-echo profiles versus B1 overdrive factor for k values of (a, b) 450, (c, d) 900, and (e, f) 1,150 are shown. Profiles were simulated for B1 overdrive factors from 0.5 to 5 to demonstrate profile behavior below and above the adiabatic threshold. As k values are decreased below 900, distortion of the transition bands near the edges of the passband increases for B1 values above but close to the adiabatic threshold. RF peak amplitude decreases and effective pulse duration increases with k. The durations of the RF pulses are 5.1, 9.3, and 12 msec, respectively.
Comparative HS and adiabatic SLR pulses are shown in Fig. 7. Both pulses have a physical spectral BW of 9.8 kHz. However, the RF peak amplitude of the HS pulse is 74% greater than the comparative adiabatic SLR pulse. Note that, although the adiabatic SLR pulse shown in Fig. 7 was designed to generate a profile with thinner transition bands than the pulse in Fig. 3, the HS pulse still achieves a spectral profile with thinner transition band widths. Specific absorption rate values for the two pulses are similar.
FIG. 7.
Hyperbolic secant (HS) pulse compared with an adiabatic SLR pulse with similar bandwidth. The HS pulse requires 74% greater peak RF amplitude.
Phantom Results
Phantom image magnitudes are shown in Fig. 8 for the acquisition using the pulse sequence in Fig. 4 without the inversion pulse, with the inversion pulse at adiabatic threshold, with the inversion pulse at 50% above adiabatic threshold and with the inversion pulse at 100% above the adiabatic threshold. All images are windowed equivalently. Vertical cross-sections through the center of all images obtained are plotted against B1 in Fig. 8e. Profiles are largely invariant for different values of B1, illustrating adiabatic behavior.
FIG. 8.
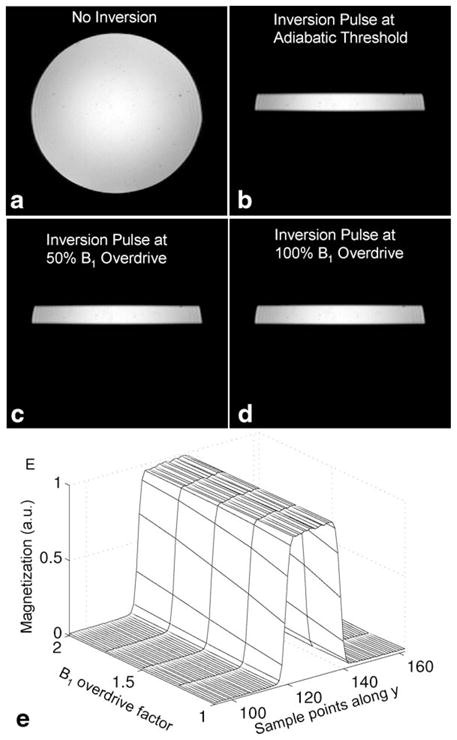
Results obtained from a spherical agar phantom at 3 T using the pulse sequence in Fig. 4. (a) Image of a slice through the phantom with adiabatic inversion pulse turned off. Images of same slice with inversion pulse played at (b) the adiabatic threshold, (c) 50% above the adiabatic threshold, and (d) 100% above the adiabatic threshold, subtracted from image in (a). (e) Vertical cross-sections of the phantom images of the inverted band plotted against B1 value of adiabatic SLR inversion pulse. The inverted band is B1-independent.
DISCUSSION
In this work, we present the first design algorithm that uses the SLR transform to generate adiabatic pulses. Simulations and phantom experiments demonstrate that the pulses generated using this new method behave adiabatically. Our method enables the pulse designer to specify the spectral profile characteristics (e.g., BW and fractional transition width) and the degree of quadratic phase before using the inverse SLR transform to generate the corresponding adiabatic RF pulse. Increasing the degree of quadratic phase distributes RF energy more evenly, resulting in a lower RF peak amplitude. This method is very similar to that described for saturation pulses in (43). However, those pulses were optimized for equiripple behavior and not for adiabaticity.
The method requires calculation of the related polynomials for the pulse. Once these polynomials are available, it is possible to design a matched 90° pulse or an adiabatic self-refocused pulse (46) as the polynomials that describe these pulses are functions of those used to generate the original adiabatic 180° pulse. However, further investigation on how to retain phase-refocusing for the final spin echo as B1 is varied is still required. These pulses may also be divided into adiabatic half passage segments and used to compose a BIR-4 pulse for B1-independent rotation.
The quadratic phase applied to the spectral profile of the pulses, we have presented, was generated by taking the square of a linear frequency sweep. We tested different functions for the frequency sweep, including a hyperbolic tangent variation, but did not find a significant advantage. Continued optimization of the applied quadratic phase function is a subject of future research.
In conclusion, we have designed and implemented a method to generate adiabatic RF pulses using the SLR transform. Using this method, the spectral profile characteristics and the degree of quadratic phase may be explicitly specified before the generation of the pulse.
Acknowledgments
NIH; Grant numbers: RR09784, R01 MH080913 Grant Sponsors: GE Healthcare, The Lucas Foundation
References
- 1.Bendall MR, Pegg DT. Uniform sample excitation with surface coils for in vivo spectroscopy by adiabatic rapid half passage. J Magn Reson. 1986;67:376–381. [Google Scholar]
- 2.de Graaf RA, Nicolay K, Garwood M. Single-shot, B1-insensitive slice selection with a gradient-modulated adiabatic pulse, BISS-8. Magn Reson Med. 1996;35:652–657. doi: 10.1002/mrm.1910350505. [DOI] [PubMed] [Google Scholar]
- 3.Garwood M, Ke Y. Symmetric pulses to induce arbitrary flip angles with compensation for RF inhomogeneity and resonance offsets. J Magn Reson. 1991;94:511–525. [Google Scholar]
- 4.Johnson J, Garwood M, Ugurbil K. Slice selection with gradient modulated adiabatic excitation despite the presence of large B1 inhomogeneities. J Magn Reson. 1989;81:653–660. [Google Scholar]
- 5.Staewen RS, Johnson AJ, Ross BD, Parrish T, Merkle H, Garwood M. 3-D FLASH imaging using a single surface coil and a new adiabatic pulse, BIR-4. Invest Radiol. 1990;25:559–567. doi: 10.1097/00004424-199005000-00015. [DOI] [PubMed] [Google Scholar]
- 6.Garwood M, Ugurbil K, Rath AR, Bendall MR, Ross BD, Mitchell SL, Merkle H. Magnetic resonance imaging with adiabatic pulses using a single surface coil for RF transmission and signal detection. Magn Reson Med. 1989;9:25–34. doi: 10.1002/mrm.1910090105. [DOI] [PubMed] [Google Scholar]
- 7.Lee JN, Parker DL. MR angiography with adiabatic flow excitation. J Magn Reson Imaging. 1992;2:431–436. doi: 10.1002/jmri.1880020412. [DOI] [PubMed] [Google Scholar]
- 8.Mlynárik V, Gruber S, Starcuk Z, Starcuk Z, Jr, Moser E. Very short echo time proton MR spectroscopy of human brain with a standard transmit/receive surface coil. Magn Reson Med. 2000;44:964–967. doi: 10.1002/1522-2594(200012)44:6<964::aid-mrm19>3.0.co;2-x. [DOI] [PubMed] [Google Scholar]
- 9.Ouwerkerk R, Weiss RG, Bottomley PA. Measuring human cardiac tissue sodium concentrations using surface coils, adiabatic excitation, and twisted projection imaging with minimal T2 losses. J Magn Reson Imaging. 2005;21:546–555. doi: 10.1002/jmri.20322. [DOI] [PubMed] [Google Scholar]
- 10.Schupp DG, Merkle H, Ellermann JM, Ke Y, Garwood M. Localized detection of glioma glycolysis using edited 1H MRS. Magn Reson Med. 1993;30:18–27. doi: 10.1002/mrm.1910300105. [DOI] [PubMed] [Google Scholar]
- 11.van Cauteren M, Miot F, Segebarth CM, Eisendrath H, Osteaux M, Willem R. Excitation characteristics of adiabatic half-passage RF pulses used in surface coil MR spectroscopy. Application to 13C detection of glycogen in the rat liver. Phys Med Biol. 1992;37:1055–1064. doi: 10.1088/0031-9155/37/5/003. [DOI] [PubMed] [Google Scholar]
- 12.Yongbi MN, Ding S, Dunn JF. Fat suppression at 7T using a surface coil: Application of an adiabatic half-passage chemical shift selective radiofrequency pulse. J Magn Reson Imaging. 1995;5:768–772. doi: 10.1002/jmri.1880050625. [DOI] [PubMed] [Google Scholar]
- 13.de Graaf RA, Luo Y, Garwood M, Nicolay K. B1-insensitive, single-shot localization and water suppression. J Magn Reson B. 1996;113:35–45. doi: 10.1006/jmrb.1996.0152. [DOI] [PubMed] [Google Scholar]
- 14.Bartha R, Michaeli S, Merkle H, Adriany G, Andersen P, Chen W, Ugurbil K, Garwood M. In vivo 1H2O T2+ measurement in the human occipital lobe at 4T and 7T by carrpurcell MRI: Detection of microscopic susceptibility contrast. Magn Reson Med. 2002;47:742–750. doi: 10.1002/mrm.10112. [DOI] [PubMed] [Google Scholar]
- 15.Laurent WM, Bonny JM, Renou JP. Imaging of water and fat fractions in high-field MRI with multiple slice chemical shift-selective inversion recovery. J Magn Reson Imaging. 2000;12:488–496. doi: 10.1002/1522-2586(200009)12:3<488::aid-jmri15>3.0.co;2-5. [DOI] [PubMed] [Google Scholar]
- 16.Pfeuffer J, van de Moortele PF, Yacoub E, Shmuel A, Adriany G, Andersen P, Merkle H, Garwood M, Ugurbil K, Hu X. Zoomed functional imaging in the human brain at 7 Tesla with simultaneous high spatial and high temporal resolution. Neuroimage. 2002;17:272–286. doi: 10.1006/nimg.2002.1103. [DOI] [PubMed] [Google Scholar]
- 17.Luo Y, de Graaf RA, DelaBarre L, Tannus A, Garwood M. BISTRO: An outer-volume suppression method that tolerates RF field inhomogeneity. Magn Reson Med. 2001;45:1095–1102. doi: 10.1002/mrm.1144. [DOI] [PubMed] [Google Scholar]
- 18.Kinchesh P, Ordidge RJ. Spin-echo MRS in humans at high field: LASER localisation using FOCI pulses. J Magn Reson. 2005;175:30–43. doi: 10.1016/j.jmr.2005.03.009. [DOI] [PubMed] [Google Scholar]
- 19.Balchandani P, Pauly J, Spielman DM. Interleaved narrow-band PRESS sequence with adiabatic spatial-spectral refocusing pulses for 1H MRSI at 7T. Magn Reson Med. 2008;59:973–979. doi: 10.1002/mrm.21539. [DOI] [PMC free article] [PubMed] [Google Scholar]
- 20.Madhuranthakam AJ, Busse RF, Brittain JH, Rofsky NM, Alsop DC. B1-insensitive fast spin echo using adiabatic square wave enabling of the echo train (SWEET) excitation. Magn Reson Med. 2008;59:1386–1393. doi: 10.1002/mrm.21630. [DOI] [PubMed] [Google Scholar]
- 21.Scheenen TW, Heerschap A, Klomp DW. Towards 1H-MRSI of the human brain at 7T with slice-selective adiabatic refocusing pulses. MAGMA. 2008;21:95–101. doi: 10.1007/s10334-007-0094-y. [DOI] [PMC free article] [PubMed] [Google Scholar]
- 22.Silver MS, Joseph RI, Hoult DI. Highly selective π/2 and π pulse generation. J Magn Reson. 1984;59:347–351. [Google Scholar]
- 23.Baum J, Tycko R, Pines A. Broadband and adiabatic inversion of a two-level system by phase-modulated pulses. Phys Rev A. 1985;32:3435–3447. doi: 10.1103/physreva.32.3435. [DOI] [PubMed] [Google Scholar]
- 24.Silver MS, Joseph RI, Hoult DI. Selective spin inversion in nuclear magnetic resonance and coherent optics through an exact solution of the Bloch-Riccati equation. Phys Rev A. 1985;31:2753–2755. doi: 10.1103/physreva.31.2753. [DOI] [PubMed] [Google Scholar]
- 25.Kupce E, Freeman R. Adiabatic pulses for wideband inversion and broadband decoupling. J Magn Reson A. 1995;115:273–276. [Google Scholar]
- 26.Hardy CJ, Edelstein WA, Vatis D. Efficient adiabatic fast passage for NMR population-inversion in the presence of radiofrequency field inhomogeneity and frequency offsets. J Magn Reson. 1986;66:470–482. [Google Scholar]
- 27.Böhlen JM, Rey M, Bodenhausen G. Refocusing with chirped pulses for broadband excitation without phase dispersion. J Magn Reson. 1989;84:191–197. [Google Scholar]
- 28.Conolly S, Glover G, Nishimura D, Macovski A. A reduced power selective adiabatic spin-echo pulse sequence. Magn Reson Med. 1991;18:28–38. doi: 10.1002/mrm.1910180105. [DOI] [PubMed] [Google Scholar]
- 29.Ke Y, Schupp DG, Garwood M. Adiabatic DANTE sequences for B1-insensitive narrowband inversion. J Magn Reson. 1992;96:663–669. [Google Scholar]
- 30.Skinner TE, Robitaille PML. Adiabatic excitation using sin2 amplitude and cos2 frequency modulation functions. J Magn Reson A. 1993;103:34–39. [Google Scholar]
- 31.Kupce E, Freeman R. Stretched adiabatic pulses for broadband spin inversion. J Magn Reson A. 1995;117:246–256. [Google Scholar]
- 32.Rosenfeld D, Zur Y. A new adiabatic inversion pulse. Magn Reson Med. 1996;36:124–136. doi: 10.1002/mrm.1910360121. [DOI] [PubMed] [Google Scholar]
- 33.Rosenfeld D, Panfil SL, Zur Y. Analytic solutions of the Bloch equation involving asymmetric amplitude and frequency modulations. Phys Rev A. 1996;54:2439–2443. doi: 10.1103/physreva.54.2439. [DOI] [PubMed] [Google Scholar]
- 34.Rosenfeld D, Panfil SL, Zur Y. Design of adiabatic pulses for fat-suppression using analytic solutions of the Bloch equation. Magn Reson Med. 1997;37:793–801. doi: 10.1002/mrm.1910370524. [DOI] [PubMed] [Google Scholar]
- 35.Shen J. Use of amplitude and frequency transformations to generate adiabatic pulses of wide bandwidth and low RF power deposition. J Magn Reson B. 1996;112:131–140. doi: 10.1006/jmrb.1996.0123. [DOI] [PubMed] [Google Scholar]
- 36.Ordidge RJ, Wylezinska M, Hugg JW, Butterworth E, Franconi F. Frequency offset corrected inversion (FOCI) pulses for use in localized spectroscopy. Magn Reson Med. 1996;36:562–566. doi: 10.1002/mrm.1910360410. [DOI] [PubMed] [Google Scholar]
- 37.Mitschang L, Ittermann B, Schubert F, Rinneberg H. Design of a constant adiabaticity pulse for selective population inversion. J Magn Reson. 2004;168:103–109. doi: 10.1016/j.jmr.2004.02.003. [DOI] [PubMed] [Google Scholar]
- 38.Mitschang L. An adjustable adiabatic pulse for selective population inversion. Magn Reson Med. 2005;53:1217–1222. doi: 10.1002/mrm.20454. [DOI] [PubMed] [Google Scholar]
- 39.Ugurbil K, Garwood M, Rath AR. Optimization of modulation functions to improve insensitivity of adiabatic pulses to variations in B1 magnitude. J Magn Reson. 1988;80:448–469. [Google Scholar]
- 40.Tannús A, Garwood M. Improved performance of frequency-swept pulses using offset-independent adiabaticity. J Magn Reson. 1996;120:133–137. [Google Scholar]
- 41.Tannús A, Garwood M. Adiabatic pulses. NMR Biomed. 1997;10:423–34. doi: 10.1002/(sici)1099-1492(199712)10:8<423::aid-nbm488>3.0.co;2-x. [DOI] [PubMed] [Google Scholar]
- 42.Pauly J, Le Roux P, Nishimura D, Macovski A. Parameter relations for the Shinnar-Le Roux selective excitation pulse design algorithm. IEEE Trans Med Imaging. 1991;10:53–65. doi: 10.1109/42.75611. [DOI] [PubMed] [Google Scholar]
- 43.Schulte RF, Tsao J, Boesiger P, Pruessmann KP. Equi-ripple design of quadratic-phase RF pulses. J Magn Reson. 2004;166:111–122. doi: 10.1016/j.jmr.2003.10.009. [DOI] [PubMed] [Google Scholar]
- 44.Le Roux P, Gilles RJ, McKinnon GC, Carlier PG. Optimized outer volume suppression for single-shot fast spin-echo cardiac imaging. J Magn Reson Imaging. 1998;8:1022–1032. doi: 10.1002/jmri.1880080505. [DOI] [PubMed] [Google Scholar]
- 45.Pauly J, Nishimura D, Macovski A. Quasi-adiabatic inversion pulses. Proceedings, SMRM, 9th Annual Meeting; New York. 1990. p. 417. [Google Scholar]
- 46.Balchandani P, Yamada M, Pauly J, Yang P, Spielman DM. Self-refocused spatial-spectral pulse for positive contrast imaging of cells labeled with SPIO nanoparticles. Magn Reson Med. 2009;62:183–192. doi: 10.1002/mrm.21973. [DOI] [PMC free article] [PubMed] [Google Scholar]


