Abstract
A new gadolinium chelating NIR fluorescent molecular probe increases T1 relaxivity of water protons, facilitating combined optical and magnetic resonance imaging.
Integration of optical and magnetic resonance imaging (MRI) methods in one setting is appealing due to the complementary nature of MRI’s high spatial and temporal resolution and the high molecular sensitivity of optical imaging.1 In particular, deep tissue penetration of near-infrared (NIR) photons and minimal autofluorescence in this wavelength range2 favors the assessment of molecular events in thick tissue by optical in vivo imaging.3 A major challenge in constructing dual MRI/optical probes is matching the relatively low contrast agent’s detection sensitivity (micromolar) by MRI with the single molecule detection capability of fluorescence imaging. Herein, we report a new molecular design consisting of a Gd3+ chelating NIR carbocyanine dye (LS-479-Gd3+; Fig. 1) to bridge the sensitivity gap between the two imaging modalities. We envisioned that MRI sensitivity could be improved by decreasing the rotational diffusion of the molecular probe, which could be achieved by anchoring the probe to a macromolecule such as a protein. With this dual Gd3+-fluorophore probe, we were able to obtain high T1 weighted MRI and fluorescence imaging contrast in small animals.
Fig. 1.
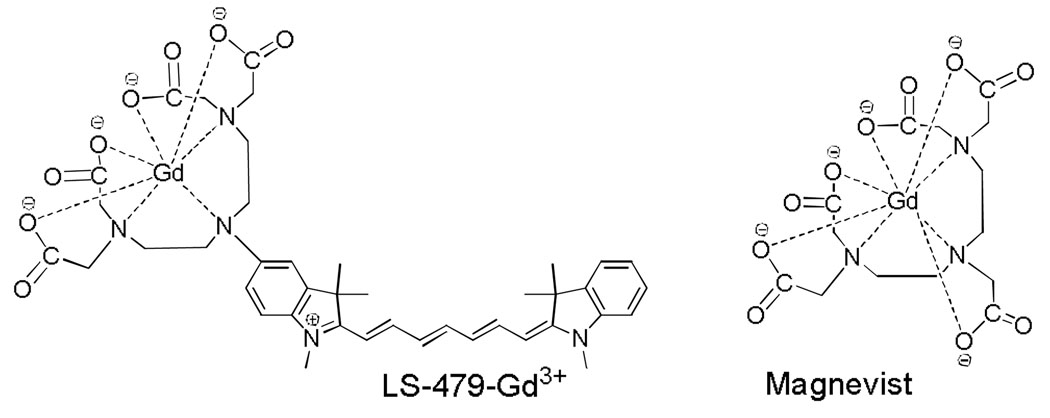
Structures of LS479-Gd3+ and Magnevist®
MRI produces high spatial resolution images of soft tissue by measuring the relaxation rate of water protons4. With their high magnetic moment, paramagnetic lanthanide ions increase the relaxation rate of proximal protons and provide contrast. High relaxivity translates into improved detection sensitivity at relatively lower contrast agent concentration than is traditionally used for MRI.4 Gd3+ is the most commonly used MRI contrast agent due to its optimal electronic characteristics.5 The high toxicity of free Gd3+ requires its incorporation in a chelating matrix,6 hence a variety of gadolinium chelates have been developed, either as nonspecific extracellular agents or as targeted agents optimized for specific medical applications.7
In general, total relaxivity of an MRI contrast agent depends on a number of factors, including rate of water exchange and its rotational diffusion.8 Total relaxivity is a combination of inner and outer sphere relaxivities. The inner sphere relaxivity is given by the following equation:4
where Pm is the mole fraction of the metal ion, q is the number of water molecules bound per metal ion, T1m is the relaxation time of the coordinated water molecule(s), and τm is the residence lifetime of the coordinated water.
For metals such as Gd3+ with a long electronic spin relaxation time,4 the important factor in increasing T1 of water is to limit rotational diffusion of the metal (i.e. decreasing T1m). An effective method to limit rotational diffusion of a probe is binding the contrast agent to a macromolecule with a slow rotational time, such as a protein.9 For example, the relaxivity of the clinically used MRI contrast reagent Magnevist® (Gd3+-DTPA) with negligible albumin binding has a T1 relaxivity of 4–5 mM−1 sec−1, 10 while a modified version of Gd3+-DTPA complex (Vasovist®, 10 with high albumin binding affinity, K~ 11,000 M−1, see SI for binding constant measurement) has a much higher T1 relaxivity of ~50 mM−1 sec−1 in human plasma10 due to a 60–100 fold decrease in rotational diffusion.11 While covalent binding is possible,12 noncovalent interactions with protein, as in the case of Vasovist®, is attractive to facilitate the eventual clearance of the probe via normal excretory pathways.4
We demonstrated previously that NIR polymethine dyes bind noncovalently to serum albumin and exhibit increased quantum yield and fluorescence lifetime due to stabilization of the fluorophore when enclosed in the hydrophobic pockets of albumin.13 In this study, we hypothesized that opsonization of a NIR dye-Gd3+ complex possessing a metal chelating group electronically coupled to the fluorophore of the fluorophore could further induce rigidification of the metal chelating group, dramatically reducing the molecular tumbling of the metal-chelate system and enhancing T1 relaxivity. This disposition will synergistically enhance the fluorescence signal as well as the T1 signal that is useful for functional dual MRI-optical imaging.
We selected LS479, a NIR polymethine dye electronically coupled to a DTPA chelating group (Fig. 1). The compound was synthesized as previously described.14 The sensitivity of LS479-Gd3+ to serum albumin (we used bovine serum albumin as a model) was compared to Magnevist®, a DTPA-based clinical contrast agent for MRI.
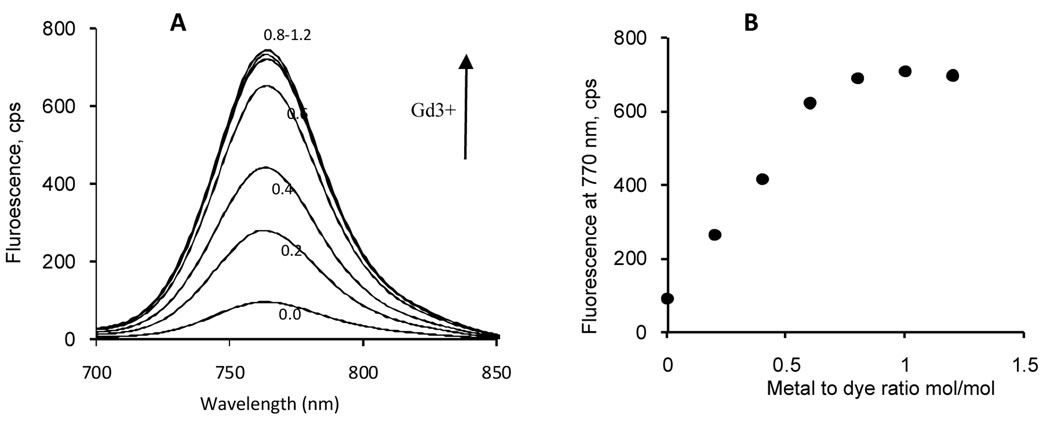
Previously, we had shown that complexation of LS479 to certain metals induces spectral changes (absorption and emission).14 On this basis, we evaluated the use of spectroscopic method to track the complexation of Gd3+ to LS479. As expected, titration of LS479 with Gd3+ resulted in concentration dependent fluorescence (Fig. 2) and absorption (Fig. S1) spectral changes. Concentration induced changes in the absorption spectra of LS479 showed clear isosbestic points at ~715 nm and ~755 nm. We did not observe further changes after saturation of LS479 with Gd3+. At saturation (1:1 dye to metal ratio), LS479 displayed ~700% enhancement of fluorescence. The enhancement was attributed to the suppression of excited state electron transfer, as previously described.14 Photophysical properties of LS479 and LS479-Gd3+ in 4% BSA are tabulated in Table S1.
Fig. 2.
(A) Titration emission spectra of LS479 with GdCl3 in water (ex. 675 nm), arrow indicates the direction of increasing Gd3+ concentration from 0 to 1.2 metal/dye ratio; (B) fluorescence intensities at emission maxima (770 nm) as a function of metal/dye ratio.
Free Gd3+ is toxic, often leading to fatal nephrogenic systemic fibrosis (NSF),15 especially in patients with renal failure. For that reason, Gd3+ must remain trapped in a chelating molecule and safely excreted from the body. Having demonstrated the complexation of Gd3+ to LS479, we further established that LS479-Gd3+ binds to albumin and the dye-metal complex remains intact, making it a viable contrast agent for MRI applications.
First, we evaluated BSA binding affinity of LS479-Gd3+, (see ESI for the experimental method). The binding constants of LS479 (~48,000 M−1) and LS479-Gd3+ (~35,000 M−1) were determined by measuring the slope in a concentration vs. tryptophan emission intensity plot (Fig. S2). The large and similar binding constants of the two compounds indicate that chelation of Gd3+ by LS479 does not significantly alter the binding properties of the dye to BSA. Second, measurement of the fluorescence lifetime of LS479-Gd3+ in albumin showed a longer decay compared to albumin-free aqueous solution (Fig. S4), with an average lifetime increase of ~2.6 fold (Table S2). This change is typical of opsonized NIR cyanine dyes13, 16 and confirms that the dye is bound to the protein. The spectral profile and fluorescence lifetime of LS479-Gd3+ were stable over a long period, evidencing the stability of the complex in the bound state. Finally, a small but noticeable change in the absorption and emission spectra of LS479-Gd3+ in albumin compared to the metal-free LS479 in albumin was observed (Fig. S3), indicating chelation of the metal.
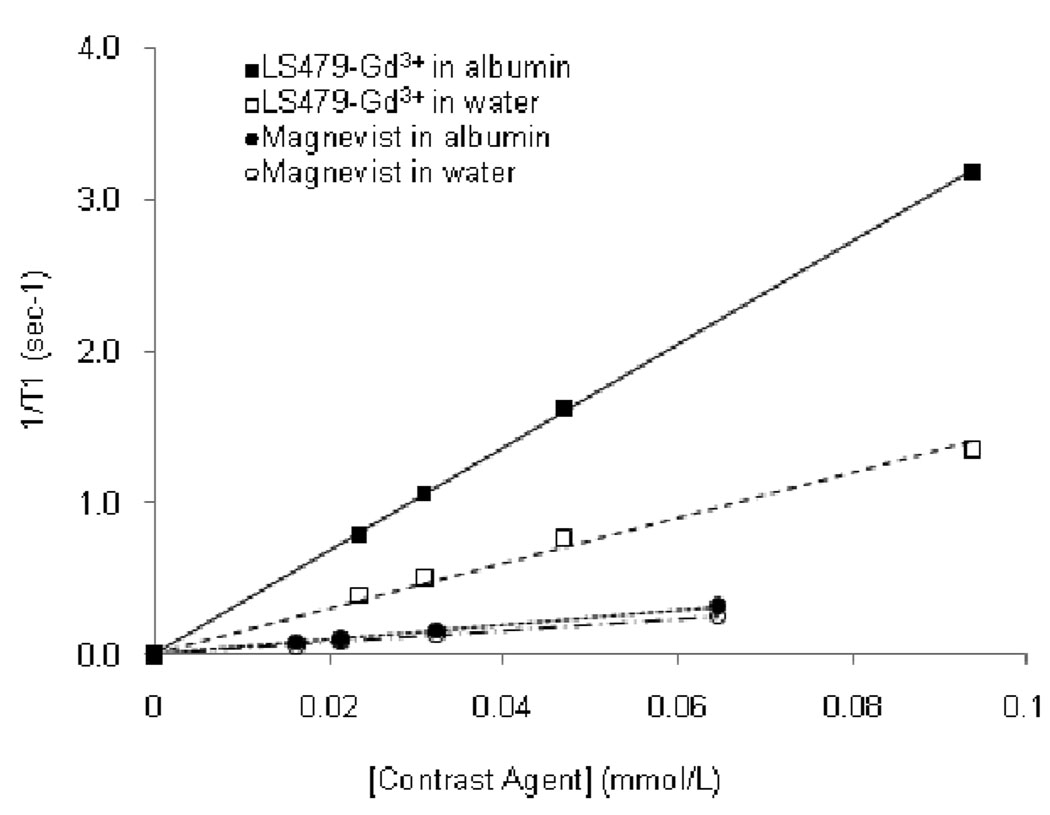
After demonstrating the stability of LS479-Gd3+ in albumin, we next determined the T1 relaxivity of LS479-Gd3+ and compared it to that of Magnevist® in 4% BSA and water to mimic natural concentrations of albumin in blood. Relaxivities of the samples were determined from the slopes of a linear plot of 1/ T1 vs. concentration of contrast agent (Fig. 3). The relaxivity of LS479-Gd3+ in water (~15 mM−1 sec−1) was higher than that of Magnevist® (~3.9 mM−1 sec−1), probably due to the presence of two coordinated water molecules characteristic of Gd3+-DTPA derivatives17 used in LS479-Gd3+ compared to the single inner sphere water of Gd3+-DTPA of Magnevist®. In this configuration, the nine-coordinate Gd3+ has coordination number of seven in LS479-Gd3+ and eight in Magnevist®, as shown in Fig. 1. In the presence of albumin, the T1 relaxivity difference was further magnified. LS479-Gd3+ bound to albumin showed a relaxivity of ~34 mM−1 sec−1, a ~2.5 fold enhancement over its relaxivity in water while Magnevist® increased by a small margin of ~1.2, which is close to the published enhancement of 1.5 in human serum albumin.18
Fig. 3.
T1 relaxivities: LS479-Gd3+ in albumin (34.05 mM−1 sec−1, R2=0.999), LS479-Gd3+ in water (15.02 mM−1 sec−1, R2=0.990), Magnevist® in albumin (4.93 mM−1 sec−1, R2=0.999), Magnevist® in water (3.87 mM−1 sec−1, R2=0.999). Field strength-23 MHz.
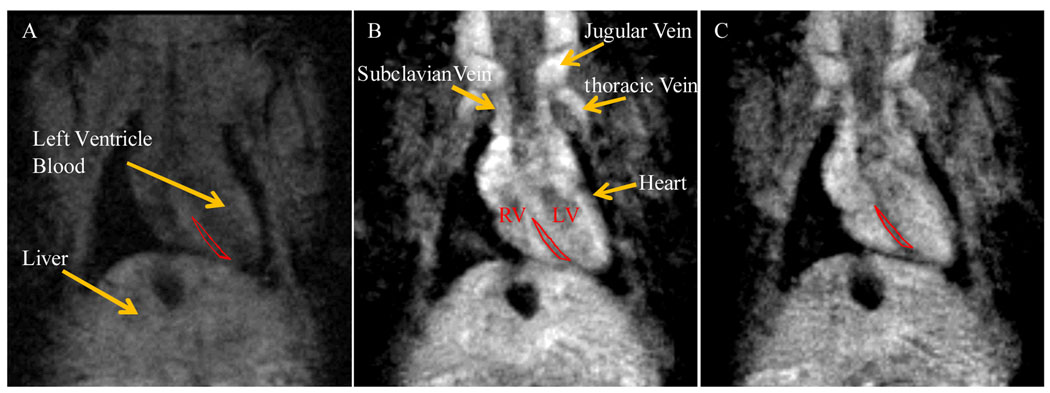
Encouraged by the remarkable enhancement of LS479-Gd3+ T1 relaxivity in the presence of BSA, we proceeded to evaluate the potential of using this compound as a multimodal contrast agent for MRI and optical imaging in mice. 3D FLASH MR images were acquired after intravenous injection of 0.025 mmol/kg in a mouse. The T1 weighted images showed substantially higher T1 signal in the jugular, subclavian, and thoracid veins as well as the liver, aorta and surrounding tissues at 2 min and 4 min following injection of the compound (Fig. 4).
Fig. 4.
T1 weighted MR images of a mouse before (A), two minutes (B) and four minutes (C) acquired post injection of LS479-Gd3+. (See Table S3 for SNR values and Fig. S5 for longitudinal study.)
We observed an increase in the signal-to-noise ratio (SNR) of ~235% and 100% for the liver and heart septum, respectively, and negligible change for muscle tissue after 2 min (see Table S3 for the raw data). The SNR for the heart septum and liver decreased rapidly after injection (Fig. S5), apparently due to rapid extravasation of LS479-Gd3+.
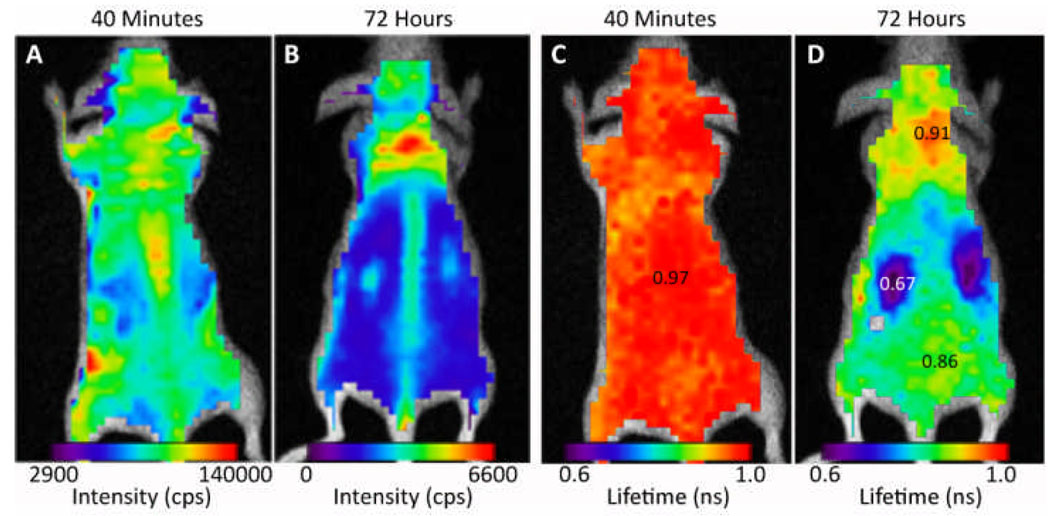
Similarly, noninvasive optical imaging showed strong fluorescence signal throughout the body at 40 min post injection, with intense fluorescence in the spine (Fig. 5A). After 72 h, the fluorescence reduced rapidly and the residual agent remaining in the body (less than 4%) was primarily localized in the neck and spine regions (Fig. 5B).
Fig. 5.
Fluorescence intensity image of the mouse 40 min (A) and 72 h (B) post injection demonstrate accumulation in the neck and spine. Whole body fluorescence lifetime images 40 min (C) and 72 h after injection (D). (See Table S4 for lifetime values.
Previous studies have shown that the fluorescence lifetime of similar dyes is sensitive to the nature of their biological environment.16 In high polarity urine, the lifetime is expected to be lower than in blood, where the dye is bound to hydrophobic albumin binding sites.13, 19 As shown in Fig. 5C, the long lifetime of about 1 ns indicates that the dye is in circulation and the pockets of shorter lifetimes (~0.8 ns) in the vicinity of the liver and bladder suggest the extravasation of some of the agent to tissue. After 72 h, the shorter lifetime (blue) map in vicinity of the kidneys indicates that some of the compounds were cleared by the kidney. Published reports have shown that other hydrophilic NIR fluorescent dyes have similar renal clearance characteristics.19 Although the albumin-bound cyanine dyes such as ICG are expected to be excreted predominantly by hepatobiliary pathway, the unbound LS479-Gd3+ is a hydrophilic molecule that can be excreted by the kidneys. Interestingly, despite the relatively large amounts of LS479-Gd3+ used in this study to compensate for the low contrast agent detection sensitivity of MRI, the mice remained in apparent good health for more than 2 months after injection.
In conclusion, we have developed a new NIR optical-MRI imaging probe, LS479-Gd3+, that utilizes the fluorophore itself as a binding scaffold to serum albumin. We showed that upon binding to albumin, the fluorophore-metal chelate system significantly enhanced the T1 relaxivity attributable to the induced rigidification of the chelating group. Preliminary in vivo results indicate the potential use of the imaging agent for dual optical-MRI studies. This study illustrates a synergistic approach to increase the fluorescence intensity and T1 relaxivity for potential dual optical and MRI imaging studies. Specifically, the concept can be used to develop new molecular constructs for enhanced dual MRI/optical imaging.
Supplementary Material
Acknowledgments
This study was funded in part by grants from the National Institutes of Health (NIBIB R01 EB008111 and NCI R01 CA109754), the NIH Roadmap for Medical Research as funding source for the IPDC, and the Intramural Research Program of Eunice Shriver NICHD.
Footnotes
Electronic Supplementary Information (ESI) available: Spectroscopic characterization of probes, binding constants, in vitro relaxivity and in vivo imaging. See DOI: 10.1039/b000000x/
References
- 1.Frullano L, Meade TJ. J Biol Inorg Chem. 2007;12:939–949. doi: 10.1007/s00775-007-0265-3. [DOI] [PubMed] [Google Scholar]; Koyama Y, Talanov VS, Bernardo M, Hama Y, Regino CAS, Brechbiel MW, Choyke PL, Kobayashi H. J Magn Reson Imaging. 2007;25:866–871. doi: 10.1002/jmri.20852. [DOI] [PubMed] [Google Scholar]; Zhang XA, Lovejoy KS, Jasanoff A, Lippard SJ. Proc Natl Acad Sci USA. 2007;104:10780–10785. doi: 10.1073/pnas.0702393104. [DOI] [PMC free article] [PubMed] [Google Scholar]
- 2.Achilefu S. Technol Cancer Res Treat. 2004;3:393–409. doi: 10.1177/153303460400300410. [DOI] [PubMed] [Google Scholar]; Frangioni JV. Curr Opin Chem Biol. 2003;7:626–634. doi: 10.1016/j.cbpa.2003.08.007. [DOI] [PubMed] [Google Scholar]
- 3.Jennings LE, Long NJ. Chem Commun. 2009:3511–3524. doi: 10.1039/b821903f. [DOI] [PubMed] [Google Scholar]; Kircher MF, et al. Cancer Res. 2003;63:8122–8125. [PubMed] [Google Scholar]; Medarova Z, Pham W, Kim Y, Dai GP, Moore A. Int J Cancer. 2006;118:2796–2802. doi: 10.1002/ijc.21672. [DOI] [PubMed] [Google Scholar]; Kelly KA, Allport JR, Tsourkas A, Shinde-Patil VR, Josephson L, Weissleder R. Circ Res. 2005;96:327–336. doi: 10.1161/01.RES.0000155722.17881.dd. [DOI] [PubMed] [Google Scholar]; Jin T, Yoshioka Y, Fujii F, Komai Y, Seki J, Seiyama A. Chem Communic. 2008:5764–5766. doi: 10.1039/b812302k. [DOI] [PubMed] [Google Scholar]
- 4.Lauffer RB. Chem Rev. 1987;87:901–927. [Google Scholar]
- 5.Caravan P, Ellison JJ, McMurry TJ, Lauffer RB. Chem Rev. 1999;99:2293–2352. doi: 10.1021/cr980440x. [DOI] [PubMed] [Google Scholar]
- 6.Bartolini ME, Pekar J, Chettle DR, McNeill F, Scott A, Sykes J, Prato FS, Moran GR. Magn Reson Imaging. 2003;21:541–544. doi: 10.1016/s0730-725x(03)00081-x. [DOI] [PubMed] [Google Scholar]
- 7.Werner EJ, Datta A, Jocher CJ, Raymond KN. Angew Chem Int Ed Engl. 2008;47:8568–8580. doi: 10.1002/anie.200800212. [DOI] [PubMed] [Google Scholar]
- 8.Caravan P. Chem Soc Rev. 2006;35:512–523. doi: 10.1039/b510982p. [DOI] [PubMed] [Google Scholar]
- 9.Lauffer RB. Magn Reson Med. 1991;22:339–342. doi: 10.1002/mrm.1910220237. [DOI] [PubMed] [Google Scholar]; Caravan P. Acc Chem Res. 2009;42:851–862. doi: 10.1021/ar800220p. [DOI] [PubMed] [Google Scholar]
- 10.Lauffer RB, Parmelee DJ, Dunham SU, Ouellet HS, Dolan RP, Witte S, McMurry TJ, Walovitch RC. Radiology. 1998;207:529–538. doi: 10.1148/radiology.207.2.9577506. [DOI] [PubMed] [Google Scholar]
- 11.Caravan P, Cloutier NJ, Greenfield MT, McDermid SA, Dunham SU, Bulte JWM, Amedio JC, Looby RJ, Supkowski RM, Horrocks WD, McMurry TJ, Lauffer RB. J Am Chem Soc. 2002;124:3152–3162. doi: 10.1021/ja017168k. [DOI] [PubMed] [Google Scholar]
- 12.Schmiedl U, Ogan M, Paajanen H, Marotti M, Crooks LE, Brito AC, Brasch RC. Radiology. 1987;162:205–210. doi: 10.1148/radiology.162.1.3786763. [DOI] [PubMed] [Google Scholar]
- 13.Berezin MY, Lee H, Akers W, Nikiforovich G, Achilefu S. Photochem Photobiol. 2007;83:1371–1378. doi: 10.1111/j.1751-1097.2007.00173.x. [DOI] [PubMed] [Google Scholar]
- 14.Berezin MY, Guo K, Teng B, Edwards WB, Anderson CJ, Vasalatiy O, Gandjbakhche A, Griffiths GL, Achilefu S. J Am Chem Soc. 2009;131:9198–9200. doi: 10.1021/ja903685b. [DOI] [PMC free article] [PubMed] [Google Scholar]
- 15.Penfield J. Pediatr Nephrol. 2008;23:2121–2129. doi: 10.1007/s00467-008-0862-6. [DOI] [PubMed] [Google Scholar]
- 16.Berezin MY, Lee H, Akers W, Achilefu S. Biophys J. 2007;93:2892–2899. doi: 10.1529/biophysj.107.111609. [DOI] [PMC free article] [PubMed] [Google Scholar]
- 17.Caravan P, Amedio JC, Dunham SU, Greenfield MT, Cloutier NJ, McDermid SA, Spiller M, Zech SG, Looby RJ, Raitsimring AM, McMurry TJ, Lauffer RB. Chem Eur J. 2005;11:5866–5874. doi: 10.1002/chem.200500338. [DOI] [PubMed] [Google Scholar]
- 18.Li XY, Li XJ, Zhang SR, Pei FK. Polyhedron. 1999;18:695–697. [Google Scholar]
- 19.Goiffon RJ, Akers WJ, Berezin MY, Lee H, Achilefu S. J Biomed Opt. 2009;14:0205011–0205013. doi: 10.1117/1.3095800. [DOI] [PMC free article] [PubMed] [Google Scholar]
Associated Data
This section collects any data citations, data availability statements, or supplementary materials included in this article.


