Abstract
The thyroid hormones T4, T3, rT3 and TSH were assayed in 134 adult patients evaluated and accepted as potential liver transplant candidates at the University of Pittsburgh from March, 1981 to December, 1983. The subsequent course of these patients was evaluated with respect to the levels of these hormones obtained at the time of acceptance for transplantation. T4 levels were increased significantly while their T3 levels were reduced (both p < 0.01) in those who survived and were discharged home as compared to either those who died waiting to be transplanted or died following the procedure. As a result, the ratio of T3/T4 was reduced markedly (p < 0.01) in those who were transplanted and survived as compared to those not transplanted or dying following transplantation. Importantly, the rT3 levels clearly separated (p < 0.01) those who would die prior to transplantation from those who would survive to be transplanted. Finally, the ratio rT3/T3 even more clearly separates those who will die prior to transplantation (p < 0.01) from the other two groups.
These data suggest that thyroid hormone levels, particularly rT3 levels, might be useful in setting priorities for which patients referred for a transplantation evaluation should be accepted into the program and in determining who among accepted patients should be operated upon in preference to others also accepted and waiting to be transplanted.
The liver plays an important role in maintaining thyroid hormone homeostasis (1–5). It synthesizes and secretes the three major thyroid hormone-binding proteins (thyroid-binding globulin or thyroid-binding prealbumin and albumin) which determine, at least in part, the plasma concentration of free biologically active thyroid hormone (5–7). In addition, the liver is the principal organ responsible for the conversion of thyroxine or T4 (a prohormone secreted by the thyroid gland, to triiodothyronine or T3 (3,5,3′-triiodothyronine), the biologically active form of thyroid hormone at the level of the tissues (2, 3, 8). Most tissues can convert T4 to either biologically active T3 or inert rT3 (3,3prime;,5′-triiodothyronine), however the liver is the principal site of T3 production and accounts for greater than 80% of the T3 produced daily from T4 (2, 3, 8).
In many serious systemic illnesses, including advanced chronic liver disease, a reduction in plasma T3 levels and an increase in rT3 level is occurring in association with a normal T4 level and in the virtual absence of any clinical evidence for hypothyroidism has been noted (4, 9–15) This condition has been identified as the low T3 syndrome. Its biochemical component (T3 and rT3 level) have been used to follow the clinical response to medical therapy of alcoholics with liver disease and to predict the short-term survival of patients with advanced chronic liver disease (13–15).
Until recently, obtaining such data in patients with advanced liver disease has been valuable only in a negative sense in that it accurately predicted the patient’s demise regardless of the efforts of his physicians to prevent such an outcome. With the recent development of orthotopic hepatic transplantation as a clinically useful therapy, the selection of appropriate patients for its application has become an issue of considerable concern to physicians, surgeons, government and the public (16–19). Because we are in a unique position to offer such heroic therapy to patients with advanced irreversible liver disease, we prospectively evaluated, in a double blind fashion, the usefulness of obtaining measures of thyroid hormone homeostasis in patients being considered for this procedure (16, 20).
MATERIALS AND METHODS
PATIENTS
All 134 adult patients being considered for orthotopic liver transplantation from March, 1981 through December, 1983 at the Presbyterian-University Hospital, Pittsburgh, Pa, had on admission to hospital for their initial evaluation, blood obtained after an overnight fast plasma levels of T4, T3, rT3 and thyroid-stimulating hormone (TSH). The subsequent evaluation for and application of orthotopic liver transplantation to these patients proceeded without knowledge of these results and was based primarily upon the clinical experience of the involved physicians.
HORMONE ASSAYS
Serum TSH was determined by specific radioimmunoassay using a kit obtained from Pharmacia Fine Chemicals (Piscataway, NJ). The detection limit of the assay was l.0 μU per ml. The intraassay variation was less than 5%, and the interassay variation was less than 8%. Serum T3 was determined by a specific radioimmunoassay using a kit obtained from Corning Medical Diagnostics, Inc. (Medfield, Mass.). The interassay variation was less than 7%, and the intraassay variation was less than 3%. Serum T3 was determined also by a specific radioimmunoassay using a kit obtained from Corning Medical Diagnostics, Inc. The interassay variation for this unit was 10%, and its intraassay variation was less than 5%. Serum rT3 was determined using a specific radioimmunoassay kit obtained from Serono (Braintree, Mass.). The interassay variation for this kit was 11%, and its intraassay variation was less than 5%. Normal values for each hormone assayed were determined using blood obtained from 100 consecutive normal volunteer blood donors.
ANALYSIS
After closing the study on December 31, 1983, the values for each hormone obtained at the time of initial evaluation for possible liver transplantation were collected and segregated into two groups as follows: Group I—those who died waiting to be transplanted (n = 42; 21 men and 21 women) and Group II—those who underwent the procedure (n = 92). This latter group was later subdivided into those who died in hospital following transplantation (n = 27; 12 men and 15 women) and those who survived, and were discharged home (n = 65; 27 men and 38 women).
The mean values and the standard errors for each hormone assayed were determined for the entire group of patients studied and for each subgroup of patients identified above.
Statistical analysis was performed using the Student’s t test. A p value less than 0.05 was considered to be significant.
Because the collected data were cross-sectional in nature, associations were assessed using the odds ratio as an approximation to the relative risk. In this setting, thyroid status was considered to be antecedent to the outcome (death), thus permitting the odds ratio to be used as a measure of risk of experiencing the outcome when the antecedent factor was present compared to when the antecedent factor was absent. The odds ratio is not only an approximation to the relative risk, but the use of the logistic model gives rise to the odds ratio as a measure of association as well Using the logarithm (to the base) of the calculated odds ratio and constructing a confidence interval (CI) using the standard error of the log-odds ratio, permits one to observe whether or not the confidence interval of the odds ratio excludes unity [an odds ratio of unity (equal to one) indicates no excess risk]. When the calculated odds ratio confidence interval excludes unity, a χ2 test is performed. While the χ2 itself is not useful as a measure of the degree of an association, the χ2 is an excellent measure of the significance of an association (21).
RESULTS
Table 1 is a listing of the patients studied and identified on the basis of their disease condition for which they were being considered as possible or actual candidates for liver transplantation. The mean values for TSH, T4, T3 and rT3 for the entire group of patients studied are shown in Table 2. In Table 3 is shown an estimate of the degree of saturation of the thyroid-binding globulin and the frequency of various types of autoantibodies present in the patients comprising the three largest etiologic types of liver disease present in the populations studied.
Table 1.
Patients Studied Listed as to Diagnosis and Outcome
| Died waiting | Transplanted | ||
|---|---|---|---|
| Postnecrotic cirrhosis | 16 | Primary biliary cirrhosis | 27 |
| Primary biliary cirrhosis | 8 | Postnecrotic cirrhosis | 20 |
| Sclerosing cholangitis | 3 | Sclerosing cholangitis | 13 |
| Fulminant type B hepatitis | 2 | Hepatoma | 7 |
| HBsAg + postnecrotic cirrhosis | 2 | α1-antitrypsin | 4 |
| Hepatoma | 2 | Cholangiolar carcinoma | 3 |
| Hemochromatosis | 2 | HBsAg + postnecrotic cirrhosis | 3 |
| Laennec’s cirrhosis | 2 | Caroli’s disease | 2 |
| Wilson’s disease | 2 | Secondary biliary cirrhosis | 2 |
| Secondary biliary cirrhosis | 2 | Fulminant hepatic failure | 2 |
| Tyrosenemia | 1 |
Subacute hepatic failure | 2 |
| Total | 42 | Wilson’s disease | 2 |
| Multiple hepatic adenoma | 1 | ||
| Angiosarcoma | 1 | ||
| Budd-Chiari syndrome | 1 | ||
| Tyrosinemia | 1 | ||
| Laennec’s cirrhosis | 1 |
||
| Total | 92 |
Table 2.
Thyroid Hormone Levels in the Patients Studieda
| Patients | Normals | |
|---|---|---|
| TSH (μU/ml) | 3.5 ± 0.4 | 1.7 ± 0.1 |
| T4 (μg/dl) | 6.5 ± 0.4 | 8.5 ± 0.3 |
| T3 (ng/ml) | 1.19 ± 0.05 | 1.18 ± 0.04 |
| rT3 (pg/ml) | 483 ± 53 | 240 ± 15 |
Mean value ± S.E.
Table 3.
T3 Uptake and Prevalence of Antithyroglobulin and Antimicrosomal Autoantibodies in the Patients Studied Separated as to Primary Disease
| Disease | T3 uptakea | Antithyroglobulin antibody | Antimicrosomal antibody |
|---|---|---|---|
| Primary biliary cirrhosis (n = 35) | 0.90 ± 0.06 | 4 (11)b | 10 (29) |
| Primary sclerosing cholangitis (n = 16) | 0.94 ± 0.10 | 1 (6) | 1 (6) |
| Postnecrotic cirrhosis (n = 41) | 1.37 ± 0.08c | 9 (22) | 9 (22) |
Mean value ± S.E.; normal values 0.8–1.2.
Number in parentheses = % of total group who were positive for antibody.
p < 0.01 compared to both primary biliary cirrhosis or primary sclerosing cholangitis groups.
No difference in TSH levels was noted between the various subgroups of patients studied. In contrast, T4, T3, rT3 levels and the ratios of T3/T4 and rT3/T3 clearly distinguished between the various subgroups of patients studied and defined according to their outcome.
In Figure 1 is shown the T4 levels for the three subgroups of patients studied. As can be seen from the figure, no difference in T4 levels was noted between those who died waiting to be transplanted and those who died following the procedure. In contrast, however, those who survived had greater T4 levels (p < 0.01) than did either of the two groups of patients who died. When the mean T4 level of the surviving group of patients minus two Standard deviations for this group is used as an arbitrary cut-off value (T4 = 4.8 μg per dl), a T4 level <4.8 μg per dl is associated with a 17.87-fold increased risk (p <0.001) of dying (99% CI 102.62, 3.11) (χ2 = 30.259).
Fig. 1.
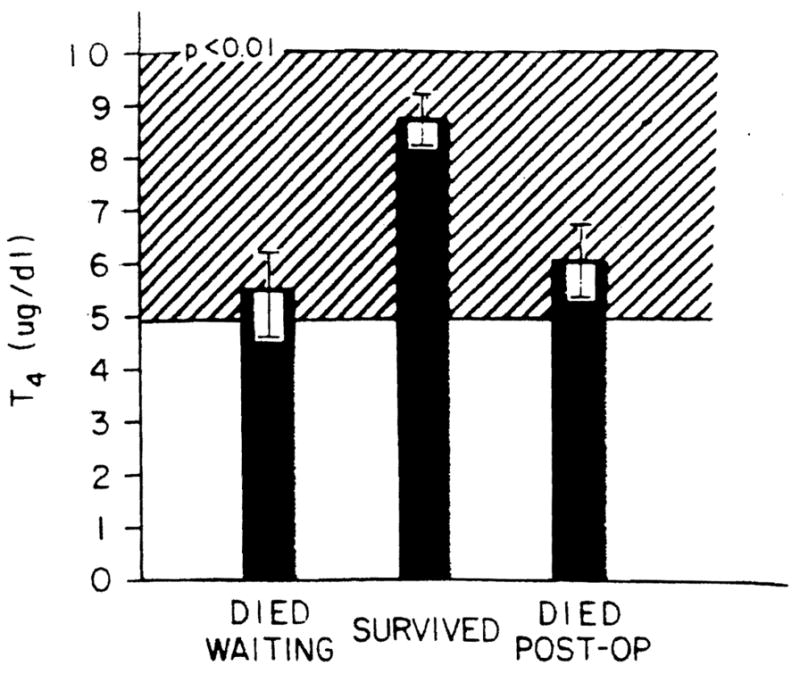
T4 levels in the patients studied. The ordinate shows the T4 levels in micrograms per deciliter for the patients studied separated as to outcome. Bars represent mean values, and the brackets represent the S.E. for each group. The cross-hatched area is the normal range.
Despite significantly greater T4 levels, the patients who ultimately survived had lower T3 levels (p < 0.01) than did either of the two groups who died (Figure 2). As was the case with the T4 levels, no difference in T3 levels was noted between those who died waiting for the procedure to be performed or those who died following performance of the procedure. However, when the T3 exceeded the mean + 2 S.D. of the surviving group (T3 = 0.98 ng per ml), the patient had a 6.71-fold increased risk (p < 0.001) of dying as compared to those with a level at or below this value (99% CI 18.43, 2.45) (χ2 = 25.319). The ratio of T3/T4 levels in the patients studied were even more clearly distinguished between the various subgroups (Figure 3). As was the case for the individual hormone measurements, no difference in this ratio was noted between those who died waiting to have the procedure and those who died postoperatively. In contrast, those who survived had lower levels (p < 0.01). However, using a T3/T4 ratio of 0.20 as an arbitrary cut-off being the mean + 2 S.D. of the surviving group, those patients with greater ratios had a 13.56-fold increased risk (p < 0.001) of death as compared to those with values at or below 0.20 (99% CI = 47.90, 3.84) (χ = 35.255).
Fig. 2.
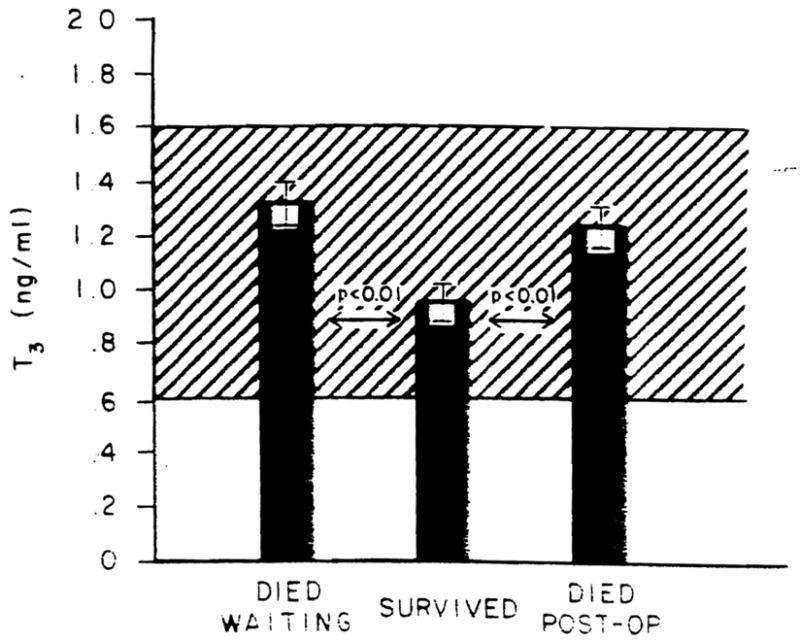
T3 levels in the patients studied. The ordinate shows the T3 levels in nanograms per milliliter for the patients separated as to outcome. Bars represent mean values; brackets represent the S.E.: the cross-hatched area is the normal range.
Fig. 3.
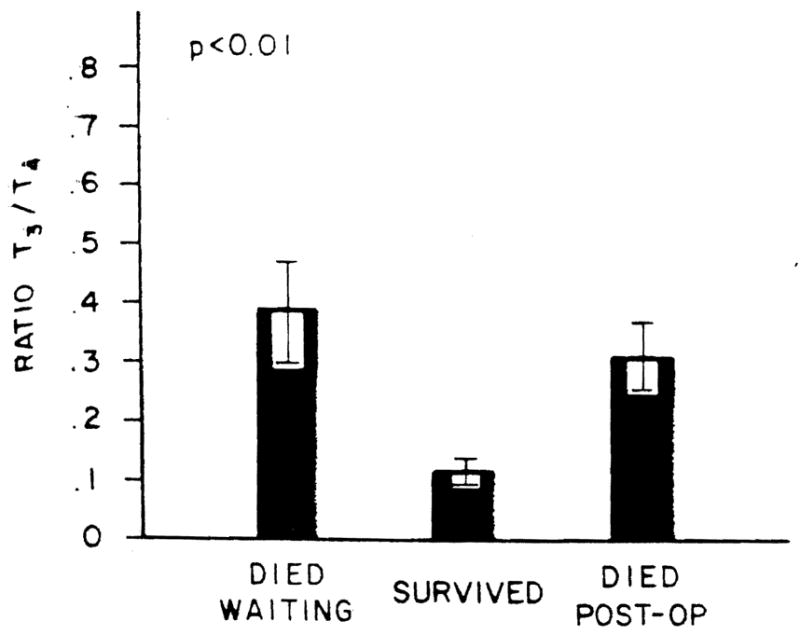
Ratio of T3/T4 in the patients studied. The units along the ordinate are micrograms × 10−1. Bars and brackets represent mean values and S.E., respectively.
The rT3 levels in the patients studied and segregated as to outcome are shown in Figure 4. Reverse T3 was increased markedly in those who died waiting for the procedure. In contrast to what had been seen with the T4, T3 and T3/T4 ratio measures, those who died after the procedure had levels quite different from those in the patients who died before the procedure could be offered to them (p < 0.01). No statistical difference in rT3 levels was found between those who had the procedure and survival, and those who had the procedure and died (Figure 4). However, a rT3 value greater than 590 pg per ml (the mean + 2 S.D. of the surviving group) was associated with a 11.02-fold increased risk of death (p < 0.001) (99% CI = 57.17, 213) (χ2 = 18.843).
Fig. 4.
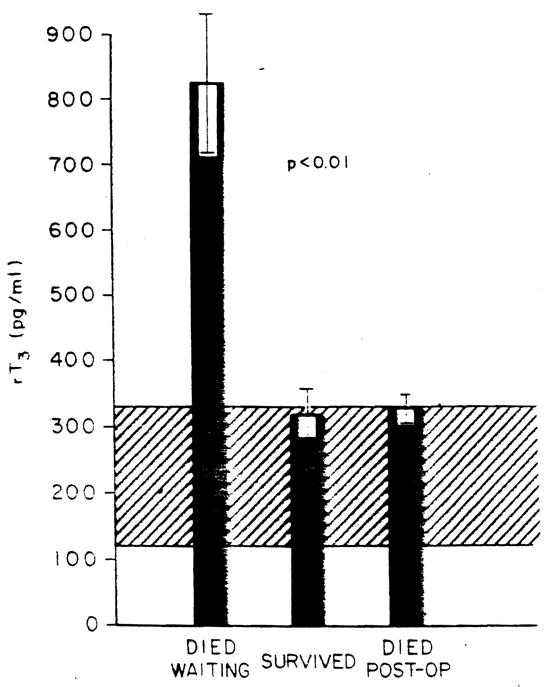
rT3 levels in patients studied. The ordinate shows the rT3 levels in picograms per milliliter. The ordinate shows the data segregated as to clinical outcome. Bars represent mean values: brackets represent S.E.: the cross hatched area is the normal range.
The ratio of rT3/T3 even more clearly distinguished between the three subgroups and identified those patients who would not survive to have the procedure performed within the time frame of the time required for the transplantation evaluation and donor identification and matching processes (Figure 5). Interestingly, those who died postoperatively had the lowest ratios.
Fig. 5.
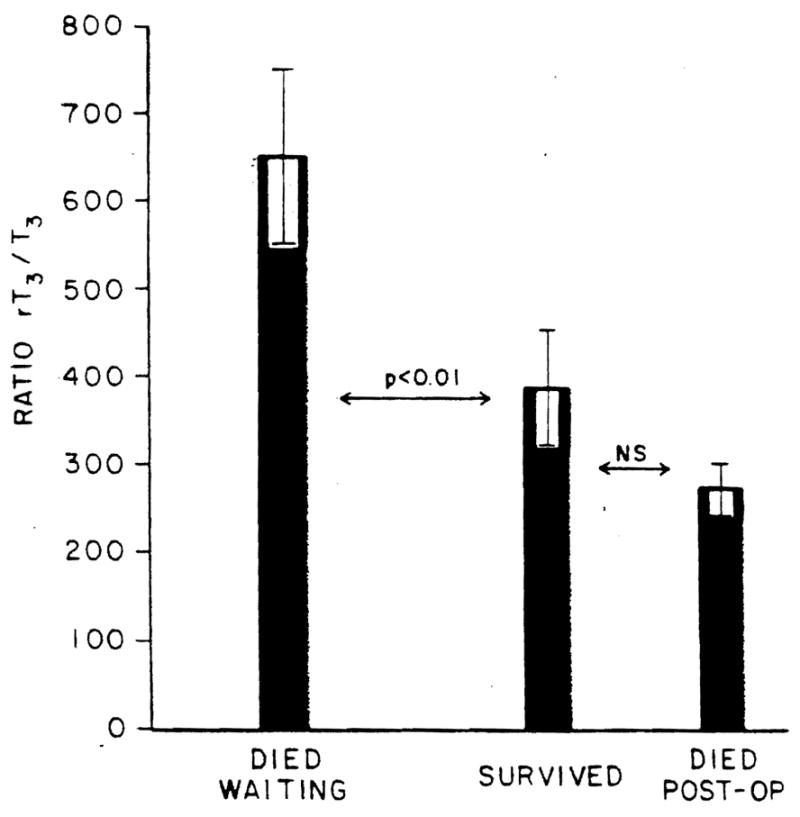
Ratio of rT3/T3 in the patients studied. The ordinate shows the ratio in units of picograms × 10−3, Bars represent mean values; brackets represent S.E. NS, not statistically significant.
DISCUSSlON
The results of the present study confirm the work of previous investigators who have suggested that the levels of thyroid hormone measured in blood can be used prognostically in patients with advanced liver disease (12–15). Specifically, those patients who were to die prior to being transplanted had greater rT3 levels and greater rT3/T3 ratios than did those who were to survive to have the procedure.
More importantly, the present data demonstrate somewhat paradoxically that those patients who will live long enough to be evaluated, matched with a donor and survive the procedure, have greater T4 and lower T3 levels and therefore a much smaller T3/T4 ratio than do those who will die whether their deaths occur before or after the procedure can be performed. The reasons responsible for these findings are unclear. In fact, one might have expected the converse; that is, those with the more severe liver disease and presumably therefore the poorest survival rates would be expected to have the lowest T3 levels, not greater levels. As shown in Table 2, as a group, the patients with liver disease had higher TSH levels than did the normal controls, albeit levels still well within the normal range. Whether this reflects some minor degree of thyroid dysfunction associated with the liver diseases studied and accounts, at least in part, for the findings seems likely.
These data raise interesting questions about how a decision should be made about who should be afforded a liver transplant from among a list of potential recipients once an acceptable donor organ has been identified. Should those patients with the lower. T4 levels and greater T3 levels be bypassed in favor of those with greater T4 levels and lower T3 levels who would appear to have a better chance for survival? Even more difficult is the question: Should those patients with very high rT3 levels be eliminated from all further consideration because of their very poor chance of survival? Conversely, should those with very high rT3 levels be the ones we preferentially select once they are identified for immediate transplantation because of their very poor prognosis? Obviously, the present data do not allow us to make any such recommendations. However, should our findings be replicated by other groups performing liver transplantation, considerable thought will have to be given to obtaining answers for these rather weighty questions.
Similarly, although not a part of the present study, one has to wonder if following T3 and rT3 levels during the postoperative period would help to identify those patients who are having rejection problems and/or rejection-associated enhanced immunosuppression which can lead to the development of an opportunistic infection which is the major cause of death one or more weeks following successful transplantation.
Obviously, much more remains to be learned about liver transplantation, the selection process and when such surgery should be offered to acceptable candidates for the procedure. The present study, however, is a beginning. The use of laboratory tests which are easily performed using radioimmunoassay kits, widely available, highly reproducible and having a rapid turn around time such as T4, T3 and rT3 would appear to be a reasonable first step toward improving and fine tuning our decision-making processes relative to the application of such heroic surgery.
Acknowledgments
This work was supported in Part by a grant from the Gastroenterology Medical Research Foundation of Southwestern Pennsylvania.
References
- 1.Klachko DM, Johnson ER. The liver and circulating thyroid hormones. J Clin Gastroenterol. 1983;5:465–471. doi: 10.1097/00004836-198310000-00016. [DOI] [PubMed] [Google Scholar]
- 2.Normura S, Pittman CS, Chambers JB, Jr, et al. Reduced peripheral conversion of thyroxine to triiodothyronine in patients with hepatic cirrhosis. J Clin Invest. 1975;56:643–652. doi: 10.1172/JCI108134. [DOI] [PMC free article] [PubMed] [Google Scholar]
- 3.McConnon J, Row VV, Volpe R. The influence of liver damage in man on the distribution and disposal rates of thyroxine and triiodothyronine. J Clin Endocrinol Metab. 1972;34:144–151. doi: 10.1210/jcem-34-1-144. [DOI] [PubMed] [Google Scholar]
- 4.Chopra IJ, Solomon DH, Chopra U, et al. Alterations in circulating thyroid hormones and thyrotropin in hepatic cirrhosis: evidence for enthyroidism despite subnormal serum triiodothyronine. J Clin Endocrinol Metab. 1974;39:501–511. doi: 10.1210/jcem-39-3-501. [DOI] [PubMed] [Google Scholar]
- 5.Inada M, Sterling K. Thyroxine turnover and transport in Laennec’s cirrhosis of the liver. J Clin Invest. 1967;46:1275–1282. doi: 10.1172/JCI105620. [DOI] [PMC free article] [PubMed] [Google Scholar]
- 6.Schussler GC, Schaffner F, Korn F. Increased serum thyroid hormone binding and decreased free hormones in chronic active liver disease. N Engl J Med. 1978;299:510–515. doi: 10.1056/NEJM197809072991003. [DOI] [PubMed] [Google Scholar]
- 7.Robbins J, Cheng SY, Gershengorn MC, et al. Thyroxine transport proteins of plasma: molecular properties and biosynthesis. Recent Prog Horm Res. 1978;34:477–517. doi: 10.1016/b978-0-12-571134-0.50017-x. [DOI] [PubMed] [Google Scholar]
- 8.Jennings AS, Ferguson DC, Utiger RD. Regulation of the conversion of thyroxine to triiodothyronine in perfused rat liver. J Clin Invest. 1979;64:1614–1623. doi: 10.1172/JCI109623. [DOI] [PMC free article] [PubMed] [Google Scholar]
- 9.Chopra IJ, Solomon DH, Hepner GW, et al. Misleading low free thvroxine index and usefulness of reverse triiodothyronine measurement in non thyroidal illnesses. Ann Intern Med. 1979;90:905–912. doi: 10.7326/0003-4819-90-6-905. [DOI] [PubMed] [Google Scholar]
- 10.Carter JN, Eastman CJ, Corcoran JM, et al. Inhibition of conversion of thyroxine to triiodothyronine in patients with severe chronic illness. Clin Endocrinol. 1976;5:587–594. doi: 10.1111/j.1365-2265.1976.tb03861.x. [DOI] [PubMed] [Google Scholar]
- 11.Kaptein EM, Weiner JM, Robinson WJ, et al. Relationship of altered thyroid hormone indices to survival in nonthyroidal illnesses. Clin Endocrinol. 1982;16:565–574. doi: 10.1111/j.1365-2265.1982.tb03173.x. [DOI] [PubMed] [Google Scholar]
- 12.Slag MF, Morley JE, Elson MK, et al. Hypothyroxinemia in critically ill patients as a predictor of high mortality. JAMA. 1981;245:43–45. [PubMed] [Google Scholar]
- 13.Walfish PG, Orrego H, Israel Y, et al. Serum triiodothyronine and other clinical and laboratory indices of alcoholic liver disease. Ann Intern Med. 1979;91:13–16. doi: 10.7326/0003-4819-91-1-13. [DOI] [PubMed] [Google Scholar]
- 14.Hepner GW, Chopra IJ. Serum thyroid hormone levels in patients with liver disease. Arch Intern Med. 1979;139:1117–1120. [PubMed] [Google Scholar]
- 15.Israel Y, Walfish PG, Orrego H, et al. Thyroid hormones in alcoholic liver disease. Gastroenterology. 1979;76:116–122. [PubMed] [Google Scholar]
- 16.Starzl TE, Iwatsuki S, Van Thiel DH. Evolution of liver transplantation. Hepatology. 1982;2:614–636. doi: 10.1002/hep.1840020516. [DOI] [PMC free article] [PubMed] [Google Scholar]
- 17.Van Thiel DH, Schade RR, Gavaler JS, et al. Medical aspects of liver transplantation. Hepatology. 1984;4:795–835. doi: 10.1002/hep.1840040721. [DOI] [PMC free article] [PubMed] [Google Scholar]
- 18.National Institutes of Health Concensus Development Conference Statement. Liver transplantation June 20–23, 1983. Hepatology. 1984;4:1075–1105. [PubMed] [Google Scholar]
- 19.Schenker S. Medical treatment as transplantation in liver disorders hepatology. 1984;4:955–1015. doi: 10.1002/hep.1840040724. [DOI] [PubMed] [Google Scholar]
- 20.Van Thiel DH, Schade RR, Starzl TE, et al. Liver transplantation in adults. Hepatology. 1982;2:637–640. doi: 10.1002/hep.1840020517. [DOI] [PMC free article] [PubMed] [Google Scholar]
- 21.Fleiss J. Statistical methods for rates and proportions. New York: John Wiley & Sons; 1973. [Google Scholar]


