

Abstract
The link between internal enzyme motions and catalysis is poorly understood. Correlated motions in the us-ms timescale may be critical for enzyme function. We have characterized the backbone dynamics of the peptidyl-prolyl isomerase Pin1 catalytic domain in the free state and during catalysis. Pin1 is a prolyl isomerase of the parvulin family and specifically catalyzes the isomerization of phosphorylated Ser/Thr-Pro peptide bonds. Pin1 has been shown to be essential for cell-cycle progression and to interact with the neuronal tau protein inhibiting its aggregation into fibrillar tangles as found in Alzheimer’s disease. 15N relaxation dispersion measurements performed on Pin1 during catalysis reveal conformational exchange processes in the microsecond timescale. A subset of active site residues undergo kinetically similar exchange processes even in the absence of substrate, suggesting that this area is already “primed” for catalysis. Furthermore, structural data of the turning-over enzyme were obtained through inter- and intra-molecular NOEs. This analysis together with a characterization of the substrate concentration dependence of the conformational exchange allowed distinguishing of regions of the enzyme active site that are affected primarily by substrate binding versus substrate isomerization. Together these data suggest a model for the reaction trajectory of Pin1 catalysis.
Keywords: protein dynamics, NMR spectroscopy, peptidylprolyl isomerase, catalysis
Introduction
The mechanisms of protein function can be understood in terms of the protein’s 3-dimensional structure and its variation over time (dynamics). After decades of research into the three-dimensional structures of proteins, a general framework for understanding structure-function relationships has appeared. This picture, however, is necessarily incomplete without an accurate description of protein dynamics[1]. In particular, the contribution of these conformational transitions to enzyme catalysis is poorly understood and, in most cases, has not been determined.
NMR spectroscopy has emerged as a powerful method in investigating the dynamics of biomolecules at atomic resolution across a wide range of timescales. Recently much attention has been focused into characterizing protein dynamics in the microsecond to millisecond timescales[2–23, and references therein]. These rates (102–106sec−1) coincide with the rates for many biological processes such as ligand binding, protein folding and enzyme catalysis. Thus, being able to monitor conformational changes in this time regime may reveal functionally relevant internal motions of biomolecules.
The NMR experiments used to detect conformational exchange in the microsecond to millisecond timescale take advantage of the effect of this exchange on the observed transverse relaxation rate (R2obs) of nuclei that are interconverting between states with different chemical shifts[24,25]. Conformational exchange causes an increase in R2obs, called Rex, leading to line broadening. Palmer and coworkers[3,26] have extended the method of relaxation dispersion allowing the determination of both kinetic and thermodynamic parameters of conformational exchange processes in proteins. This method explores the dependence of Rex on the strength of a refocusing field according to the following expression (for a 2-state process in the fast-exchange limit)[27,28]:
| (1) |
| (2) |
where pA and pB are the relative populations of the interconverting conformations, Δω is the difference in chemical shift between the conformations, νCPMG is the strength of the refocusing field and kex is the sum of the rates of interconversion (kf orward + kreverse).
Prolyl isomerases (PPIases) catalyze the cis-trans isomerization about prolyl peptide bonds[29]. Pin1 is unique among prolyl isomerases in that it specifically isomerizes phosphorylated Ser/Thr-Pro (pSer/pThr-Pro) bonds[30,31]. The acceleration of this isomerization may serve as a second regulatory mechanism in addition to phosphorylation in the form of a kinetic control[32,33]. Known substrates of Pin1 include a subset of cell cycle proteins (e.g. NIMA, Cdc25, Cyclin D) as well as the Alzheimer protein Tau and the transcriptional activator p53; however, the role of a conformational switch in these substrates and the mechanism of its regulation by Pin1 is not understood[34,35].
Pin1 is also distinguished by virtue of being composed by two domains: a WW domain and a catalytic domain. Both domains recognize pSer/pThr-Pro bonds and have been shown to be largely independent (both in terms of interaction and function) in solution[36,32]. Solution structures of Pin1 in the free state or bound to a sulfate ion[36] as well as an X-ray structure of the Pin1 catalytic domain (Pin1cat) in complex with an Ala-Pro dipeptide and a sulfate ion in the active site[37] have been solved. However, there are no available structures of an enzyme-substrate complex. Consequently, mechanistic interpretation is speculative. Pin1’s catalytic mechanism is thought to involve an exposed cysteine residue attacking the carbonyl group of the pSer/pThr residue followed by rotation about the substrate prolyl bond. Neither the details of this mechanism, nor the contribution by other factors (e.g. conformational strain) are understood.
Here we perform structural and dynamic NMR experiments on Pin1cat during catalysis of a true substrate. Intermolecular NOE data collected during turnover of the peptide substrate together with backbone dynamics measured during catalysis reveal insight into the reaction trajectory. Conformational exchange in the free enzyme similar to that observed during turnover suggests the pre-existence of dynamics.
Results and Discussion
Titration of Pin1cat with the substrate WFYpSPRLKK
The minimal reaction scheme for a peptidyl-prolyl-cis/trans isomerase catalyzed reaction is given in Fig. 1C, in which the free enzyme (E) most likely comprises several substates. In order to distinguish the substrate binding step from the cis/trans isomerization step on the enzyme, a titration of Pin1cat with the substrate WFYpSPRLKK was performed. The activity of Pin1cat was verified before the titration via a protease-coupled isomer-specific assay[38] using a suc-AEPF-pNA peptide substrate. Pin1cat has a kcat/Km of 380 +/− 20 mM−1sec−1 toward the assay substrate at 10°C.
Figure 1.

(A) Titration of Pin1 catalytic domain with substrate peptide WFYsPRLKK. Subset of Pin1cat residues exhibiting changes in chemical shift as a function of substrate concentration are plotted. Chemical shift changes (Δδ) are combined 1H/15N chemical shift changes calculated according to equation 6.
Kd for the complex was determined to be 0.80mM +/− 0.15. Residues plotted are Gln75 (▲), Gly123 (▼), Gly128 (◆), Gln129 (○) and Gly155 (△). (B) Reaction catalyzed by Pin1. (C) Minimal reaction scheme for the reaction catalyzed by Pin1. The reversible reaction allows for measurement of the isomerization step when the enzyme is saturated.
Monitoring the amide resonances of Pin1cat as a function of substrate concentration (up to 15mM), we observe chemical shift changes in 18 residues, all localized to the active site of the enzyme. A subset of these are plotted in Figure 1A. All backbone amides of Pin1cat were present as a single peak at every point of the titration. Under these conditions of fast exchange we can calculate the dissociation constant Kd by fitting the chemical shift changes to a quadratic equation:
| (3) |
where [complex] can be calculated from:
| (4) |
where Δδ is the change in chemical shift at a particular substrate concentration and δmax is the fitted difference in chemical shift between free and subtrate-saturated enzyme. Fitting the individual titration data to equations 3 and 4, a Kd of 0.8mM +/− 0.15 (mean +/− std. dev.) was determined. From this Kd, a 95% saturation of Pin1cat is calculated at a substrate concentration of 15mM. With this information in hand, we were able to design experimental conditions to dissect the the binding step from the isomerization step (see below).
Structural characterization of the turning-over complex
In order to obtain structural information on the turning-over complex of Pin1cat with the catalyzed substrate WFYpSPRLKK, we collected intra- and inter- molecular 13C/15N-edited 3D NOESY spectra in the substrate-saturated state. Intermolecular NOEs detected between the labelled protein and the unlabelled peptide can then be used to model a structure of the complex[39,40]. Importantly, the measured chemical shifts and NOEs are averaged over all the states that occur during catalysis since the sample represents a constantly turning-over enzyme.
A cursory analysis of the NOE data already suggests features of the action of Pin1cat. The majority of intermolecular NOEs between the substrate peptide and the enzyme correspond to substrate residues C-terminal to the prolyl bond, while signals from the N-terminus of the substrate are exchange broadened, indicative of a possible reorientation of residues N-terminal to the substrate proline due to the isomerization of the substrate. To obtain a coarse model of the complex structure, we started from the crystal structure of Pin1cat[37] and an extended substrate peptide with all peptide bonds in the trans conformation. Distance constraints based on the intermolecular NOEs (Table 1) were used for an initial energy minimization of the peptide-enzyme complex using the CHARMM[41] forcefields. We also used the position of the sulfate ion in the crystal structure as a distance constraint for the phosphate moiety of the peptide (Table 1). The minimized complex was solvated in a shell of TIP3[42] waters 16Å thick and the solvated system was equilibrated for 500ps at 300K after a 50ps heating step. The equilibrated complex has a RMSDbackbone of 0.875Å from the original minimization. A further minimization with no constraints was applied to the equilibrated complex resulting in the model shown in Figure 2. It has a RMSDbackbone of 0.471Å from the equilibrated structure.
Table 1.
List of Intermolecular Distance Restraints
| Distance Restraints from Intermolecular NOEs1 | |||
|---|---|---|---|
| Pin1cat residue | 1H(Pin1cat) | Peptide residue | 1H(Peptide) |
| Ala116 | HB | Tyr3 | HD2 |
| Leu61 | HD1 | pSer4 | HB1 |
| Asp153 | HB1 | pSer4 | HA |
| Val55 | HG1 | Pro5 | HG1 |
| Pro133 | HD1 | Pro5 | HG2 |
| Lys117 | HA | Leu7 | HD1 |
| Arg119 | HG2 | Leu7 | HD1 |
| Distance Restraints from Bound Sulfate in PDB (1PIN)2 | |||
| Pin1cat residue | Atom (Pin1cat) | Peptide residue | Atom (Peptide) |
| Arg68 | CZ | pSer4 | P1 |
| Arg69 | CZ | pSer4 | P1 |
Allowed distance range was 1.8–6.0 Å
Allowed distance range was 1.8–8.0 Å
Figure 2.
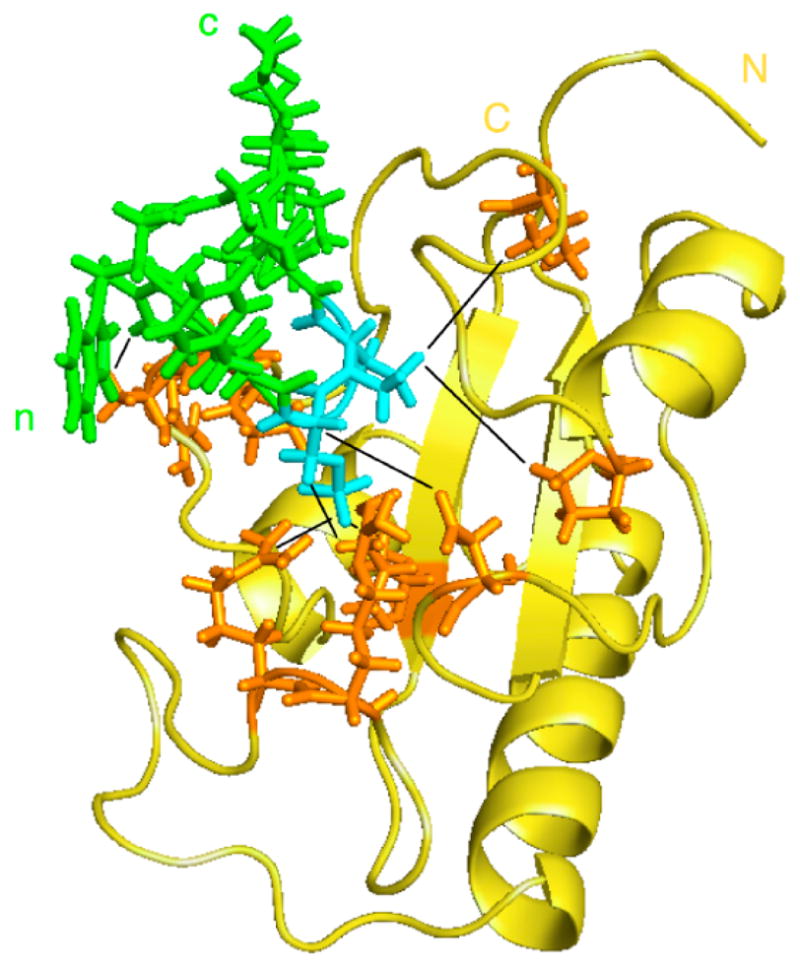
Model of the structure of the Pin1 catalytic domain in complex with the substrate peptide WFYpSPRLKK. Pin1cat is shown in gold with the sidechains of enzyme residues involved distance restraints depicted in orange. The substrate peptide is shown in green with the pS-Pro residues highlighted in cyan. The starting structure used was Pin1cat (PDB: 1PIN[37]) after removal of the Ala-Pro dipeptide and the sulfate ion in the active site. Distance constraints (shown as black lines) were defined based on intermolecular NOEs measured during catalytic turnover and on distances to the sulfate ion in the starting structure. Complex was energy-minimised and equilibrated using CHARMM[41].
In terms of protein conformation the model of the complex presents only minor differences when compared with the starting structure determined by Ranganathan et al[37]. In the resulting model the peptide substrate is bound in a cis conformation after minimization. Since we started with the trans conformation of the peptide before energy minimization, it suggests that at least some of the distance constraints derived from NOESY data represent the cis-bound conformation. However, we cannot rule out that this bias originates from the choice of starting structure of the protein in which the Ala-Pro peptide is bound in the cis conformation[37].
We want to emphasize that only a coarse model could be obtained because of the lack of inter- and intramolecular NOEs due to exchange broadening. However, the fact that a number of intermolecular NOEs are detected between the protein and peptide residues C-terminal to proline but no NOEs are detected for the N-terminal peptide residues suggests rearrangements primarily N-terminal to the proline.
Dissection of protein dynamics corresponding to binding and isomerization
Here, we investigated the dynamics of Pin1cat as a function of substrate. Transverse relaxation rates (R2obs) of Pin1cat were measured at different levels of saturation by the peptide substrate. We measured these rates using a pulse program that minimizes the suppression of Rex by using a single inversion pulse instead of the traditional train of refocusing pulses during the T2 delay[21] thus allowing us to detect the full increase in R2obs due to Rex. In the free enzyme, surface loops reveal flexibility in the micro-to-millisecond time regime as detected by increased R2obs. Upon addition of the substrate peptide, R2obs increases in residues surrounding the active site (Fig 3). However, different dependences are observed. A number of probes reveal a steep increase in R2obs reaching a maximum at a substrate concentration close to the dissociation constant (Fig. 3A). Beyond this point, the R2obs values for these residues show a decline and in the substrate saturated enzyme complex, R2obs for these residues is very close to that in the free enzyme. In contrast, for a second subset of probes, R2obs increases steadily to reach a plateau at saturating substrate concentrations (Fig. 3B).
Figure 3.

Conformational exchange of Pin1cat during catalysis. Transverse relaxation rates (R2obs) of Pin1cat were measured as a function of substrate concentration. Two distinct trends can be clearly observed: (A) The contribution to R2obs from conformational exchange reaches a maximum as the substrate concentration approaches the dissociation constant before diminishing close to zero in the saturated enzyme. Probes describing this trend are shown in blue in the complex structure (C).; the curve shows the individual measurements for Gly128 (A). (B) A second set of probes has a maxium conformational exchange contribution as the enzyme is saturated with substrate peptide, shown in red in (C). The curve shows the measurements corresponding to Gly155. Curves in A and B were fit by explicit numerical simulation of Bloch-McConnell equations[44] of magnetization evolution of a 3-state model (see Fig. 1C) using kex as calculated from CPMG experiments and Kd as calculated from the substrate titration (see text).
These distinct trends indicate that different probes in the enzyme are reporting on distinct conformational exchange processes. The minimal model for the isomerase reaction predicts two different kinds of processes (see Fig. 1C): substrate binding-release and substrate isomerization (the chemical step). Probes with a maximum R2obs in the saturated state must reveal conformational changes related to substrate isomerization while probes that show a lower R2obs in the saturated state relative to a state where significant populations of free and bound enzyme are present are reporting mainly conformational changes associated with substrate binding[43,4]. Strikingly, the two sets of probes are localized in different regions of the active site (Fig. 3C). Probes with a maximum R2obs at the dissociation constant and minima in the free and saturated state are located C-terminal to the substrate prolyl bond that is isomerized in the reaction. In contrast, probes with a maximum R2obs in the saturated state surround the N-termimus of the substrate peptide up to the isomerized bond. This distribution suggests a reaction trajectory in which Pin1cat isomerizes the substrate peptide by rotating the peptide N-terminal to the prolyl bond while keeping the C-terminal portion of the substrate relatively fixed. This is, in turn, consistent with the structural data described above since almost no intermolecular NOEs from the N-terminal substrate residues are detected, presumably due to their signals being exchange broadened by the cis/trans isomerization of the substrate when bound to the enzyme.
We performed a fit of R2obs values as determined by the above experiment to a numerical simulation of the magnetization evolution of a three-state system described by the Bloch-McConnell equations[44] using the Kd determined from the substrate titration and kex as determined from the relaxation experiments discussed below. A grid search for the other parameters in the model gave multiple solutions, confirming that the 3-site model can be fit with this values but is under-determined.
Determination of the rate of enzyme motions associated with the catalytic step
The timescale of an exchange process can be estimated by comparing Rex at different static (B0) fields. This timescale is characterized by a parameter α given by[45]:
| (5) |
where α takes values between 0 and 1 in a slow exchange process and values between 1 and 2 for an intermediate to fast process. Analysis of the dependence of Rex on B0 field showed that for all residues the exchange process in Pin1cat fell within the intermediate to fast time regime (Table 2). In this time regime, the relative populations and chemical shift differences of the states cannot be determined independently. Therefore, only kinetic parameters of the process can be extracted[45,46].
Table 2.
Scaling factors α for Pin1cat.
| Free Enzyme. | ||
|---|---|---|
| Pin1cat residue2 | α3 | +/−4 |
| Gln75 | 1.95 | 0.62 |
| Glu76 | 1.95 | 0.46 |
| Lys77 | 1.95 | 0.62 |
| Enzyme-Substrate Complex5 | ||
| Pin1cat residue2 | α3 | +/−4 |
| Arg68 | 1.95 | 0.31 |
| Arg69 | 1.95 | 0.29 |
| Ser71 | 1.93 | 0.73 |
| Ser72 | 1.93 | 0.56 |
| Gln75 | 1.93 | 0.38 |
| Lys77 | 1.94 | 0.90 |
| Ser114 | 1.94 | 0.40 |
| Ser115 | 1.95 | 0.35 |
| Lys117 | 1.93 | 0.56 |
| Gly123 | 1.94 | 0.34 |
| Gly128 | 1.94 | 0.58 |
| Gln129 | 1.94 | 0.53 |
| Lys132 | 1.92 | 0.67 |
| Ser154 | 1.94 | 0.61 |
| Gly155 | 1.15 | 0.26 |
| Ile158 | 1.94 | 0.60 |
Relaxation data collected at 11.7T and 14.1T
α values are reported for exchanging residues if the uncertainty in α is less than 50%
Values of Rex used in calculating α were estimated from the fits of R2(νCPMG) data to the general Carver-Richards equation as Rex = R2obs(33Hz) − R2o
Uncertainties in α are calculated by propagating the uncertainties in the fitted R2o and R2obs(33Hz)
Relaxation data collected at 11.7T and 16.9T
Using CPMG relaxation dispersion experiments (Fig 4A) we were able to detect and quantify the conformational exchange for residues in the active site of Pin1cat. As can be seen in Fig. 4, we can measure dynamics in probes surrounding the entirety of the substrate peptide, although the amplitude of the dispersion curve (an indicator of total Rex) is largest for those residues surrounding the N-terminus of the peptide substrate. This is consistent with the above described results of the substrate-concentration dependence of R2obs; residues reporting on the chemical step have large amplitudes in the dispersion curves collected at substrate-saturated concentrations. We can still detect conformational exchange in the residues that are primarily sensitive to binding, but the magnitude of Rex in these residues in the saturated complex is minimal compared to the magnitude of R2obs observed in these residues at lower substrate concentrations (Figure 2A). The Kd of 0.8 mM and the fact that binding/dissociation is fast on the NMR time scale at all substrate concentrations (kex ≫ Δω) implies that substrate binding and release at saturating concentrations is too fast to significantly contribute to the measured Rex: koff has to be 103sec−1 or faster to be fast on the NMR timescale with Δω values of about 100Hz, which means that kon has to be at least 106M−1sec−1 resulting in a pseudo first order on-rate of at least 1.5 × 10⁴sec−1 at 15mM substrate and a kex for binding/dissociation of at least 1.6 × 10⁴sec−1. Moreover, our titration data (Fig 3) clearly show that Rex due to binding at 15mM peptide concentration is less than 1Hz even for residues with an Rex contribution of 40Hz at intermediate substrate concentrations (Fig 3A).
Figure 4.

(A) Quantitative analysis of exchange dynamics in Pin1cat during turnover. Dependence of R2obs on a CPMG field was measured in the presence of saturating concentrations of substrate. Relaxation dispersion curves are shown for a subset of residues at 16.9T (Top) and 11.7T (Bottom) for residues in group A. A global fit to a 2-site exchange model reports an exchange rate of 1200 +/− 200 sec−1 for residues in Group A and a rate of 5000 +/− 2000 sec−1 is reported by residues in Group B at 25°C. Plots are shown for residues Arg69 (○), Ser114 (△), Gly155 (■) and Gln129 (◆). (B) Backbone 15N probes for Group A (Red) and Group B (Purple) are plotted on the structure.
Most exchanging residues exhibited similar kinetic parameters when fit individually to the general Carver-Richards equation[27,47]. Individually, all but three residues exhibit a kex in the 900–2200 sec−1 range. Residues 75,76 and 77 exhibit much faster kex. We grouped the exchanging residues accordingly (Table 3) and tested a global fit by comparing the improvement in Chi-squared over the individual fits. Assignment to groups was confirmed with a jackknife analysis. Residues in group A fit together with a kex of 1200 +/− 200 sec−1 (mean +/− std. dev.). Residues 75–77 (Group B) fit together with a kex of 5000 +/− 2000 sec−1. This large uncertainty belies the fact that this faster rate is close to the limit that can be reliably measured by dispersion.
Table 3.
Conformational Exchange in Pin1cat.
| Complex1 | Free enzyme2 | |||||||
|---|---|---|---|---|---|---|---|---|
| Group A | Group B | Group A | Group B | |||||
| Residue | Rex(sec−1)3 | +/− | Rex(sec−1) | +/− | Rex(sec−1) | +/− | Rex(sec−1) | +/− |
| Ser67 | 1.4 | 0.28 | ||||||
| Arg68 | 11.5 | 0.64 | ||||||
| Arg69 | 14.31 | 0.73 | 2.07 | 0.42 | ||||
| Ser71 | 2.92 | 0.38 | ||||||
| Ser72 | 3.27 | 0.33 | ||||||
| Gln75 | 10.77 | 0.72 | 3.66 | 0.37 | ||||
| Glu76 | 14.18 | 0.96 | 6.77 | 0.13 | ||||
| Lys77 | 7.18 | 0.76 | 3.35 | 0.53 | ||||
| Cys113 | 4.52 | 0.9 | 1.31 | 0.21 | ||||
| Ser114 | 6.74 | 0.47 | 3.02 | 0.41 | ||||
| Ser115 | 9.99 | 0.62 | 1.71 | 0.22 | ||||
| Lys117 | 3.48 | 0.35 | ||||||
| Leu122 | 2.30 | 0.44 | ||||||
| Gly123 | 7.68 | 0.46 | ||||||
| Gly128 | 4.54 | 0.47 | ||||||
| Gln129 | 7.16 | 0.68 | ||||||
| Gln131 | 3.74 | 0.54 | ||||||
| Lys132 | 4.21 | 0.50 | ||||||
| Ser154 | 4.51 | 0.48 | ||||||
| Gly155 | 13.46 | 0.73 | ||||||
| Ile158 | 3.91 | 0.42 | ||||||
Relaxation data collected at 16.9T at 25C
Relaxation data collected at 14.1T at 25C
Values of Rex were calculated from the fits of R2(νCPMG) data to the Carver-Richards equation in the fast-exchange regime.
To rule out that this apparent faster rate was not an artifact of the low Rex of these residues, we collected CPMG data at a second, lower temperature of 10°C. Dispersion profiles at this lower temperature confirmed that residues in Group B described a faster exchange process than those in Group A (Figure 6).
Figure 6.

Quantitative analysis of exchange dynamics in Pin1cat at 10°C. At a lower temperature, the two groups of exchanging residues can be more accurately detected. Top: Group B residues (Lys77(◇, Glu76(■) and Gln75(○)) in both the saturated complex (A) and the free enzyme (B, residues Lys77(□ and Gln75(△) are in fast exchange (kex 4100 +/− 1600 sec−1)). Bottom: this is clearly distinct from Group A residues which experience slower (kex of 1000 +/− 300 sec−1) conformational exchange in both the saturated complex (C, residues Ser114(○), Gln129(◇) and Ser 155(■)) and the free enzyme (D, residues Arg69(▽) and Ser114(●)). Group B residues are located in a single flexible loop. (See figs 4 and 5).
Dynamics in the free enzyme
Since NMR dynamics studies on a different prolyl-isomerase (CypA) in the free enzyme and during catalysis suggested that the motions necessary for catalysis are an intrinsic property of the enzyme[48], we wanted to test whether this might be a general property of prolyl isomerases. Therefore we examined the microsecond–millisecond dynamics of the free Pin1cat by CPMG dispersion experiments (Fig 5A). We observed dynamics in a number of probes within the large loop (residues 63–80) that contains the phosphate-binding residues as well as in part of the alpha-helix in the active site that contains the proposed catalytic cysteine 113 (see Fig. 5B). We observed the same distribution of two sets of exchanging residues as in the turning-over complex though with slightly different rates. The dispersion profiles can be globally fit with an exchange rate of 1500 +/− 300 sec−1 for Group A and 3500 +/− 1500 sec−1 for Group B at 25°C. The slightly larger uncertainty in the fitted kex of free Pin1cat compared to the fitted parameter in the complex data is mainly a consequence of the small Rex amplitude (relatively small chemical shift differences and/or highly skewed populations, see equation 2) described by the dispersion curves of the free enzyme.
Figure 5.

(A) Quantitative analysis of exchange dynamics in free Pin1cat measured at 14.1T (Top) and 11.7T (Bottom). Residues in Groups A and B can be globally fit to a 2-site model with an exchange rate of 1700 +/− 500 sec−1 and a rate of 3500 +/− 1500 sec−1 at 25°C, respectively. Plots are shown for residues Arg69 (○), Ser114 (△, Gln75 (■) and Lys77 (◆). (B) Residues in group A are highlighted in red while those in Group B are highlighted in purple. These dynamic regions of the free enzyme are a subset of the dynamic regions observed in the active complex (Fig. 4).
We note that for both the enzyme during turnover and the free enzyme, more complex models than a 2-site model are certainly possible, but the relaxation data can be well fit to this simple model. The presented data indicates that motions already exist in the free enzyme in regions where catalysis happens in the presence of substrate. The small amplitude of the dispersion curves together with the fact that the exchange is in the fast exchange regime for all residues prohibits extraction of Δω values in the free enzyme. Moreover, all residues with Rex in the turning-over enzyme are close to the substrate leading to direct chemical shift perturbations. Consequently, conclusions about the nature of the conformational transitions in the free enzyme relative to the motions during catalysis as performed in the dynamics studies of CypA[48] and Adk[49] cannot be made.
Conclusion
The conformational flexibility of proteins has been shown to be necessary for their function. Its role in enzyme catalysis, however, is not clear[1]. A detailed characterization of both conformational substates and dynamics will result in a more complete picture of how the structure and dynamics of the enzyme enable the catalysis of the chemical reaction. We have taken the first step in characterizing the dynamics of Pin1cat during substrate turnover. We have located the regions of the enzyme active site that undergo conformational changes upon substrate binding and during the catalytic step. The combination of NOE data collected during catalysis, R2 relaxation data as a function of substrate concentration and protein backbone dynamics data during catalysis point to a mechanism in which the substrate is anchored to the enzyme through peptide residues C-terminal to the proline and isomerization happens in regions N-terminal to proline concomitant with conformational changes in the enzyme. The rate of global conformational exchange detected during catalysis (1200 +/ − 200 sec−1 at 25°C) is in the same time regime as turnover rates determined by the coupled chymotrypsin assay (3300 sec−1 at 10°C for the substrate AApSerPR[50]). The kcat for the peptide used in our study is not known. For three residues (75–77) in a loop, a faster process is detected.
An exchange process in the active site in the free enzyme is detected with similar rates as measured during turnover. This phenomenon of micro- to millisecond motions in the free enzyme or when complexed with substrate analogues and the correspondance to turnover rates has been seen for a number of enzymes[2,5–7,9,11–19,22,48,23]. Thus, an emerging view arises that protein motions relevant for enzyme catalysis are “built into” the conformational flexibility of the protein. Future work aims to modulate the flexibility of the protein and determine the effect on its activity.
Experimental Methods
Sample Preparation
The DNA sequence correspoding to the catalytic domain of Pin1 (residues 51–163) was cloned into the BamH/Not1 sites of the pGEX vector to produce a GST-Pin1cat fusion protein with a thrombin cut site. This construct was expressed in E.Coli BL21 cells containing a pACYC plasmid. For 15N labelled protein samples, cells were grown in 15N minimal medium to an OD of 0.8 and induced with 1mM IPTG for 6 hours. For 15N, 13C labelled protein samples, cells were grown in 15N, 13C minimal medium containing 20% of 15N, 13C enriched media (Silantes) and induced with 1mM IPTG for 6 hours. After harvesting, cells were resuspended in buffer containing 10 mM Sodium phosphate pH 7.4, 150 mM Sodium Chloride, 1 mM DTT and sonicated at 4°C. The soluble supernatant was applied to a glutathione resin for 10 minutes and washed with resuspension buffer. Restriction grade thrombin (Novagen) (1 U per mg of fusion protein) was applied to the resin and the cleavage reaction was allowed to proceed for 12 hours at 4°C. Pin1cat-containing fractions were then collected and run through a Benzimidine sepharose column (Amersham) to deplete thrombin. The resulting sample was concentrated to 1 mM and exchanged into 5 mM Sodium Phosphate pH 6.7 containing 1 mM TCEP.
The substrate peptide nWFYpSPRLKKc was synthesized by Fmoc solid phase chemistry by the core facility at Boston Biomedical Research Institute and purified by reverse-phase chromatography in house. Concentrated peptide stock was prepared in 5 mM Sodium Phosphate with pH adjusted to 6.7.
Enzyme Activity
Activity of the Pin1cat samples used in this study was assayed via a protease-coupled isomer-specific assay[38] using a suc-AEPF-pNA peptide (Bachem) as a substrate. Assays were performed at 10°C in 5mM Sodium Phosphate pH 6.7 and 1mM DTT.
Resonance Assignments
Triple resonance experiments were collected on a Varian Inova 500 spectrometer. Assignments of Pin1cat were generated by using the following standard 3D NMR experiments: HNCACB[51], CBCA-(CO)NH[52], C(CO)NH[53,54], HCCH-TOCSY[55] and 15N HSQC-TOCSY[56] spectra of a 15N, 13C labelled sample of free enzyme. Assignments of the saturated Pin1cat were generated by following backbone amide resonances as substrate peptide was added. HNCA[57], C(CO)NH and 15N HSQC-TOCSY spectra were used to confirm the assignments of the enzyme in the substrate-saturated state.
Assignments of the substrate peptide resonances were done through homonuclear TOCSY and ROESY spectra of a 2 mM peptide sample.
Substrate Titration
A 15:1 peptide:Pin1cat ratio was sufficient for a 95% enzyme saturation as confirmed by fitting the chemical shift data to a quadratic binding isotherm equation (see text). Difference in chemical shift (in ppm), Δδ for the titration was calculated as:
| (6) |
Modeling of the Pin1cat-peptide complex
Inter- and intra-molecular NOEs were detected simultaneously and proton signals from the 15N, 13C labelled protein were selectively inverted[58,59]. A spectrum of inter-molecular NOEs between the unlabelled substrate and the isotopically labelled protein is thus generated and used to define a set of distance constraints for the complex. A structure model was constructed based on the previously published crystal structure of Pin1cat[37] and a generated extended structure of the substrate peptide. The model was then constrained in vacuum using the obtained distance constraints in Table 1. Energy minimization was then performed in two stages (steepest descent followed by 10000 steps of conjugate gradient). The minimized complex was then solvated with a shell of TIP3 waters[42] using Helmut Grubmueller’s SOLVATE program and equilibrated for 500ps before being minimized again without constraints. All enery minimization and molecular dynamics simulations were run with CHARMM[41].
NMR Relaxation Experiments
Two kinds of NMR relaxation measurements were taken on 15N labelled Pin1cat (1 mM in 5 mM Sodium phosphate, pH 6.7; 1 mM DTT) on a Varian Inova 600 spectrometer at 25°C. First, R2obs was measured as a function of substrate concentration using a pulse program that employs a single inversion pulse during the T2 delay to minimize suppression of Rex[21]. Spectra were collected on the free enzyme and of the enzyme in the presence of substrate peptide at increasing concentrations ranging from 0.1 mM to 15 mM. For each substrate:enzyme ratio, a series of spectra with T2 delays ranging from 5 msec to 120 msec were collected. Crosspeak intensities were fitted to a single exponential decay to obtain R2obs values. For higher substrate:enzyme ratio samples, an offset in R2obs due to increased sample viscosity was estimated from the trimmed mean values. R2obs values as determined by the above experiment were fit to a numerical simulation of the magnetization evolution of a three-state system described by the Bloch-McConnell equations[44] calculated using Mathematica.[43]
For quantification of the rates of chemical exchange, we used a 15N CPMG-TROSY pulse sequence.[28,26,60]. In this experiment the effective transverse relaxation rate (R2obs = R2o + Rex) is measured as a function of the strength of an B1 field applied through a train of 180° pulses during the T2 delay. Samples consisted of 1mM Pin1cat (with 15mM substrate peptide for the saturated enzyme experiments) in 5mM sodium phosphate, pH 6.7, 1mM DTT. The dispersion curves were collected with a T2 delay of 60 ms with a total of 17 field strengths ranging from 33 to 1000 Hz in an interleaved manner. Data were aquired on Varian Inova 500 and 600 spectrometers for the free enzyme and on Varian Inova 500 and 720 spectrometers for the saturated enzyme. Data at a lower temperature for both the free enzyme and the 95% saturated complex were collected at 600MHz with a relaxation delay of 50ms. R2obs at each CPMG field strength was extracted as described previously[28] except uncertainty in the measured R2obs was estimated from the average variance in R2obs observed in non-exchanging residues for each dataset. This uncertainty takes into account difference in signal/noise ratios as well as systematic errors[46]. This approach resulted in a more robust error estimation than by relying on the estimate based on a small number of duplicate measurements.
Kinetic parameters were estimated by fitting the dispersion curves to a 2-state model of the general Carver-Richards equation[27,47]. Separation of exchanging residues into groups was verified by comparing Chi-squared probabilities between individual and global fits. Proper assignment to groups were confirmed by jackknife analysis. Kinetic parameters and their uncertainties are calculated via a Monte-Carlo approach. In this appraoch 50 datasets of each residue are generated based on an initial fit of the collected data to which gaussian noise based on the experimental uncertainties of R2obs are added. From the generated data sets 50 global fits are performed. The reported kinetic parameter is the mean and its uncertainty is the standard deviation (see text).
Acknowledgments
We thank Jack Skalicky and Ashley Blue at NHMFL for magnet time. We would also like to thank Lewis Kay, Erik Zuiderweg and Robert Konrat for pulse sequences and Dmitry Korzhnev for global-fitting code as well as Ming Lei for computational structure modeling advice. Special thanks also to Michael Clarkson and Jordan Kerns for discussions on error analysis. This work was supported by NIH grants to D.K. and a DOE grant to D.K.
Footnotes
Publisher's Disclaimer: This is a PDF file of an unedited manuscript that has been accepted for publication. As a service to our customers we are providing this early version of the manuscript. The manuscript will undergo copyediting, typesetting, and review of the resulting proof before it is published in its final citable form. Please note that during the production process errors may be discovered which could affect the content, and all legal disclaimers that apply to the journal pertain.
References
- 1.Fersht A. Structure and Mechanism in Protein Science. W.H. Freeman; 2000. [Google Scholar]
- 2.Kay L. NMR studies of protein structure and dynamics. J Magn Reson. 2005;173(2):193–207. doi: 10.1016/j.jmr.2004.11.021. [DOI] [PubMed] [Google Scholar]
- 3.Palmer A. NMR characterization of the dynamics of biomacromolecules. Chem Rev. 2004;104(8):3623–40. doi: 10.1021/cr030413t. [DOI] [PubMed] [Google Scholar]
- 4.Kern D, Eisenmesser E, Wolf-Watz M. Enzyme dynamics during catalysis measured by NMR spectroscopy. Methods Enzymol. 2005;394:507–24. doi: 10.1016/S0076-6879(05)94021-4. [DOI] [PubMed] [Google Scholar]
- 5.Boehr D, McElheny D, Dyson H, Wright P. The dynamic energy landscape of dihydrofolate reductase catalysis. Science. 2006;313:1638–1642. doi: 10.1126/science.1130258. [DOI] [PubMed] [Google Scholar]
- 6.Boehr D, Dyson H, Wright P. An NMR perspective on enzyme dynamics. Chem Rev. 2006;106:3055–3079. doi: 10.1021/cr050312q. [DOI] [PubMed] [Google Scholar]
- 7.Massi F, Wang C, Palmer A. Solution NMR and computer simulation studies of active site loop motion in triosephosphate isomerase. Biochemistry. 2006;45:10787–10794. doi: 10.1021/bi060764c. [DOI] [PubMed] [Google Scholar]
- 8.Butterwick J, Palmer A. An inserted Gly residue fine tunes dynamics between mesophilic and thermophilic ribonucleases H. Protein Sci. 2006;15:2697–2707. doi: 10.1110/ps.062398606. [DOI] [PMC free article] [PubMed] [Google Scholar]
- 9.Tugarinov V, Kay L. Quantitative 13C and 2H NMR relaxation studies of the 723-residue enzyme malate synthase G reveal a dynamic binding interface. Biochemistry. 2005;44:15970–15977. doi: 10.1021/bi0519809. [DOI] [PubMed] [Google Scholar]
- 10.Tugarinov V, Kay L. Relaxation rates of degenerate 1H transitions in methyl group of proteins as reporters of side-chain dynamics. J Am Chem Soc. 2006;128:7299–7308. doi: 10.1021/ja060817d. [DOI] [PubMed] [Google Scholar]
- 11.Vallurupalli P, Kay L. Complementarity of ensemble and single-molecule measures of protein motion: a relaxation dispersion NMR study of an enzyme complex. Proc Natl Acad Sci U S A. 2006;103:11910–11915. doi: 10.1073/pnas.0602310103. [DOI] [PMC free article] [PubMed] [Google Scholar]
- 12.Stevens S, Sanker S, Kent C, Zuiderweg E. Delineation of the allosteric mechanism of a cytidyltransferase exhibiting negative cooperativity. Nat Struct Mol Biol. 2001;8:947–952. doi: 10.1038/nsb1101-947. [DOI] [PubMed] [Google Scholar]
- 13.Davis J, Agard D. Relationship between enzyme specificity and the backbone dynamics of free and inhibited alphalytic protease. Biochemistry. 1998:7696–7707. doi: 10.1021/bi972963p. [DOI] [PubMed] [Google Scholar]
- 14.Rozovsky S, Jogl G, Tong L, McDermott A. Solution-state NMR investigations of triosephosphate isomerase active site loop motion: Ligand release in relation to active site loop dynamics. J Mol Biol. 2001;310:271–280. doi: 10.1006/jmbi.2001.4673. [DOI] [PubMed] [Google Scholar]
- 15.Williams J, McDermott A. Dynamics of the flexible loop of triosephosphate isomerase: The loop motion is not ligand gated. Biochemistry. 1995;34:8309–8319. doi: 10.1021/bi00026a012. [DOI] [PubMed] [Google Scholar]
- 16.Falzone C, Wright P, Benkovic S. Dynamics of a flexible loop in dihydrofolate reductase from E.Coli and its implication for catalysis. Biochemistry. 1994;33:439–442. doi: 10.1021/bi00168a007. [DOI] [PubMed] [Google Scholar]
- 17.Osborne M, Schnell J, Benkovic S, Dyson H, Wright P. Backbone dynamics in dihydrofolate reductase complexes: Role of loop flexibility in the catalytic mechanism. Biochemistry. 2001;40:9846–9859. doi: 10.1021/bi010621k. [DOI] [PubMed] [Google Scholar]
- 18.Schnell J, Dyson H, Wright P. Structure, dynamics and catalytic function of dihydrofolate reductase. Annual Reviews Biophysics and Biomolecular Structure. 2004;33:119–140. doi: 10.1146/annurev.biophys.33.110502.133613. [DOI] [PubMed] [Google Scholar]
- 19.Ishima R, Freedberg D, Wang Y, Louis J, Torchia D. Flap opening and dimer interface flexibility in the free and inhibitor-bound HIV protease, and their implications for function. Structure Folding and Design. 1999;7:1047–1055. doi: 10.1016/s0969-2126(99)80172-5. [DOI] [PubMed] [Google Scholar]
- 20.Lukin J, Kontaxis G, Simplaceanu V, Yuan Y, Bax A, Ho C. Quaternary structure of hemoglobin in solution. Proc Natl Acad Sci U S A. 2003;100:517–520. doi: 10.1073/pnas.232715799. [DOI] [PMC free article] [PubMed] [Google Scholar]
- 21.Wang L, Pang Y, Holder T, Brender J, Kurochkin A, Zuiderweg E. Functional dynamics in the active site of the ribonuclease binase. Proc Natl Acad Sci U S A. 2001;98(14):7684–9. doi: 10.1073/pnas.121069998. [DOI] [PMC free article] [PubMed] [Google Scholar]
- 22.Cole R, Loria J. Evidence for flexibility in the function of ribonuclease A. Biochemistry. 2002;42:6072–6081. doi: 10.1021/bi025655m. [DOI] [PubMed] [Google Scholar]
- 23.Beach H, Cole R, Gill M, Loria J. Conservation of us-ms enzyme motions in the apo- and substrate-mimicked state. J Am Chem Soc. 2005;127(25):9167–76. doi: 10.1021/ja0514949. [DOI] [PubMed] [Google Scholar]
- 24.Farrow N, Muhandiram R, Singer A, Pascal S, Kay C, Gish G, Shoelson S, Pawson T, Forman-Kay J, Kay L. Backbone dynamics of a free and phosphopeptide-complexed Src homology 2 domain studied by 15N NMR relaxation. Biochemistry. 1994;33(19):5984–6003. doi: 10.1021/bi00185a040. [DOI] [PubMed] [Google Scholar]
- 25.Palmer A, Kroenke C, Loria J. Nuclear magnetic resonance methods for quantifying microsecond-to-millisecond motions in biological macromolecules. Methods Enzymol. 2001;339:204–38. doi: 10.1016/s0076-6879(01)39315-1. [DOI] [PubMed] [Google Scholar]
- 26.Loria J, Rance M, Palmer A. A TROSY CPMG sequence for characterizing chemical exchange in large proteins. J Biomol NMR. 1999;15(2):151–155. doi: 10.1023/a:1008355631073. [DOI] [PubMed] [Google Scholar]
- 27.Carver J, Richards R. A general two-site solution for the chemical exchange produced dependence of T2 upon the carr-purcell pulse separation. J Magn Reson. 1972;6:89–105. [Google Scholar]
- 28.Tollinger M, Skrynnikov N, Mulder F, Forman-Kay J, Kay L. Slow dynamics in folded and unfolded states of an SH3 domain. J Am Chem Soc. 2001;123(46):11341–52. doi: 10.1021/ja011300z. [DOI] [PubMed] [Google Scholar]
- 29.Göthel S, Marahiel M. Peptidyl-prolyl cis-trans isomerases, a superfamily of ubiquitous folding catalysts. Cell Mol Life Sci. 1999;55(3):423–36. doi: 10.1007/s000180050299. [DOI] [PMC free article] [PubMed] [Google Scholar]
- 30.Yaffe M, Schutkowski M, Shen M, Zhou X, Stukenberg P, Rahfeld J, Xu J, Kuang J, Kirschner M, Fischer G, Cantley L, Lu K. Sequence-specific and phosphorylation-dependent proline isomerization: a potential mitotic regulatory mechanism. Science. 1997;278(5345):1957–60. doi: 10.1126/science.278.5345.1957. [DOI] [PubMed] [Google Scholar]
- 31.Zhou X, Lu P, Wulf G, Lu K. Phosphorylation-dependent prolyl isomerization: a novel signaling regulatory mechanism. Cell Mol Life Sci. 1999;56(9–10):788–806. doi: 10.1007/s000180050026. [DOI] [PMC free article] [PubMed] [Google Scholar]
- 32.Zhou X, Kops O, Werner A, Lu P, Shen M, Stoller G, Küllertz G, Stark M, Fischer G, Lu K. Pin1-dependent prolyl isomerization regulates dephosphorylation of cdc25C and tau proteins. Mol Cell. 2000;6(4):873–83. doi: 10.1016/s1097-2765(05)00083-3. [DOI] [PubMed] [Google Scholar]
- 33.Weiwad M, Werner A, Rücknagel P, Schierhorn A, Küllertz G, Fischer G. Catalysis of proline-directed protein phosphorylation by peptidyl-prolyl cis/trans isomerases. J Mol Biol. 2004;339(3):635–46. doi: 10.1016/j.jmb.2004.04.021. [DOI] [PubMed] [Google Scholar]
- 34.Shen M, Stukenberg P, Kirschner M, Lu K. The essential mitotic peptidyl-prolyl isomerase Pin1 binds and regulates mitosis-specific phosphoproteins. Genes Dev. 1998;12(5):706–20. doi: 10.1101/gad.12.5.706. [DOI] [PMC free article] [PubMed] [Google Scholar]
- 35.Lu K, Liou Y, Vincent I. Proline-directed phosphorylation and isomerization in mitotic regulation and in Alzheimer’s disease. Bioessays. 2003;25(2):174–81. doi: 10.1002/bies.10223. [DOI] [PubMed] [Google Scholar]
- 36.Bayer E, Goettsch S, Mueller J, Griewel B, Guiberman E, Mayr L, Bayer P. Structural analysis of the mitotic regulator hPin1 in solution: insights into domain architecture and substrate binding. J Biol Chem. 2003;278(28):26183–93. doi: 10.1074/jbc.M300721200. [DOI] [PubMed] [Google Scholar]
- 37.Ranganathan R, Lu K, Hunter T, Noel J. Structural and functional analysis of the mitotic rotamase Pin1 suggests substrate recognition is phosphorylation dependent. Cell. 1997;89(6):875–86. doi: 10.1016/s0092-8674(00)80273-1. [DOI] [PubMed] [Google Scholar]
- 38.Fischer G, Wittmann-Liebold B, Lang K, Kiefhaber T, Schmid F. Cyclophilin and peptidyl-prolyl cis-trans isomerase are probably identical proteins. Nature. 1989;337:476–478. doi: 10.1038/337476a0. [DOI] [PubMed] [Google Scholar]
- 39.Wider G, Weber C, Wuthrich K. Proton-proton overhouser effects of receptor-bound cyclosporin A observed with the use of a heteronuclear-resolved half-filter experiment. Journal of the American Chemical Society. 1991;113:4676–4678. [Google Scholar]
- 40.Ikura M, Bax A. Isotope-filtered 2D NMR of a protein-peptide complex: Study of a skeletal muscle myosin light chain kinase fragment bound to calmodulin. Journal of the American Chemical Society. 1992;114:2433–2440. [Google Scholar]
- 41.Brooks BR, Bruccoleri RE, Olafson BD, States DJ, Swaminathan S, Karplus M. CHARMM: A program for macromolecular energy, minimization, and dynamics calculations. J Comp Chem. 1983;4:187–217. [Google Scholar]
- 42.Jorgensen W, Chandrasekhar J, Madura J, Impey R, Klein M. Comparison of simple potential functions for simulating liquid water. Journal of Chemical Physics. 1983;79(2):926–935. [Google Scholar]
- 43.Eisenmesser E, Bosco D, Akke M, Kern D. Enzyme dynamics during catalysis. Science. 2002;295(5559):1520–3. doi: 10.1126/science.1066176. [DOI] [PubMed] [Google Scholar]
- 44.McConnell H. Reaction rates by nuclear magnetic resonance. Journal of Chemical Physics. 1958;28(3):430–431. [Google Scholar]
- 45.Millet O, Loria J, Kroenke C, Pons M, Palmer A. The static magnetic field dependence of chemical exchange linebroadening defines the NMR chemical shift time scale. Journal of the American Chemical Society. 2000;122(12):2867–2877. [Google Scholar]
- 46.Ishima R, Torchia D. Error estimation and global fitting in transverse-relaxation dispersion experiments to determine chemical-exchange parameters. Journal of Biomolecular NMR. 2005;32:41–54. doi: 10.1007/s10858-005-3593-z. [DOI] [PubMed] [Google Scholar]
- 47.Korzhnev D, Karlsson B, Orekhov V, Billeter M. NMR detection of multiple transitions to low-populated states in azurin. Protein Sci. 2003;12(1):56–65. doi: 10.1110/ps.0225403. [DOI] [PMC free article] [PubMed] [Google Scholar]
- 48.Eisenmesser E, Millet O, Labeikovsky W, Korzhnev D, Wolf-Watz M, Bosco D, Skalicky J, Kay L, Kern D. Intrinsic dynamics of an enzyme underlies catalysis. Nature. 2005;438(7064):117–21. doi: 10.1038/nature04105. [DOI] [PubMed] [Google Scholar]
- 49.Wolf-Watz M, Thai V, Henzler-Wildman K, Hadjipavlou G, Eisenmesser E, Kern D. Linkage between dynamics and catalysis in a thermophilic-mesophilic enzyme pair. Nat Struct Mol Biol. 2004;11(10):945–9. doi: 10.1038/nsmb821. [DOI] [PubMed] [Google Scholar]
- 50.Zhang Y, Fussel S, Reimer U, Schutkowski M, Fischer G. Substrate-based design of reversible Pin1 inhibitors. Biochemistry. 2002;41:11868–11877. doi: 10.1021/bi0262395. [DOI] [PubMed] [Google Scholar]
- 51.Wittekind M, Mueller L. HNCACB, a high-sensitivity 3D NMR experiment to correlate amide-proton and nitrogen resonances with the alpha- and beta-carbon resonances in proteins. Journal of Magnetic Resonance B. 1993 Apr101(2) [Google Scholar]
- 52.Grzesiek S, Bax A. Correlating backbone amide and side-chain resonances in larger proteins by multiple relayed triple resonance NMR. J Am Chem Soc. 1992;114:6291–6293. [Google Scholar]
- 53.Grzesiek S, Anglister J, Bax A. Correlation of backbone amide and aliphatic side-chain resonances in 13C/15N-enriched proteins by isotropic mixing of 13C magnetization. Journal of Magnetic Resonance B. 1993;101(1):114–119. [Google Scholar]
- 54.Lyons BA, Montelione GT. An HCCNH triple-resonance experiment using carbon-13 isotropic mixing for correlating backbone amide and side-chain aliphatic resonances in isotopically enriched proteins. Journal of Magnetic Resonance B. 1993;101(2):206–209. [Google Scholar]
- 55.Kay LE, Xu GY, Singer AU, Muhandiram R, Forman-Kay JD. A gradient-enhanced HCCH-TOCSY experiment for recording side-chain 1H and 13C correlations in H2O samples of proteins. Journal of Magnetic Resonance B. 1993;101(3):333–337. [Google Scholar]
- 56.Zhang O, Kay LE, Olivier JP, Forman-Kay J. Backbone 1H and 15N resonance assignments of the N-terminal SH3 domain of drk in folded and unfolded states using enhanced-sensitivity pulsed field gradient NMR techniques. J Biomol NMR. 1994;4:845–858. doi: 10.1007/BF00398413. [DOI] [PubMed] [Google Scholar]
- 57.Kay LE, Xu GY, YT Enhanced-sensitivity triple-resonance spectroscopy with minimal H2O saturation. Journal of Magnetic Resonance A. 1994;109(1):129–133. [Google Scholar]
- 58.Eichmüller C, Schüler W, Konrat R, Kräutler B. Simultaneous measurement of intra- and intermolecular NOEs in differentially labeled protein-ligand complexes. J Biomol NMR. 2001;21(2):107–16. doi: 10.1023/a:1012480532569. [DOI] [PubMed] [Google Scholar]
- 59.Eichmüller C, Tollinger M, Kräutler B, Konrat R. Mapping the ligand binding site at protein side-chains in protein-ligand complexes through NOE difference spectroscopy. J Biomol NMR. 2001;20(3):195–202. doi: 10.1023/a:1011299009214. [DOI] [PubMed] [Google Scholar]
- 60.Pervushin K, Riek R, Wider G, Wuthrich K. Attenuated T2 relaxation by mutual cancellation of dipole-dipole coupling and chemical shift anisotropy indicates an avenue to NMR structures of very large biomolecular structures in solution. Proc Natl Acad Sci U S A. 1997;94(23):12366–12371. doi: 10.1073/pnas.94.23.12366. [DOI] [PMC free article] [PubMed] [Google Scholar]