Abstract
Acyl-CoA:diacylglycerol acyltransferase (DGAT) catalyzes the terminal step in triglyceride (TG) synthesis using diacylglycerol (DAG) and fatty acyl-CoA as substrates. In the liver, the production of VLDL permits the delivery of hydrophobic TG from the liver to peripheral tissues for energy metabolism. We describe here a novel high-content, high-throughput LC/MS/MS-based cellular assay for determining DGAT activity. We treated endogenous DGAT-expressing cells with stable isotope-labeled [13C18]oleic acid. The [13C18]oleoyl-incorporated TG and DAG lipid species were profiled. The TG synthesis pathway assay was optimized to a one-step extraction, followed by LC/MS/MS quantification. Further, we report a novel LC/MS/MS method for tracing hepatic TG synthesis and VLDL-TG secretion in vivo by administering [13C18]oleic acid to rats. The [13C18]oleic acid-incorporated VLDL-TG was detected after one-step extraction without conventional separation of TG and recovery by derivatizing [13C18]oleic acid for detection. Using potent and selective DGAT1 inhibitors as pharmacological tools, we measured changes in [13C18]oleoyl-incorporated TG and DAG and demonstrated that DGAT1 inhibition significantly reduced [13C18]oleoyl-incorporated VLDL-TG. This DGAT1-selective assay will enable researchers to discern differences between the roles of DGAT1 and DGAT2 in TG synthesis in vitro and in vivo.
Keywords: [13C18]oleic acid, triglyceride, glycerol-3-phosphate pathway, liquid chromatography/tandem mass spectrometry, high-content assay
Triglycerides (TGs) are the chief route of transport of dietary fat, within chylomicrons and VLDL, as well as the main form of fuel storage in adipose tissue. In addition, TGs play an important role in metabolism due to the fact that they are a major source of energy. TGs are synthesized from glycerol and three FA molecules; each FA is attached via an ester bond to hydroxyl groups of the glycerol backbone. Like many neutral lipids, TGs contain FA molecules with varying chain lengths; the most common are 16, 18, or 20 carbons. The two major biosynthetic pathways of TG are the glycerol-3-phosphate pathway, which exists primarily in liver and adipose tissues, and the monoacylglycerol pathway, which exists predominately in the intestine. The final step of the glycerol-3-phosphate biosynthetic pathway can be catalyzed by either diacylglycerol acyltransferase 1 (DGAT1) or DGAT2 (1, 2). Although DGAT1 and DGAT2 both convert diacylglycerol (DAG) to TG, they do not share similarity in either their nucleotide or amino acid sequences.
It has been reported that knockout mice lacking DGAT1 (DGAT1−/−) do not display obvious changes in TG metabolism in the liver (3). In contrast, knockout mice lacking DGAT2 (DGAT2−/−) display severely reduced TG content in the liver (4). Furthermore, studies have shown that suppression of DGAT2 with antisense oligonucleotides reduced hepatic TG content in rodents (5, 6) producing reversed diet-induced hepatic steatosis and insulin resistance in rats (5). These results suggest that DGAT1 and DGAT2 function differently in TG biosynthesis. The finding that multiple enzymes catalyze the synthesis of TG from DAG presents an opportunity to modulate one catalytic mechanism of this biochemical reaction. This type of modulation may produce therapeutic results without the potential adverse side effects that might occur if TG synthesis were completely inhibited in all tissues. By specifically inhibiting the activity of DGAT1 or DGAT2, compounds that inhibit the conversion of DAG to TG will be useful in lowering absorption and circulating concentrations of TG. This reduction could therapeutically counteract the pathogenic effects caused by abnormal lipid metabolism in obesity, metabolic syndrome, type II diabetes, and atherosclerosis.
Conventional in vitro assays for measuring cellular TG synthesis use radiolabeled substrates and are generally performed in a 6- or 12-well format. Furthermore, the product of the ultimate, DGAT-mediated step in the biosynthetic pathway is typically resolved by thin-layer chromatography (TLC) or by using a cumbersome organic solvent extraction procedure (4, 7, 8). Therefore, there is a need to develop a high-throughput, high-content in vitro cell-based DGAT assay. Moreover, stable isotope-labeled glycerol and palmitate have been used to measure the kinetics of VLDL-TG secretion and metabolism in vivo (9, 10). However, these methods require isolation of VLDL-TG by TLC and necessitate hydrolysis of the samples in order to release the glycerol/palmitate. Labeled VLDL-TG is typically quantified by indirect measurement of the derivatized stable isotope-labeled glycerol/palmitate by GC-MS. Here we describe a novel, high-throughput LC/MS/MS-based cellular assay for detecting newly synthesized TG using endogenously expressing DGAT1 cells and a stable isotope-labeled oleic acid. In addition to interrogating the last step in TG synthesis, this high-content assay allows profiling of other intermediate steps within the glycerol-3-phosphate pathway. Furthermore, to probe alterations in TG synthesis in vivo, we administered a bolus of stable isotope-labeled oleic acid to rats. The major species of stable isotope-labeled oleoyl-incorporated TG from plasma were detected by LC/MS/MS after a one-step sample extraction in high-throughput format. Using this assay, we explored changes in newly synthesized TG in cells endogenously expressing DGAT1, and examined the activity of a DGAT1 inhibitor on newly synthesized and secreted VLDL-TG in vivo.
MATERIALS AND METHODS
Materials and reagents
Ammonium formate, triolein, FA-free BSA (FAF-BSA), [13C18]oleic acid, and oleic acid were purchased from Sigma-Aldrich (St. Louis, MO). Diolein, and 1,3-di-heptadecanoyl-2-(10Z-heptadecanoyl)-sn-glycerol-d5 were obtained from Avanti Polar Lipids, Inc. (Alabaster, AL). Isopropyl alcohol, acetonitrile, and tetrahydrofuran were from EMD Chemicals, Inc. (Gibbstown, NJ). DGAT1-selective inhibitor A-922500 (Abbott), chemical name (1R,2R)-2-[[4’-[[phenylamino)carbonyl]amino] [1,1’-biphenyl]4-yl]carbonyl]cyclopentanecarboxylic acid, was purchased from Tocris Bioscience (Ellisville, MO). JNJ compound A, chemical name N-[2,6-dichloro-4-(pyrrolidin-1-ylmethyl)phenyl]4-(4-{[(4-methoxyphenyl)acetyl]amino}phenyl)piperazine-1-carboxamide), was synthesized by in-house chemists.
In vitro assays for recombinant hDGAT1 and hDGAT2 activity
The determination of recombinant human DGAT1 (hDGAT1) or hDGAT2 activity was readily achieved using a high-throughput screening FlashPlate assay. In this assay, recombinant hDGAT1 or hDGAT2 was produced in the baculovirus expression system. Sf9 insect cells were infected for 72 h. Cell pellets were resuspended in homogenization buffer (0.1 M sucrose, 50 mM KCl, 40 mM KH2PO4, 30 mM EDTA, pH 7.2). Cells were homogenized. After centrifugation at 2,500 g for 15 min at 4°C, the pellet was resuspended in 500 ml lysis buffer, and total cell membranes were collected by ultracentrifugation at 100,000 g for 60 min at 4°C. The collected membranes were resuspended in homogenization buffer. DGAT1 activity in membrane preparations was assayed in 50 mM Tris-HCl (pH 7.4), 1 μg/ml DGAT1 membranes, 150 mM MgCl2, 1 mM EDTA, and 0.2% BSA, containing 50 μM diolein, 32 μg/ml l-α-phosphatidylcholine/l-α-phosphatidyl-l-serine, 8.4 μM oleoyl CoA, and 12 nM oleoyl CoA [3H] (at a specific activity of 30 nCi/well) in a final volume of 50 μl in 384-well format using the red-shifted Basic Image FlashPlateTM (Perkin Elmer cat. no. SMP400). The plates were sealed and the vesicles allowed to settle overnight at room temperature. The formed [3H]-labeled TG product is in close proximity to the incorporated scintillant in the FlashPlate and can be quantified directly by scintillation counting in a Topcount. The [3H]oleoyl-CoA, on the other hand, remains soluble in the aqueous solution and does not in close proximity to the scintillant-coated bottom of the plate. DGAT2 activity in membrane preparations was assayed in 50 mM Tris-HCl (pH 7.4), 32 μg/ml DGAT2 membranes, 5 mM MgCl2, 1 mM EDTA, and 0.2% BSA, containing 200 μM diolein, 32 μg/ml l-α-phosphatidylcholine/l-α-phosphatidyl-l-serine, 10 μM oleoyl CoA, and 12 nM oleoyl CoA[3H] (at a specific activity of 30 nCi/well) in a final volume of 50 μl in a 384-well format using the red-shifted Basic Image FlashPlateTM (Perkin Elmer cat. no. SMP400). The reaction mixture was incubated for 120 min at 37°C, and the enzymatic reaction was stopped by adding 20 μl of 250 mM N-ethylmaleimide. The plates were sealed, and the vesicles were allowed to settle overnight at room temperature. Plates were centrifuged for 5 min at 2,500 g and measured in a Leadseeker (GE Healthcare). Various concentrations of JNJ compound A were added to individual wells prior to the addition of membranes. The final DMSO concentration in the reaction was 1%. The potencies of DGAT-1 inhibition for the compounds were determined by calculating the IC50 values, defined as the inhibitor concentration from the sigmoidal dose-response curve at which the enzyme activity was inhibited 50%.
MTP, SCD-1, and apoB secretion assays
Microsomal triglyceride transfer protein (MTP) activity was determined using purified dog hepatic microsomes as previously described (11). The steroyl-CoA desaturase 1 (SCD-1) activity in rat liver microsomes was determined by measuring the conversion of stearoyl-CoA (18:0 CoA) to oleoyl-CoA (18:1 CoA) (12). An apolipoprotein B (apoB) secretion assay was performed in HepG2 cells. Briefly, HepG2 cells were maintained overnight in a humidified 5% CO2 atmosphere at 37°C. On the day of the experiment, the medium was replaced with medium consisting of DMEM with 4.5 g/l glucose, supplemented with 10% charcoal/dextran-treated FBS and 100 U/ml each penicillin and streptomycin, with or without test compound. Twenty-four hours later, growth medium was collected and assessed for apoB content by a noncompetitive binding ELISA procedure.
Cell culture and Western blot analyses
The HEK293 cell line from Invitrogen (Carlsbad, CA) was maintained in DMEM containing 10% FBS. One day prior to the experiment, the cells were seeded in a 96-well poly-d-lysine plate at approximately 65,000 cells per well, and assayed at confluency. For Western analyses, total cellular proteins (100 μg) were separated by 10% SDS-PAGE and transferred to a polyvinylidene difluoride membrane. Antibodies used for immunodetection were the following: rabbit anti-DGAT1 antibody (H-255; 1:200 dilution, Santa Cruz Biotechnology, Inc., Santa Cruz, CA); and a rabbit anti-DGAT2 (human) antibody (HPA013351; 1:200 dilution, Sigma-Aldrich).
Metabolic stable isotope labeling of the TG pathway in HEK293 cells
After one washing with PBS (pH 7.4), the confluent HEK293 cells were incubated with DMEM supplemented with 25 mM HEPES (pH 7.5) and 0.2% FAF-BSA at 37°C/5% CO2 for 60 min. DGAT1 inhibitors were added to cells in a concentration-dependent manner to a final concentration of 0.2% DMSO/vehicle in DMEM supplemented with 25 mM HEPES (pH 7.5) and 0.2% FAF-BSA. Control wells received 0.2% DMSO without compound. Cells were incubated with 0.2% DMSO or compound at 37°C/5% CO2 for 15 min. [13C18]oleic acid, complexed with FAF-BSA, in DMEM supplemented with 25 mM HEPES (pH 7.5) and 0.2% FAF-BSA, was added to each well at a final concentration of 150 μM. The plates were incubated for 2 h at 37°C, and the medium was removed. After brief air-drying, 100 μl freshly prepared extract solvent (90% isopropyl alcohol and 10% tetrahydrofuran, containing 20 nM of the internal standard [1,3-di-heptadecanoyl-2-(10Z-heptadecanoyl)-sn-glycerol-d5], was added and allowed to stand at room temperature for 15 min with shaking. The extraction mixture (80 μl) was transferred to glass inserts in a 96-well deep-well plate. The plate was centrifuged at 3,000 rpm for 5 min, and the extracted samples were analyzed via LC/MS/MS. Percentage inhibition was calculated as 100−[(sample−low control)/(vehicle−low control) ×100], where low control is no addition of [13C18]oleic acid. A best-fit curve is fitted by a minimum sum-of-squares method to the plot of percent inhibition versus compound concentration in GraphPad Prism software.
Metabolic stable isotope labeling of VLDL-TG in rats
Adult male Sprague Dawley rats weighing 250 to 300 g with free access to water and standard laboratory rat chow were used in this study. The Institutional Animal Care and Use Committee (IACUC) of Johnson and Johnson Pharmaceutical Research and Development approved all procedures. [13C18]oleic acid was complexed with 10% FAF-BSA in saline. Rats were anesthetized with ketamine (90 mg/kg) and xylazine (20 mg/kg) via intramuscular administration. After the ventral surface of the neck was shaved to make a mid-cervical incision to expose the right carotid artery and jugular vein, a 25 g intravenous angiocatheter needle was inserted into each vesselfor arterial blood sampling and [13C18]oleic acid injection at 10 mg/kg, respectively. Time points for blood samples were pretreatment, 5, 15, 30, 60, 90, and 120 min posttreatment. A 0.4 ml blood sample with a 1 ml syringe containing EDTA was taken, and samples were centrifuged immediately at 500 g for preparation of plasma. Plasma samples (10 μl) were transferred into glass inserts in a 96-well plate. An aliquot of 150 μl of extraction solvent (chloroform-methanol, 2:1 v/v) containing 0.2 μM internal standard [1,3-di-heptadecanoyl-2-(10Z-heptadecanoyl)-sn-glycerol-d5] was added to each well with a multichannel pipette and mixed. The 96-well plate was allowed to stand at room temperature for 30 min, and was then centrifuged at 3,000 rpm for 10 min on a Beckman Allegra 6 Centrifuge. The supernatant (100 μl) was transferred into a glass insert in another 96-well plate with a multi-channel pipette, and solvent was evaporated to dryness under a stream of nitrogen gas. The sample residues were reconstituted with 100 μl of solvent (isopropanol-tetrahydrofuran, 2:1 v/v) and mixed prior to LC/MS/MS analysis. For the DGAT1 inhibitor study, vehicle (5% solutol, 10% cremophor RH40, and 85% hydroxypropyl β cyclodextrin) or JNJ compound A solubilized in the vehicle was administered by subcutaneous injection. The inhibitor dose volume was 1 ml/kg. Thirty minutes later, [13C18]oleic acid complexed with 10% FAF-BSA in saline was administered intravenously as described above. Time points for blood sample collection were pretreatment, and 30 and 60 min posttreatment, as described above.
LC/MS/MS analyses
An Agilent 1100 liquid chromatographic system (Agilent Technologies; Palo Alto, CA) was interfaced with a Micromass triple-quadrupole Quattro Micromass spectrometer (Waters; Milford, MA) through a Z-spray electrospray ion source. Separation of the metabolites was performed on an Eclipse XDB-C8 column (2.1 × 50 mm, particle size = 3.5 μm). Mobile Phase A was 5 mM ammonium formate in acetonitrile-water (95:5). Mobile phase B was 5 mM ammonium formate in isopropanol-water (95:5). These mobile phases were used for a linear gradient elution as follows: 50–80% B in 5 min, hold 80% B for 1 min, return to 50% B in 0.1 min, and post run time of 5 min. The flow rate was 0.3 ml/min, and sample injection volume was 3 μl. The mass spectrometer was operated in the positive-ion multi-reaction monitoring mode for the detection of a specific molecular mass transition m/z (M+NH4) > [MNH4 – (RCOOH+NH3)] for each TG at a collision energy of 25 eV. Nitrogen was used as nebulizing gas and desolvation gas, and argon was used as collision gas. The MS source parameters were set as follows: capillary voltage, 3.1 kV; cone voltage, 25 V; extractor, 2V; RF lens, 0.1 V; source temperature, 120°C; desolvation temperature, 300°C; cone gas flow, 50 l/hr; and desolvation gas flow, 700 l/hr. MassLynx software version 4.1 was used for system control and data processing.
RESULTS AND DISCUSSION
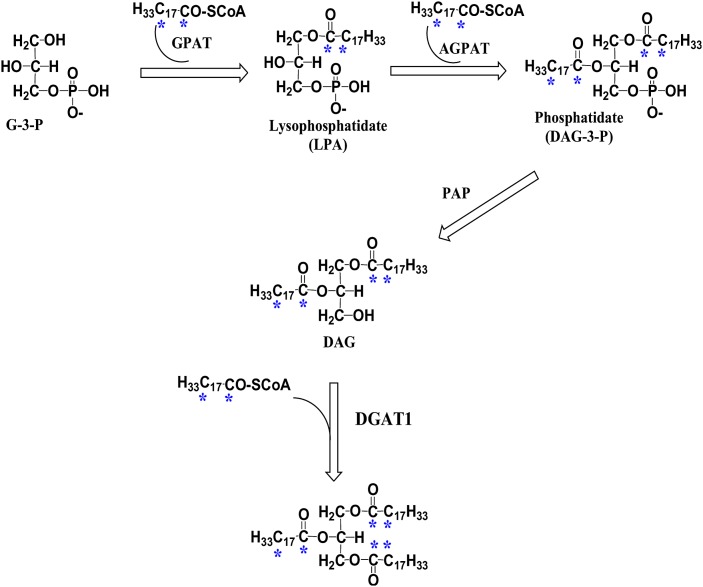
The conventional cell-based TG synthesis assay uses radiolabeled FAs to metabolically label TG molecules. The radiolabeled hydrophobic TG product is typically resolved by TLC (4, 7, 8). However, LC/MS/MS is becoming the preferred method for quantitative lipid analysis due to the ease of automation, accuracy, and sensitivity, and the avoidance of radioactivity. Because triolein is the most-abundant TG in mammals and oleoyl-CoA may be the most-physiologically relevant acyl donor for the DGAT reaction, stable isotope-labeled oleic acid ([13C18]oleic acid) was chosen to metabolically trace DAG and TG synthesis. After loading the cells with [13C18]oleic acid complexed with FAF-BSA, [13C18]oleic acid was converted to [13C18]oleoyl-CoA (H33C17CO-SCoA) before entering the glycerol-3-phosphate pathway (Fig. 1). Multiple conditions were tested before choosing a suitable solvent (e.g., 90% isopropyl alcohol and 10% tetrahydrofuran) to extract neutral lipids from the cell monolayer in a 96-well format. This solvent mixture efficiently extracts neutral lipids, similar to the standard chloroform/methanol method (data not shown), and is compatible with direct LC/MS/MS analysis without solvent exchange.
Fig. 1.
Illustration of the glycerol-3-phosphate pathway. [13C18]oleic acid is sequentially incorporated into the glycerol backbone to form triglyceride (TG). The asterisks indicate the positions of stable 13C isotope incorporated from the [13C18]oleic acid precursor [13C18]oleoyl-CoA (H33C17CO-SCoA). The enzymes involved are glycerol-3-phosphate acyltransferase (GPAT), acylglycerophosphate acyltransferase (AGPAT), phosphatidic acid phosphohydrolase (PAP), and diacylglycerol acyltransferase (DGAT).
Analysis of cell-based [13C18]oleic acid incorporation into DAG and TG
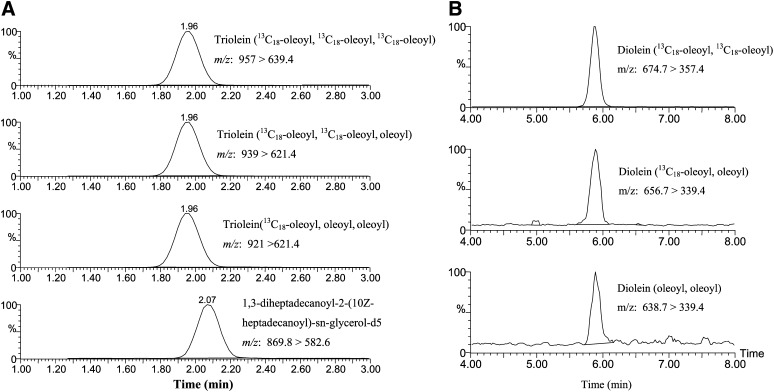
The [13C18]oleic acid-incorporated DAGs and TGs in HEK293 cells were extracted and analyzed by LC/MS/MS (Fig. 2). The triolein species containing three, two, or one [13C18]oleoyl side chains were designated as triolein ([13C18]oleoyl, [13C18]oleoyl, [13C18]oleoyl), triolein ([13C18]oleoyl, [13C18] oleoyl, oleoyl), and triolein ([13C18]oleoyl, oleoyl, oleoyl), respectively (Fig. 2A). In addition, [13C18]oleoyl-incorporated DAGs were also analyzed in a separate run. Two major [13C18]-labeled DAGs, diolein ([13C18]oleoyl, [13C18]oleoyl) and diolein ([13C18]oleoyl, oleoyl), along with endogenous diolein (oleoyl, oleoyl) were detected (Fig. 2B). The particular position of the [13C18]oleoyl or oleoyl group in the side chain of triolein or diolein is not distinguishable using LC/MS/MS.
Fig. 2.
Positive-ion ESI multi-reaction monitoring chromatograms of [13C18]oleoyl-incorporated TGs and diacylglycerols from HEK293 cell extracts. A: Triolein ([13C18]oleoyl, [13C18]oleoyl, [13C18]oleoyl), triolein ([13C18]oleoyl, [13C18]oleoyl, oleoyl), triolein ([13C18]oleoyl, oleoyl, oleoyl), and internal standard, 1,3-di-heptadecanoyl-2-(10Z-heptadecanoyl)-sn-glycerol-d5. B: Diolein ([13C18]oleoyl, [13C18]oleoyl), diolein ([13C18]oleoyl, oleoyl), and endogenous diolein (oleoyl, oleoyl).
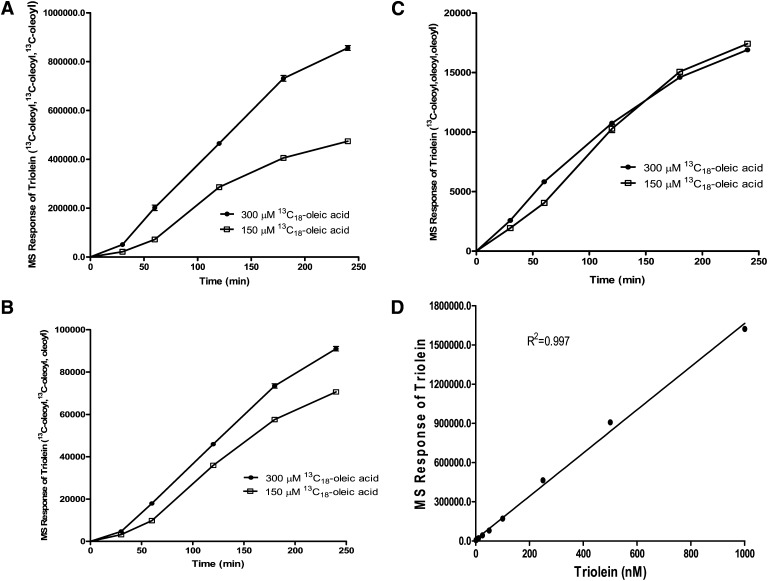
We determined the time course of [13C18]oleoyl incorporation into TG in HEK293 cells using 150 μM and 300 μM of [13C18]oleic acid (Fig. 3). [13C18]oleic acid concentrations were consistent with the concentration of exogenous oleic acid used to stimulate cellular TG synthesis (13, 14). Under our experimental conditions, three [13C18]oleoyl-incorporated triolein, designated as triolein ([13C18]oleoyl, [13C18]oleoyl, [13C18]oleoyl), represented approximately 90% of the total [13C18]oleoyl-incorporated triolein in the cells, assuming the same LC/MS/MS sensitivity among the three triolein species (Fig. 3A, B, C). Because the three different [13C18]oleoyl-incorporated triolein species were not available to be used as reference standards, we used unlabeled triolein to determine its concentration-dependent LC/MS/MS response. The MS signal of triolein relative to the internal standard [1,3-di-heptadecanoyl-2-(10Z-heptadecanoyl)-sn-glycerol-d5] showed a linear response to approximately 1,600,000 MS units or approximately 1 μM triolein. This was the highest concentration used (Fig. 3D), suggesting that our MS response of [13C18]oleoyl-incorporated triolein was within the linear range of detection.
Fig. 3.
Time course of [13C18]oleoyl-incorporated triolein. HEK293 cells were incubated with [13C18]oleic acid, precomplexed to FA-free BSA at a concentration of 150 μM or 300 μM for indicated times. Lipids were extracted and analyzed by LC/MS/MS. A: Triolein containing three [13C18]oleoyl side chains. B: Triolein containing two [13C18]oleoyl side chains. C: Triolein containing one [13C18]oleoyl side chain. D: Concentration-dependent linear response of triolein. All mass units are relative to an internal standard. Values represent the mean of three data points ± SEM.
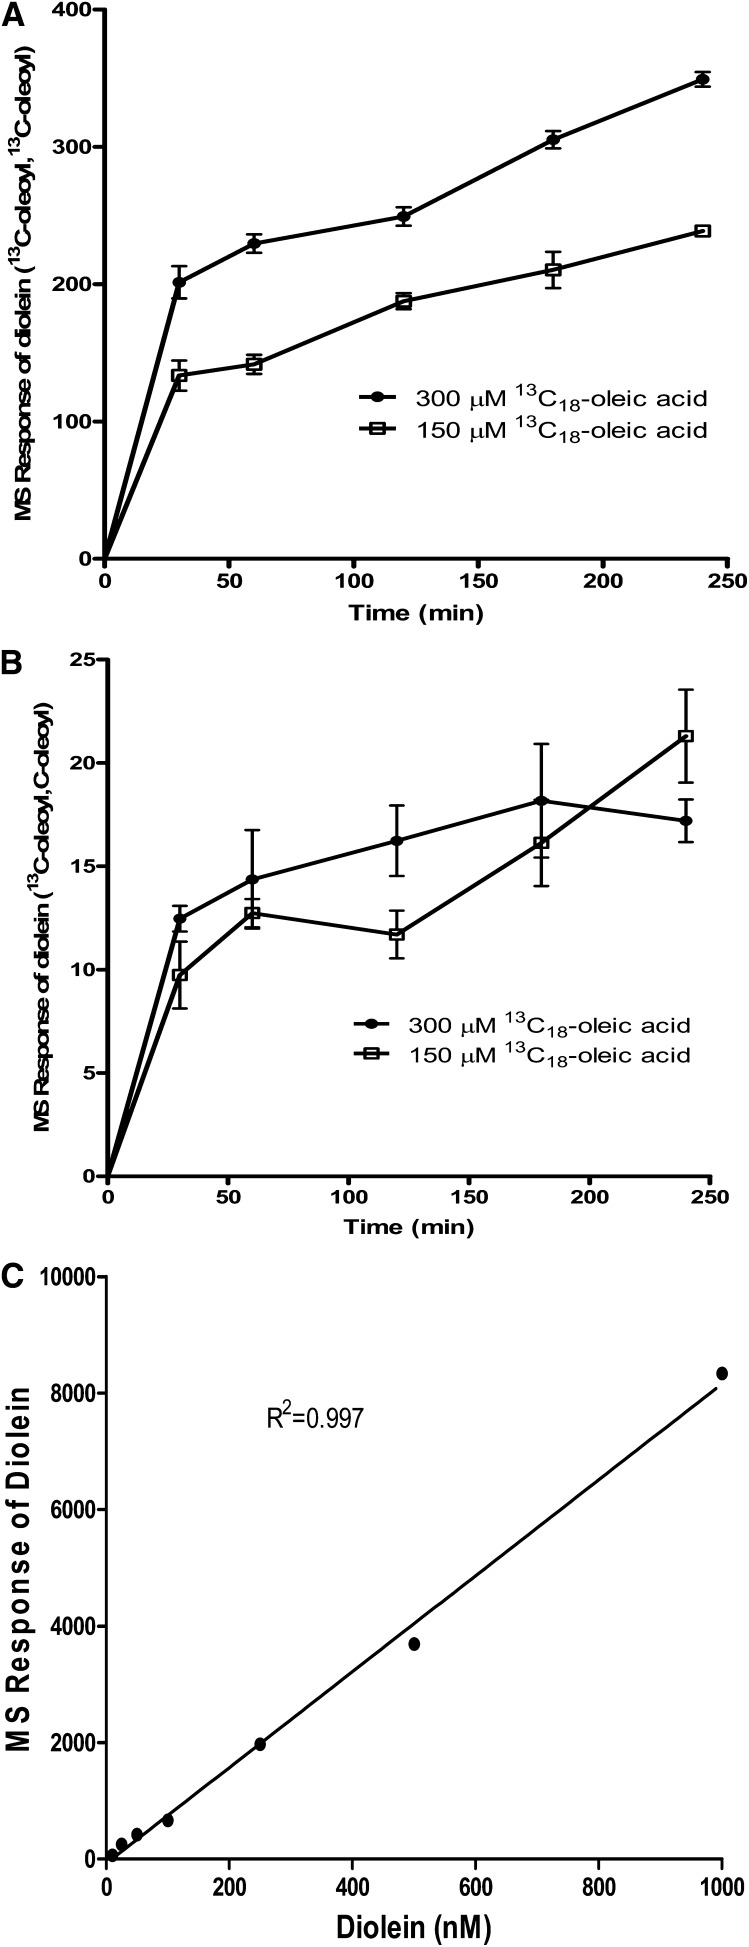
Next, we determined the time course of [13C18]oleoyl-incorporated DAG in HEK293 cells using 150 μM and 300 μM of [13C18]oleic acid. Accordingly, two [13C18]oleoyl-incorporated dioleins ([13C18]oleoyl, [13C18]oleoyl) were found to be significantly higher than one [13C18]oleoyl-incorporated diolein ([13C18]oleoyl, oleoyl) (Fig. 4A, B). The MS signal of diolein relative to the internal standard showed a linear response at least to approximately 8,000 MS units or 1 μM diolein (Fig. 4C). This implied that the amount of diolein ([13C18]oleoyl,[13C18]oleoyl) generated was well below 1 μM and was in the linear range of detection.
Fig. 4.
Time course of [13C18]oleoyl-incorporated diolein. The same samples of HEK293 cell extracts as described in Fig. 3 were analyzed for [13C18]oleoyl-incorporated diolein. A: Diolein containing two [13C18]oleoyl side chains. B: Diolein containing one [13C18]oleoyl side chain. C: Concentration-dependent linear response of diolein. All mass units are relative to an internal standard. Values represent the mean of three data points ± SEM.
A recent study using HepG2 cells revealed that oleic acid-stimulated TG synthesis did not affect the cellular DAG content (14), suggesting that the newly synthesized DAG was readily converted to TG. Interestingly, [13C18]oleoyl-incorporated diolein ([13C18]oleoyl,[13C18]oleoyl) rose significantly at 30 min and then increased at a slower rate (Fig. 4A). In contrast, [13C18]oleoyl-incorporated triolein rose only slightly at 30 min and then increased at a faster rate following this initial lag (Fig. 3A). Taken together, these results suggested that newly synthesized diolein ([13C18]oleoyl, [13C18]oleoyl) was rapidly converted to triolein and did not accumulate to any extent.
In vitro profile of two DGAT1-selective inhibitors
JNJ compound A, chemical name N-[2,6-dichloro-4-(pyrrolidin-1-ylmethyl)phenyl]4-(4-{[(4-methoxyphenyl)acetyl]amino}phenyl)piperazine-1-carboxamide, was discovered in-house as a potent selective DGAT1 inhibitor (Table 1) (15). The IC50 of human recombinant DGAT1 is 0.019 ± 0.004 μM; the IC50 of human recombinant DGAT2, dog MTP, human recombinant ACAT2, human recombinant stearoyl-CoA desaturase 1 (SCD-1), the cellular apoB secretion assay, the human recombinant peroxisome proliferator-activated receptor α (PPARα) and PPARγ, were all greater than 10 μM (Table 1). In addition, Abbott Laboratories has reported a highly potent and selective DGAT1 inhibitor, A-922500 (16), that has an IC50 of 0.007 μM when tested against human recombinant DGAT1 and greater than 10 μM against recombinant DGAT2, ACAT1, and ACAT2 (16).
TABLE 1.
In vitro activity of JNJ compound A
| DGAT1 Inhibitor | DGAT1 | DGAT2 | ACAT1 | ACAT2, MTP, ApoB, PPARα, PPARγ |
|---|---|---|---|---|
| IC50 (μM) | ||||
| JNJ compound A | 0.019 | >10 | 1 | >10 |
Inhibition of cell-based DGAT activity
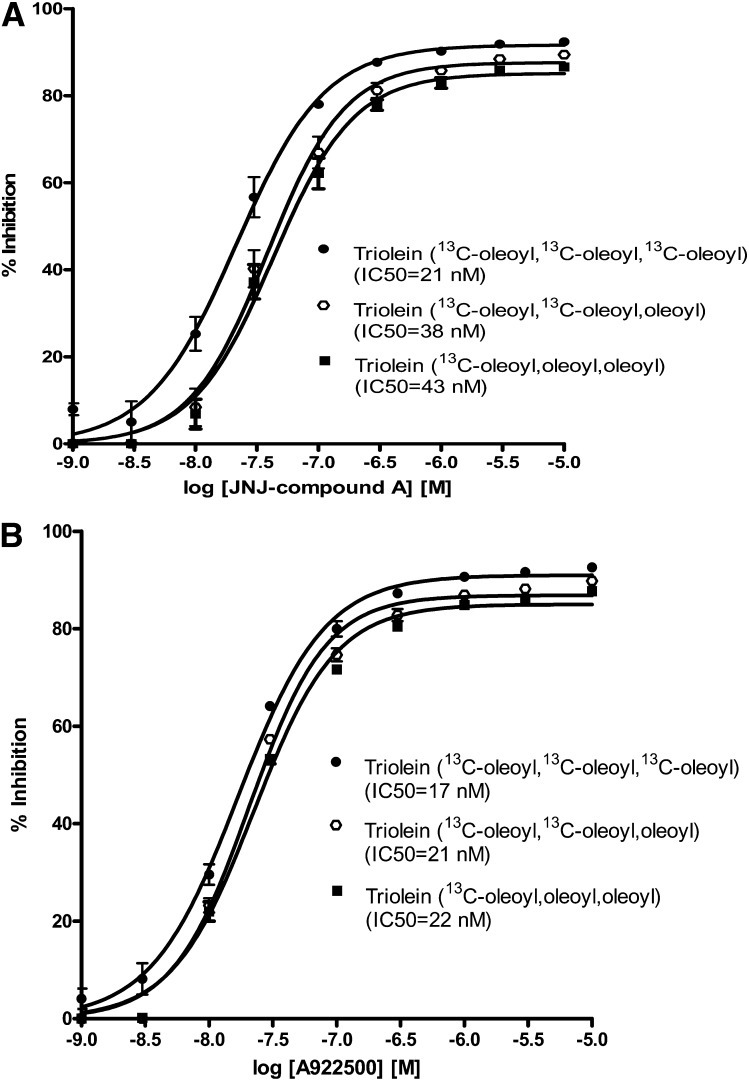
During assay development, we tested two different chemotypes of potent and selective DGAT1 inhibitors, JNJ compound A and the commercially available compound A-922500 (16). The IC50 values for these inhibitors in the cell-free recombinant human DGAT1 enzyme assay were 19 nM (Table 1) and 7 nM (16), respectively. Both were devoid of DGAT2 inhibitory activity (15, 16). Inhibition of cellular DGAT1 activity by the two DGAT1 inhibitors was concentration dependent as measured by the percentage decrease in the production of three [13C18]oleoyl-incorporated triolein, two [13C18]oleoyl-incorporated trioleins, and one [13C18]oleoyl-incorporated triolein (Fig. 5). We calculated the IC50 values based on the percentage of inhibition for each labeled triolein using the standard Prism curve-fitting program (Fig. 5). The IC50 values for [13C18]oleoyl triolein incorporation in this cell-based assay for JNJ compound A and A-922500 were 21 nM and 17 nM, respectively.
Fig. 5.
DGAT inhibition of [13C18]oleoyl-incorporated triolein in HEK293 cells by two potent DGAT1-selective inhibitors. A: A selective DGAT1 inhibitor, JNJ compound A, in the cell-based assay. B: Selective DGAT1 inhibitor A-922500 in the cell-based assay. Values represent the mean of three data points ± SEM.
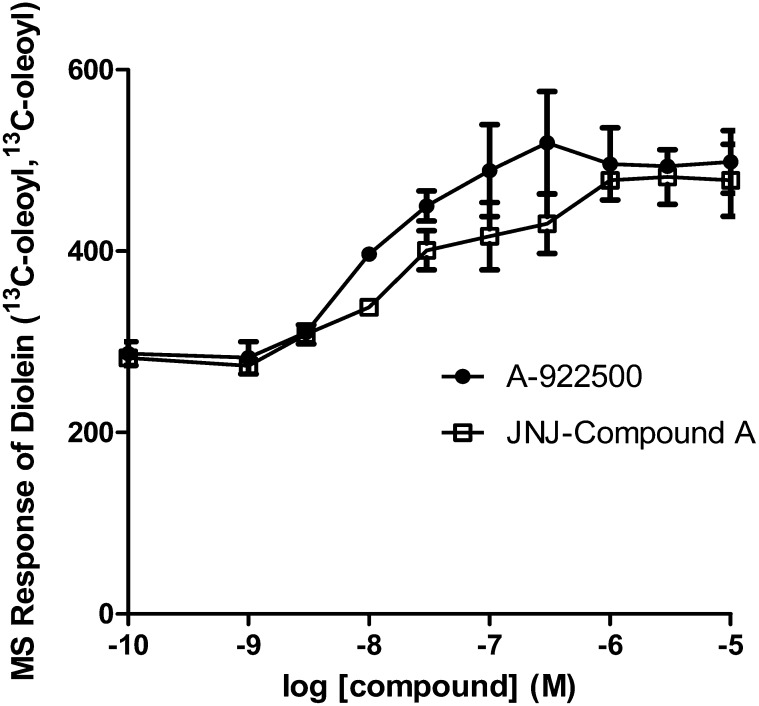
We then determined the [13C18]oleoyl-incorporated diolein levels in the same samples as exhibited in Fig. 5. Because the signal and abundance of one [13C18]oleoyl-incorporated diolein were considerably lower than those of two [13C18]oleoyl-incorporated dioleins, we plotted the LC/MS/MS response of diolein ([13C18]oleoyl, [13C18]oleoyl) in cells treated with either JNJ compound A or A-922500. Both JNJ compound A and A-922500 increased the level of two [13C18]oleoyl-incorporated dioleins in a concentration-dependent fashion (Fig. 6). The EC50 values calculated from the increase over the vehicle control were approximately 25 nM and 10 nM for JNJ compound A and A-922500, respectively. Interestingly, the EC50 values were close to the IC50 values determined from the inhibition of [13C18]oleoyl-incorporated triolein (Fig. 5), suggesting that JNJ compound A and A-922500 inhibit TG synthesis at the DGAT1 enzyme step. Surprisingly, the maximum fold increase in two [13C18]oleoyl-incorporated dioleins only reached 1.7. It is likely that [13C18]oleoyl-incorporated diolein may be metabolized to other pathways when the conversion of [13C18]oleoyl-incorporated diolein to [13C18]oleoyl-incorporated triolein is blocked in the presence of a DGAT1 inhibitor.
Fig. 6.
Effects of DGAT inhibition on [13C18]oleoyl-incorporated diolein in HEK293 cells by two potent DGAT1-selective inhibitors. The samples described in Fig. 5 were subjected to LC/MS/MS analysis. Values represent the mean of three data points ± SEM.
To confirm that HEK293 cells express DGAT1, we assessed the expression of DGAT1 protein by Western blot. A DGAT1 band corresponding to the size of ∼54 kDa was detected in HEK293 cells. On the other hand, DGAT2 was not detected in these cells (Fig. 7). MCF7 cells were used as a positive control in the Western blot because immunohistochemistry using the same anti-DGAT2 antibody showed that DGAT2 expression was very low in HEK293 cells and high in MCF7 cells (the Swedish Human Proteome Resource, www.proteinatlas.org). Therefore, our results suggest that DGAT1 is the major form of DGAT expressed in HEK293 cells and is most likely responsible for the majority of TG synthesis.
Fig. 7.
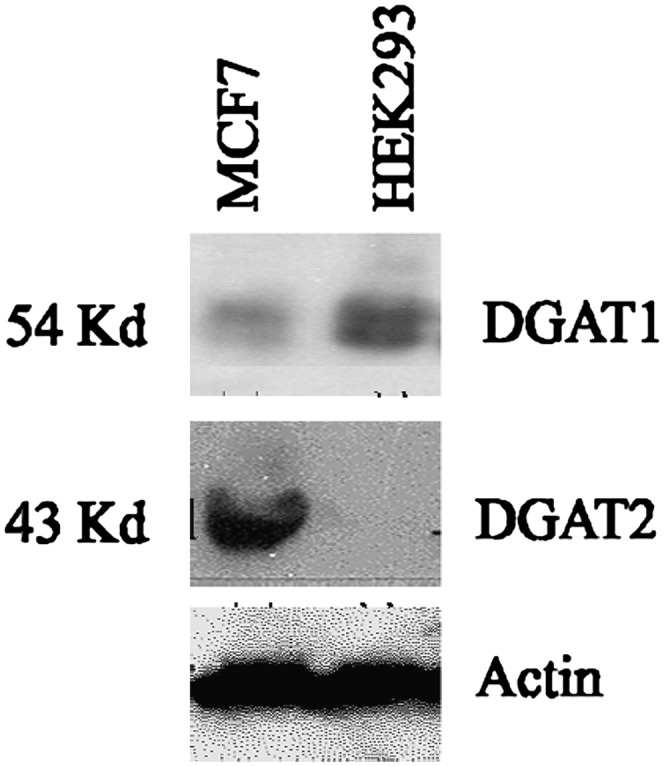
Western blot analysis of DGAT1 and DGAT2 expression in MCF7 and HEK293 cells. Immunoblots of MCF7 and HEK293 cell lysates were probed with antibodies to DGAT1, DGAT2, or actin to show equivalent protein loading.
Analysis of [13C18]oleic acid incorporation into VLDL-TGs in vivo
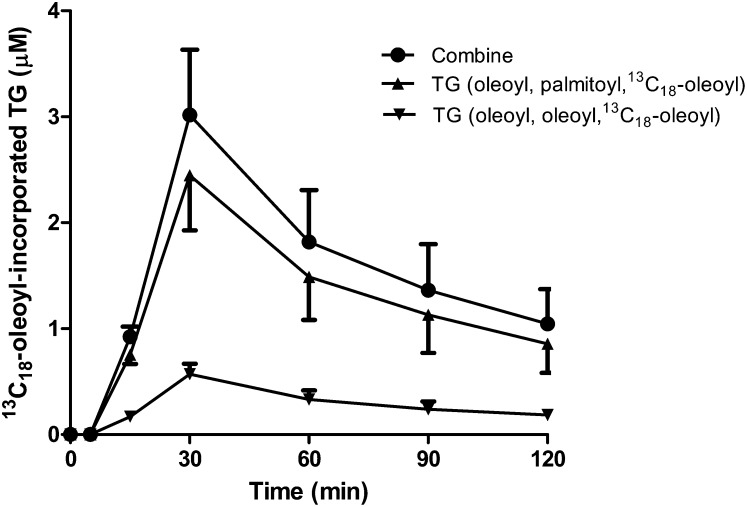
We extended the tracing of TG synthesis in vivo by administering a bolus dose of [13C18]oleic acid to rats and analyzing plasma samples for [13C18]oleoyl incorporation into VLDL-TG by LC/MS/MS analysis. Two major species of [13C18]oleoyl-incorporated TGs were detected after a one-step sample extraction procedure. The two TG species that accounted for greater than 90% of total [13C18]oleoyl-incorporated TGs were TG (palmitoyl, oleoyl, [13C18]oleoyl) and TG (oleoyl, oleoyl, [13C18]oleoyl). Within 15 min after intravenous dosing of [13C18]oleic acid, [13C18]oleoyl was already efficiently incorporated into VLDL-TG. The [13C18]oleoyl-incorporated VLDL-TG peaked at 30 min (Fig. 8). A similar time-dependent curve was observed after bolus intravenous injection of [13C18]oleic acid to conscious rats through the tail vein (data not shown). Stable isotopically labeled palmitate has been used to measure newly synthesized VLDL-TG secretion and turnover in humans (9, 10). In those studies, stable isotope-labeled palmitoyl-incorporated VLDL-TG peaked around 30 min after bolus intravenous injection (9, 10). We also measured the endogenous plasma TG level in the same samples during the experimental time frame. No significant change in the endogenous plasma TG level was detected (data not shown).
Fig. 8.
Time course for the incorporation of [13C18]oleic acid into VLDL-TG in rats. [13C18]oleoyl-incorporated TG. The major [13C18]oleoyl-incorporated TG molecules, TG (palmitoyl, oleoyl, [13C18]oleoyl) and TG (oleoyl, oleoyl, [13C18]oleoyl) were quantified. Data are expressed as mean values ± SEM of three animals.
In addition to plasma, we detected the incorporation of [13C18]oleic acid into TG in the liver during this acute study. Liver and adipose TG levels were measured 1 h after [13C18]oleic acid administration. The percentage of [13C18]oleic acid-incorporated TG was ∼0.2% of the total endogenous hepatic TG pool versus ∼2% in the plasma. However, [13C18]-incorporated TG in the adipose tissue was barely detected at 1 h, due to very high levels of endogenous TG present in this tissue. In addition, most organic compounds distribute to adipose tissue more slowly than to the liver. Therefore, sub-chronic [13C18]oleic acid infusion may be required to trace DGAT activity in tissues such as heart, adipose, and skeletal muscle. Further studies are necessary to evaluate the utility of this assay for studying the distribution of newly synthesized TG with LC/MS/MS. However, it seems feasible, based on these preliminary data, that this assay will also be useful for this purpose.
Inhibition of [13C18]oleic acid incorporation into VLDL-TGs in vivo
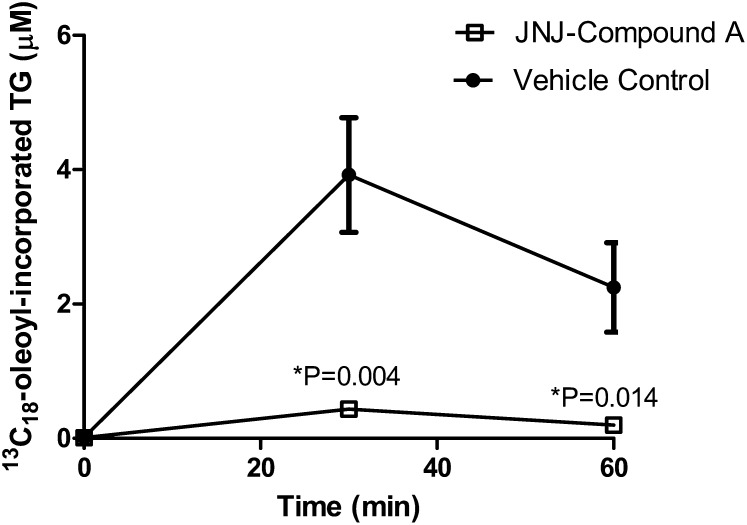
Mammals have two DGAT enzymes, DGAT1 and DGAT2, that are members of distinct gene families (1, 2). Although both are highly expressed in the liver, only DGAT2 is thought to be involved in the bulk of TG synthesis, such that it may be closely linked with the pathways of de novo FA biosynthesis (17, 18). In contrast, cumulative evidence suggests that DGAT1 may be involved in esterifying exogenous FAs taken up by cells or in a recycling pathway that involves the reesterification of hydrolyzed TG (17, 19, 20). To determine whether DGAT1 is directly responsible for the esterification of exogenous oleic acid, we examined the DGAT1-selective inhibitor JNJ compound A in the hepatic synthesis and secretion of [13C18]oleoyl-incorporated VLDL-TG in rats. In fact, subcutaneous injection of JNJ compound A at 3 mg/kg significantly blocked newly synthesized [13C18]oleoyl-incorporated VLDL-TG (Fig. 9). The plasma levels of JNJ compound A were 0.07 ± 0.01 μM and 0.10 ± 0.01 μM at 30 min or 60 min post [13C18]oleoyl acid injection, respectively. These concentrations were higher than the IC50 of JNJ compound A in the cellular assay (Fig. 5A), suggesting that we had indeed reached compound exposure levels high enough to effectively inhibit DGAT1 in vivo. Taken together, our results support the hypothesis that DGAT1 is directly involved in the synthesis of hepatic TG from exogenous FA.
Fig. 9.
In vivo inhibition of [13C18]oleoyl incorporation into TG following administration of a DGAT1 inhibitor. Vehicle or JNJ compound A (3 mg/kg) was dosed subcutaneously 30 min prior to [13C18]oleic acid injection (10 mg/kg, intravenously) in rats. Plasma was sampled at the indicated times following [13C18]oleic acid injection to analyze for the incorporation of [13C18]oleic acid into TG. Each group contained five animals. Data are expressed as mean values ± SEM.
In conclusion, we have developed a novel, high-content assay for the evaluation of cellular and hepatic DGAT activity without the use of radioactive precursors. Our results provide additional evidence to support the functional role of DGAT1 in cellular and hepatic TG synthesis pathways. These methods will be valuable tools for high-throughput screening efforts to discover DGAT inhibitors as well as to interrogate the effects of DGAT1 inhibitors in vitro and in vivo.
Acknowledgments
The authors thank Keith Demarest, John Geisler, and Jim Lenhard for helpful discussion.
Footnotes
Abbreviations:
- apoB
- apolipoprotein B
- DAG
- diacylglycerol
- DGAT
- diacylglycerol acyltransferase
- FAF-BSA
- FA-free BSA
- MTP
- microsomal triglyceride transfer protein
- SCD-1
- steroyl-CoA desaturase 1
- TG
- triglyceride
REFERENCES
- 1.Cases S., Smith S. J., Zheng Y. W., Myers H. M., Lear S. R., Sande E., Novak S., Collins C., Welch C. B., Lusis A. J., et al. 1998. Identification of a gene encoding an acyl CoA:diacylglycerol acyltransferase, a key enzyme in triacylglycerol synthesis. Proc. Natl. Acad. Sci. USA. 95: 13018–13023. [DOI] [PMC free article] [PubMed] [Google Scholar]
- 2.Cases S., Stone S. J., Zhou P., Yen E., Tow B., Lardizabal K. D., Voelker T., Farese R. W., Jr 2001. Cloning of DGAT2, a second mammalian diacylglycerol acyltransferase, and related family members. J. Biol. Chem. 276: 38870–38876. [DOI] [PubMed] [Google Scholar]
- 3.Smith S. J., Cases S., Jensen D. R., Chen H. C., Sande E., Tow B., Sanan D. A., Raber J., Eckel R. H., Farese R. W., Jr 2000. Obesity resistance and multiple mechanisms of triglyceride synthesis in mice lacking Dgat. Nat. Genet. 25: 87–90. [DOI] [PubMed] [Google Scholar]
- 4.Stone S. J., Myers H. M., Watkins S. M., Brown B. E., Feingold K. R., Elias P. M., Farese R. W., Jr 2004. Lipopenia and skin barrier abnormalities in DGAT2-deficient mice. J. Biol. Chem. 279: 11767–11776. [DOI] [PubMed] [Google Scholar]
- 5.Choi C. S., Savage D. B., Kulkarni A., Yu X. X., Liu Z. X., Morino K., Kim S., Distefano A., Samuel V. T., Neschen S., et al. 2007. Suppression of diacylglycerol acyltransferase-2 (DGAT2), but not DGAT1, with antisense oligonucleotides reverses diet-induced hepatic steatosis and insulin resistance. J. Biol. Chem. 282: 22678–22688. [DOI] [PubMed] [Google Scholar]
- 6.Yu X. X., Murray S. F., Pandey S. K., Booten S. L., Bao D., Song X. Z., Kelly S., Chen S., McKay R., Monia B. P., et al. 2005. Antisense oligonucleotide reduction of DGAT2 expression improves hepatic steatosis and hyperlipidemia in obese mice. Hepatology. 42: 362–371. [DOI] [PubMed] [Google Scholar]
- 7.Bruce J. S., Salter A. M. 1996. Metabolic fate of oleic acid, palmitic acid and stearic acid in cultured hamster hepatocytes. Biochem. J. 316: 847–852. [DOI] [PMC free article] [PubMed] [Google Scholar]
- 8.Cheng D., Iqbal J., Devenny J., Chu C. H., Chen L., Dong J., Seethala R., Keim W. J., Azzara A. V., Lawrence R. M., et al. 2008. Acylation of acylglycerols by acyl coenzyme A:diacylglycerol acyltransferase 1 (DGAT1). Functional importance of DGAT1 in the intestinal fat absorption. J. Biol. Chem. 283: 29802–29811. [DOI] [PMC free article] [PubMed] [Google Scholar]
- 9.Patterson B. W., Mittendorfer B., Elias N., Satyanarayana R., Klein S. 2002. Use of stable isotopically labeled tracers to measure very low density lipoprotein-triglyceride turnover. J. Lipid Res. 43: 223–233. [PubMed] [Google Scholar]
- 10.Magkos F., Patterson B. W., Mittendorfer B. 2007. Reproducibility of stable isotope-labeled tracer measures of VLDL-triglyceride and VLDL-apolipoprotein B-100 kinetics. J. Lipid Res. 48: 1204–1211. [DOI] [PubMed] [Google Scholar]
- 11.Wetterau J. R., Zilversmitt D. B. 1986. Localization of intracellular triacylglycerol and cholesteryl ester transfer activity in rat tissues. Biochim. Biophys. Acta. 875: 610–617. [DOI] [PubMed] [Google Scholar]
- 12.Ntambi J. M. 1992. Dietary regulation of stearoyl-CoA desaturase 1 gene expression in mouse liver. J. Biol. Chem. 267: 10925–10930. [PubMed] [Google Scholar]
- 13.Listenberger L. L., Han X., Lewis S. E., Cases S., Farese R. V., Jr., Ory D. S., Schaffer J. E. 2003. Triglyceride accumulation protects against fatty acid-induced lipotoxicity. Proc. Natl. Acad. Sci. USA. 100: 3077–3082. [DOI] [PMC free article] [PubMed] [Google Scholar]
- 14.Lee J. Y., Cho H. K., Kwon Y. H. 2010. Palmitate induces insulin resistance without significant intracellular triglyceride accumulation in HepG2 cells. Metabolism. 59: 927–934. [DOI] [PubMed] [Google Scholar]
- 15.Linders J. I. M., Roevens P., Berwaer M., Boeckx S., Bongartz J-P., Bonghys H., Buyck C., Coesemans E., Davidenko P. V., Gilissen R., et al. 2009 Discovery, synthesis, and in vivo activity of phenylpiperazine DGAT1 inhibitors for the treatment of metabolic syndrome. (Abstract in 238th ACS National Meeting Washington, DC, 2009). [Google Scholar]
- 16.Zhao G., Souers A. J., Voorbach M., Falls H. D., Droz B., Brodjian S., Lau Y. Y., Iyengar R. R., Gao J., Judd A. S., et al. 2008. Validation of diacyl glycerolacyltransferase I as a novel target for the treatment of obesity and dyslipidemia using a potent and selective small molecule inhibitor. J. Med. Chem. 51: 380–383. [DOI] [PubMed] [Google Scholar]
- 17.Man W. C., Miyazaki M., Chu K., Ntambi J. 2006. Colocalization of SCD1 and DGAT2: implying preference for endogenous monounsaturated fatty acids in triglyceride synthesis. J. Lipid Res. 47: 1928–1939. [DOI] [PubMed] [Google Scholar]
- 18.Yen C. L., Stone S. J., Koliwad S., Harris C., Farese R. V., Jr 2008. Thematic review series: glycerolipids. DGAT enzymes and triacylglycerol biosynthesis. J. Lipid Res. 49: 2283–2301. [DOI] [PMC free article] [PubMed] [Google Scholar]
- 19.Villanueva C. J., Monetti M., Shih M., Zhou P., Watkins S. M., Bhanot S., Farese R. V., Jr 2009. Specific role for acyl CoA:diacylglycerol acyltransferase 1 (Dgat1) in hepatic steatosis due to exogenous fatty acids. Hepatology. 50: 434–442. [DOI] [PMC free article] [PubMed] [Google Scholar]
- 20.Yamazaki T., Sasaki E., Kakinuma C., Yano T., Miura S., Ezaki O. 2005. Increased very low density lipoprotein secretion and gonadal fat mass in mice overexpressing liver DGAT1. J. Biol. Chem. 280: 21506–21514. [DOI] [PubMed] [Google Scholar]


