Abstract
Aim
To discover putative oncogenes in head and neck squamous cell carcinoma (HNSCC) by integrating data from whole-genome comparison of array-based comparative genomic hybridization (CGH) and expression microarray analysis of HNSCC.
Methods
We integrated published data defining regions of loss/gain identified from the profiling of 21 HNSCC using high-resolution (<1 Mb) CGH arrays and data from an mRNA expression microarray (approx. 12,000 genes) comparing 6 normal tissues and 8 HNSCC tumor tissues. Eukaryotic translation initiation factor 2C subunit 2 (EIF2C2) was found to be the most significantly overexpressed gene by mRNA expression array, and corresponded to the most common region of amplification found by the CGH array described by Sparano et al. We validated EIF2C2 overexpression in primary tissue, overexpression and amplification in HNSCC lines (JHU-011, JHU-012, FADU) relative to a minimally transformed oral keratinocyte cell line (OKF6) and performed knockdown experiments.
Results
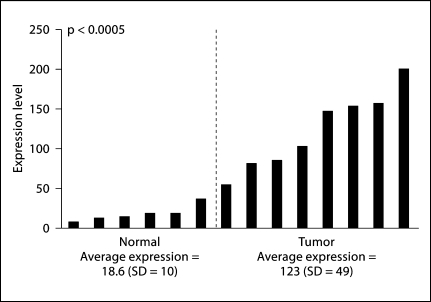
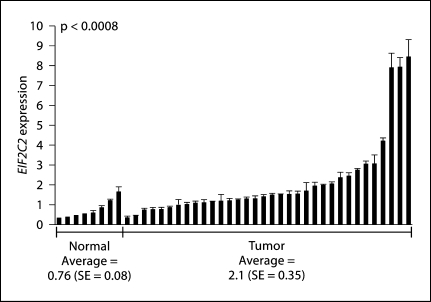
The tumor tissues had an average mRNA expression level of 123 (SD = 49) compared to the normal tissues (18.6, SD = 10) (p = 0.0005) by expression array. Quantitative RT-PCR validation of our expression arrays found that normal tissues had an average expression of 0.76 (SE = 0.08) and tumor tissues of 2.1 (SE = 0.35) (p = 0.0008). EIF2C2 was found to be amplified and overexpressed in 3 HNSCC cell lines. Knockdown of EIF2C2 in cell lines (JHU-012 and JHU-011) inhibited proliferation.
Conclusion
EIF2C2 is amplified and overexpressed in HNSCC cell lines and primary tumors and functionally significant in cell lines.
Key Words: Head and neck squamous cell carcinoma, EIF2C2
Introduction
It was estimated that 35,720 men and women (25,240 men and 10,480 women) would be diagnosed with and 7,600 men and women would die of cancer of the oral cavity and pharynx in 2009 [1,2,3].
In head and neck squamous cell carcinoma (HNSCC), it is well known that regions of DNA amplifications, deletions and mutations play a role in carcinogenesis. It is believed that regions of amplification contain oncogenes and that the increase in their copy number likely correlates with overexpression of the oncogenes. A major limitation of early cytogenetic studies was that only microscopic regions and later macroscopic regions of loss or gain could be detected. Recent advances in microarray and cytogenetic technology have allowed for the analysis of the cancer genome with improved resolution. Specifically, using the array-based comparative genomic hybridization (aCGH) technology, regions of loss/gain as small as <1 Mb can be detected throughout the entire genome simultaneously. A recent report by Sparano et al. [4] analyzed 21 oral squamous cell carcinomas using this new aCGH and discovered several novel regions of loss/gain. They reported that region 8q24.23–8q24.3 was the most common region of amplification in their cohort (62% of tumors) [4].
We hypothesized that areas of high-frequency amplification contain putative oncogenes. In a separate tumor cohort, we performed an mRNA expression array analysis of 8 HNSCC tumors and 6 normal tissues. Using an integrative method for gene discovery, the top gene of this array study was eukaryotic translation initiation factor 2C subunit 2 (EIF2C2, Omim 606229), located within the region 8q24.23–8q24.3.
EIF2C2 encodes a protein that is a member of the Argonaute family of proteins. These proteins are known to play a role in RNA interference. MicroRNA are non-coding RNA molecules that were found to regulate gene expression post-transcriptionally. The encoded protein is a component of the RNA-induced silencing complex (RISC), a key factor in the microRNA, siRNA and RNAi processing pathway [5]. In summary, microRNA are transcribed from DNA into pre-microRNA, these molecules are then processed by Drosha in the nucleus and exported out of the nucleus by Exportin 5. Once exported from the nucleus, the microRNA are further processed by Dicer which produces the mature single-stranded form. Lastly, this mature microRNA associates with RISC and then binds to its target mRNA and inhibits translation by degradation of target mRNA and/or blockage of translation. EIF2C2 provides the endonuclease activity (also called ‘slicer’) to RISC by cleaving microRNA/mRNA heteroduplexes bound to RISC [5,6]. There have been many studies implicating the role of microRNA in many malignancies by either overexpression or underexpression [7].
To validate the results of our integrative discovery approach, we performed functional studies using EIF2C2 in cell lines. After validating overexpression of EIF2C2 by RT-PCR in a separate cohort of HNSCC tumors, we demonstrated that EIF2C2 can modulate cellular proliferation using siRNA knockout experiments. Since EIF2C2 normally functions in the pathway of microRNA, it is possible that alterations in microRNA processing components may contribute toward a malignant phenotype.
Methods
Human Tissue Samples
All human HNSCC tissue samples and normal mucosal tissues were obtained and used according to the policies of the JHMI institutional review board. Tissues were snap frozen in liquid nitrogen immediately after collection. Microdissection of frozen tissue was performed to assure that more than 75% of tissue contained HNSCC. Microdissection was performed by a Johns Hopkins Hospital head and neck pathologist. Eight samples of HNSCC and 6 samples of normal oral epithelial tissue were used for the mRNA expression array (online suppl. table 1, www.karger.com/doi/10.1159/000320597). A separate cohort of 34 microdissected HNSCC tumors and 8 normal oral epithelial tissues was used for the validation studies. All normal tissues were derived from patients who underwent uvulopalatopharyngoplasty for obstructive sleep apnea.
DNA and RNA Extraction
Total RNA extraction from human tissue samples and cell lines was performed using Trizol reagent (Invitrogen, Carlsbad, Calif., USA). Methods used were as described by Chomczynski [8] and Chomczynski and Sacchi [9].
mRNA Expression Array and Significance Analysis of Microarray
RNA was analyzed by human genome Affymetrix U133 1.0 mRNA expression array chip (Affymetrix, Santa Clara, Calif., USA) which examines the expression of 12,000 genes simultaneously. A logarithmic transformation was then performed using the Snomad software. Final values for each sample, expressed as a Z score, were analyzed for significance using significance analysis of microarray (SAM). SAM was applied to expression array results that examined the 8 samples of primary HNSCC and 6 samples of normal control oral epithelial tissue. For SAM, a q value or false discovery rate was set at 0% to determine significantly differently expressed genes.
Quantitative PCR and RT-PCR of Tissues and Cell Lines
The PCR primers for quantitation of DNA used were as follows: left primer 3′-CTGCACAACACAGCCAGTCT-5′ and right primer 3′-CCTTGTTCGTCTTGAGCTCC-5′. The RT-PCR primer sequences used to create cDNA were: left primer 3′-GGAACATGACAGTGCTGAAGG-5′ and right primer 3′-AGTGGGATTCACGAGACCAG-5′. The DNA or cDNA was run in an Applied Biosystems Taqman 7900HT for quantitative RT-PCR in triplicate under standard conditions. Copy number of EIF2C2 in human tissue and cell lines were determined by normalizing to GAPDH and BETA-ACTIN. Increased copy number or gene amplification was defined as any statistically significant increase in copy number of EIF2C2 relative to the control genes BETA-ACTIN or GAPDH. Expression level of EIF2C2 was normalized to BETA-ACTIN expression. Statistical significance of the tissue cohort was determined using 2-tailed Student's t test assuming unequal variance. Statistical significance of the cell line results was determined using the Mann-Whitney U test. Quantitative PCR and RT-PCR of tissues were performed on the same tissue cohort.
siRNA Transfection
EIF2C2 siRNA and scrambled controls were purchased from Ambion, Inc. (Austin, Tex., USA). Catalog numbers are: 19612 (siRNA1), 133832 (siRNA2), and 133831 (siRNA3). Negative controls were also purchased from Ambion, catalog number AM4635, and are RNA sequences that have been tested to assure limited sequence similarity to known genes. The concentrations of reagents for a 6-well plate were as follows: 100 pmol of the mimic, inhibitor or control were used in a volume of 500 μl serum-free media with 5 μl of Lipofectamine 2000 reagent. For the pooled transfections, the total amount of each siRNA equaled 100 pmol such that for single and pooled transfections the total amount of siRNA was equal. Cells were transfected using Invitrogen Lipofectamine 2000 reagent (Carlsbad, Calif., USA) 24 h after plating. Transfection complexes were prepared according to the manufacturer's instructions and added directly to the cells. The transfection medium was replaced 24 h after transfection with normal growth media. Identical concentrations of reagents, cellular confluency and cell growth conditions were used for the control experiments. Quantitative RT-PCR was used to confirm knockdown of EIF2C2 expression after transfection. The RNA was harvested 36 h after transfection of pooled siRNA. Each experiment was performed independently at least 3 times and in triplicate. Representative data are shown in the figures.
Cell Proliferation Assay
Cells were plated at a confluency of 50% per well of a 12-well plate. Growth was assayed at 24, 48, and 72 h by ATCC MTT cell proliferation assay (Manassas, Va., USA) after transfection. The standard manufacturer protocol was followed. Absorbance readings were determined by a fluorescence plate reader at 570 and 650 nm wavelengths. All samples were run in triplicate and replicated at least 3 times. Average readings were reported with standard error. The plate reader used was a SpectraMax M2e Microplate reader purchased from Molecular Devices (Sunnyvale, Calif., USA).
Cell Lines and Culturing Conditions
Cell lines were developed from primary HNSCC in the Division of Head and Neck Cancer Research at the Johns Hopkins University (Baltimore, Md., USA). Cell lines were derived from the following sites: larynx (JHU-O11), neck node metastasis (JHU-012) and pharynx (FaDu). Normal OKF6 cell lines (oral keratinocyte cells that were immortalized with hTert) are a minimally transformed oral keratinocyte line donated by Dr. James Rheinwald, Department of Dermatology, Brigham and Women's Hospital and Harvard Skin Disease Research Center. The donated cell line was OKF6-tert1, but within the text this is abbreviated as OKF6. The head and neck cancer cell lines were cultured in RPMI-1640 media supplemented with 10% FBS and 1% penicillin-streptomycin, while the OKF6 cells were grown in keratinocyte serum-free medium (Gibco) supplemented with bovine pituitary extract (25 μg/ml), calcium chloride (0.4 mM), epidermal growth factor (0.2 ng/ml), and 1% penicillin-streptomycin and filtered through a 0.2-μm pore size sterilization filter. All media components were obtained from Gibco Invitrogen Corporation (Carlsbad, Calif., USA). Cell growth conditions were maintained at 37°C in an atmosphere of 5% carbon dioxide and 95% relative humidity.
Results
EIF2C2 Is Both Overexpressed and Amplified in HNSCC
In our search for novel oncogenes and tumor suppressor genes important in HNSCC we re-examined a cohort of 8 primary HNSCC and 6 normal tissues that was previously analyzed by mRNA expression array in our lab [10]. Using SAM we found 334 statistically significant differentially expressed genes. Our statistically most significant differentially expressed gene was EIF2C2, which was overexpressed in our tumors. The average expression in normal tissues was 18.6 (SD = 10) compared to an average expression of 123 (SD = 49) (p < 0.0005) in HNSCC by the Mann-Whitney U test (fig. 1). Of interest is that the highest expression in normal tissues is still well below the lowest expression in the tumor sample. We then integrated these findings with previously published reports of amplifications in HNSCC. Sparano et al. [4] reported several regions of amplification using aCGH, but the region most commonly amplified was 8q24.23–8q24.3 (62% of tumors). Genes that were located in this region include: LOC51059, COL22A1, KCNK9, T1, C8ORF17, CHRAC1, EIF2C2, PTK2, GPR20, PTP4A3, FLJ31164, BAI1 and ARC. The common gene was EIF2C2.
Fig. 1.
EIF2C2 is overexpressed in tumors. Shown are expression data from mRNA microarray analysis of 6 normal tissues (left) and 8 primary HNSCC tissues (right). Expression levels are normalized to housekeeping genes: BETA-ACTIN, GAPDH, ISGF-3. Statistical significance was determined by the Mann-Whitney U test.
EIF2C2 Expression in HNSCC and Cell Lines
To validate the results of our previously reported expression array data, we performed quantitative RT-PCR analysis of 34 tumor tissue samples and 8 normal tissue samples. The average expression of the normal tissue samples was 0.76 (SE = 0.08), which is significantly less than the tumor tissue sample expression which was 2.1 (SE = 0.35) (p < 0.0008, Mann-Whitney U test) (fig. 2). We also attempted to validate the CGH array results of the Sparano paper; though we saw a trend towards a significant difference in copy number between normal and tumor tissue, it was not statistically significant (online suppl. fig. 1 and 2). The results were confirmed in triplicate. In addition to validating the expression results in tissues, we also examined EIF2C2 copy number and expression in cell lines using quantitative PCR and quantitative RT-PCR, respectively. We found that EIF2C2 expression was greater than that of the control cell line (OKF6) in all 3 cell lines, with JHU-011 having the greatest expression (fig. 3a). In addition, JHU-011 and JHU-012 demonstrated copy numbers greater than OKF6 (fig. 3b).
Fig. 2.
Validation of EIF2C2 overexpression in HNSCC tumor tissues (quantitative RT-PCR). Statistical significance was determined by the Mann-Whitney U test. Error bars correspond to the standard error of the average expression of each sample run in triplicate. EIF2C2 expression level is normalized to BETA-ACTIN expression.
Fig. 3.
EIF2C2 is overexpressed and amplified in HNSCC cell lines. a Quantitative RT-PCR data demonstrating the overexpression of EIF2C2 in HNSCC cell lines compared to OKF6. Expression is normalized to BETA-ACTIN expression. b Quantitative PCR data demonstrating the increased copy number of EIF2C2 in HNSCC cell lines compared to OKF6. Copy number is normalized to BETA-ACTIN. Error bars correspond to the standard deviation of the average of each sample run in triplicate. Ct = Cycle threshold.
siRNA Knockdown of EIF2C2 Modulates Cellular Proliferation
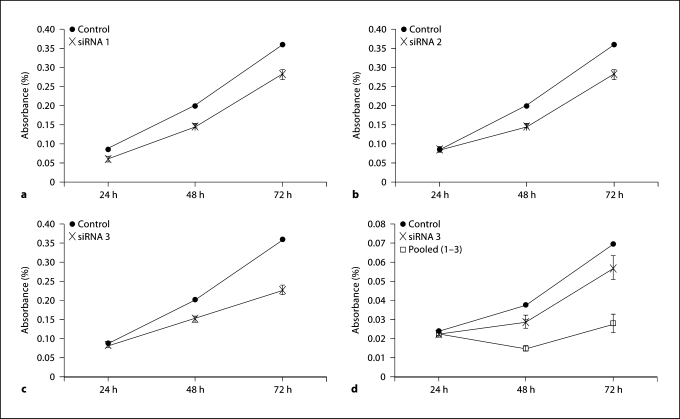
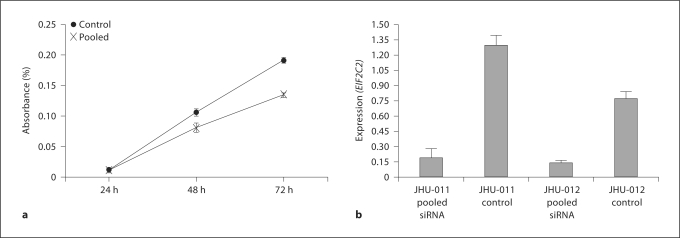
Proliferation assays were performed to demonstrate the functional significance of EIF2C2. Three siRNA, which target different regions of the EIF2C2 mRNA transcript, were chosen to test for their ability to affect cellular proliferation. Each showed a significant decrease in cellular proliferation starting as early as 48 h after transfection, with siRNA 3 having the greatest effect (37.1% reduction) (fig. 4a–c). However, the greatest effect was noted after a pooled transfection of all 3 siRNA (54.4% reduction) (fig. 4d). This same growth effect was seen when a pooled transfection was performed in the JHU-012 cell line (fig. 5a). Appropriate knockdown of EIF2C2 was confirmed by quantitative RT-PCR (fig. 5b) relative to transfected controls.
Fig. 4.
Knockout of EIF2C2 expression decreases cellular proliferation in JHU-011. a EIF2C2 siRNA 1. b EIF2C2 siRNA 2. c EIF2C2 siRNA 3. d EIF2C2 siRNA 3 and pooled. Controls are transfected scrambled negative controls. Each experiment was run in triplicate and repeated independently at least 3 times. Graphs shown are representative.
Fig. 5.
Knockout of EIF2C2 expression decreases cellular proliferation in JHU-012 and expression of EIF2C2 after pooled siRNA transfection. a Pooled transfection of EIF2C2 siRNA decreases cellular proliferation relative to transfected scrambled controls. Each experiment was run in triplicate and repeated independently at least 3 times. Graphs shown are representative. b Quantitative RT-PCR data showing decreased expression of EIF2C2 after pooled siRNA transfection. Expression level is normalized to BETA-ACTIN expression. Error bars correspond to the standard deviation of the average of each sample run in triplicate.
Conclusions
In summary, using an integrative approach, we were able to identify a novel candidate oncogene that is both amplified and overexpressed in HNSCC tumors as well as functionally significant in cell lines. The most exciting implication of this study is that it suggests a possible mechanism by which microRNA dysregulation may lead to carcinogenesis. MicroRNA are well known to be deregulated in cancer, but there is little known about why these expression differences occur.
With the discovery of microRNA molecules in Caenorhabditis elegans in 1993, a novel method of gene expression regulation was revealed [11]. Once microRNA were discovered in the human genome, significant interest in their role in human disease was generated. MicroRNA are small non-coding RNA molecules (approx. 22 nucleotides) that regulate post-transcriptional gene expression [12] by relatively non-specific binding to the 3′-untranslated region of mRNA, such that a single microRNA may regulate the expression of several genes. It has been proposed that over one third of all protein-coding genes [13] are under translational control by microRNA. MicroRNA are involved in a variety of cellular processes, including the regulation of cellular differentiation, proliferation and apoptosis that play a role in cancer development [14]. Several previous studies have established that increased or decreased microRNA expression plays a critical role in carcinogenesis and cancer biology [7]. Other studies have demonstrated that there is a unique microRNA signature for certain cancer types [7]. Our lab has previously demonstrated that there are differences in the expression of microRNA between normal and HNSCC tumor tissues [10]. Though there has been a lot of interest in studying the expression differences of microRNA between normal and abnormal tissue, there has been very little published regarding the etiology of these expression differences.
All microRNA are transcribed from DNA into pre-microRNA, these molecules are then processed by Drosha in the nucleus and exported out of the nucleus by Exportin 5. Once exported from the nucleus, the microRNA are further processed by Dicer which produces the mature single-stranded form. Lastly, this mature microRNA associates with RISC and then binds to its target mRNA and inhibits translation by degradation of target mRNA and/or blockage of translation. A study by Zhang et al. [15] proposed that expression differences may be due to amplification of microRNA DNA as well as amplification of EIF2C2. Our study supports their hypothesis that the amplification and overexpression of microRNA processing machinery is important in carcinogenesis. Moreover, our study supports their finding that dysfunctional microRNA processing may contribute to microRNA expression differences in HNSCC.
The interaction between global miRNA and EIF2C2 amplification in the development of malignancy may be complex. It is possible that the increased amount of EIF2C2, which is at the very center of RISC activity [5], selectively protects microRNA from being degraded and thus can further inhibit a tumor suppressor gene by increasing the potency of a microRNA. It is possible that specific microRNA are more sensitive to differential EIF2C2 expression or that certain microRNA are more dose dependent than others and that small perturbations in their concentrations may have large effects. It is also possible that EIF2C2 overexpression results in additional phenotypic alterations other than increased growth, as we did not assay for other characteristics in this study. Clearly, additional study of the downstream effects of EIF2C2 overexpression on mRNA and microRNA stability is required to understand the mechanism of EIF2C2-induced proliferation.
One worrying finding of the study was that we were unable to confirm the copy number increase of EIF2C2 in our tissue cohort. We repeated the experiment in triplicate, but still could not confirm their finding. There was a small variability in the results when we normalized to BETA-ACTIN versus GAPDH, but despite this variability, there was no statistical significance. In an attempt to overcome this variability, we attempted to normalize copy number to both genes, but still did not achieve statistical significance. This could reflect the inherent variability between approaches used to assess copy number, i.e. aCGH versus PCR-based techniques.
Supplementary Material
Supplemental Material
Acknowledgements
This work was supported by SPORE (5P50CA096784-05) (Dr. J.A. Califano) and NIH T32DC000027 (I. Smith, C. Glazer, P. Hennessey, and S. Chang).
References
- 1.Horner MJ, Ries LAG, Krapcho M, Neyman N, Aminou R, Howlader N, Altekruse SF, Feuer EJ, Huang L, Mariotto A, Miller BA, Lewis DR, Eisner MP, Stinchcomb DG, Edwards BK. SEER Cancer Statistics Review, 1975–2006. Bethesda: National Cancer Institute; 2009. [Google Scholar]
- 2.Jemal A, Thomas A, Murray T, Thun M. Cancer statistics, 2002. CA Cancer J Clin. 2002;52:23–47. doi: 10.3322/canjclin.52.1.23. [DOI] [PubMed] [Google Scholar]
- 3.Carvalho AL, Nishimoto IN, Califano JA, Kowalski LP. Trends in incidence and prognosis for head and neck cancer in the United States: a site-specific analysis of the SEER database. Int J Cancer. 2005;114:806–816. doi: 10.1002/ijc.20740. [DOI] [PubMed] [Google Scholar]
- 4.Sparano A, Quesnelle KM, Kumar MS, Wang Y, Sylvester AJ, Feldman M, Sewell DA, Weinstein GS, Brose MS. Genome-wide profiling of oral squamous cell carcinoma by array-based comparative genomic hybridization. Laryngoscope. 2006;116:735–741. doi: 10.1097/01.mlg.0000205141.54471.7f. [DOI] [PubMed] [Google Scholar]
- 5.Liu J, Carmell MA, Rivas FV, Marsden CG, Thomson JM, Song JJ, Hammond SM, Joshua-Tor L, Hannon GJ. Argonaute2 is the catalytic engine of mammalian RNAi. Science. 2004;305:1437–1441. doi: 10.1126/science.1102513. [DOI] [PubMed] [Google Scholar]
- 6.O'Carroll D, Mecklenbrauker I, Das PP, Santana A, Koenig U, Enright AJ, Miska EA, Tarakhovsky A. A Slicer-independent role for Argonaute 2 in hematopoiesis and the microRNA pathway. Genes Dev. 2007;21:1999–2004. doi: 10.1101/gad.1565607. [DOI] [PMC free article] [PubMed] [Google Scholar]
- 7.Calin GA, Croce CM. MicroRNA signatures in human cancers. Nat Rev Cancer. 2006;6:857–866. doi: 10.1038/nrc1997. [DOI] [PubMed] [Google Scholar]
- 8.Chomczynski P. A reagent for the single-step simultaneous isolation of RNA, DNA and proteins from cell and tissue samples. Biotechniques. 1993;15:532–534. 536–537. [PubMed] [Google Scholar]
- 9.Chomczynski P, Sacchi N. Single-step method of RNA isolation by acid guanidinium thiocyanate-phenol-chloroform extraction. Anal Biochem. 1987;162:156–159. doi: 10.1006/abio.1987.9999. [DOI] [PubMed] [Google Scholar]
- 10.Smith IM, S. KM, Liu C, Chang SS, Begum S, Dhara M, Westra W, Sidransky D, Califano JA: Integrative genomic approach to discovery of genes associated with HNSCC development. Arch Otolaryngol, in press. [DOI] [PubMed]
- 11.Lee RC, Feinbaum RL, Ambros V. The C. elegans heterochronic gene lin-4 encodes small RNAs with antisense complementarity to lin-14. Cell. 1993;75:843–854. doi: 10.1016/0092-8674(93)90529-y. [DOI] [PubMed] [Google Scholar]
- 12.Scaria V, Hariharan M, Pillai B, Maiti S, Brahmachari SK. Host-virus genome interactions: macro roles for microRNAs. Cell Microbiol. 2007;9:2784–2794. doi: 10.1111/j.1462-5822.2007.01050.x. [DOI] [PubMed] [Google Scholar]
- 13.Lewis BP, Burge CB, Bartel DP. Conserved seed pairing, often flanked by adenosines, indicates that thousands of human genes are microRNA targets. Cell. 2005;120:15–20. doi: 10.1016/j.cell.2004.12.035. [DOI] [PubMed] [Google Scholar]
- 14.Croce CM, Calin GA. miRNAs, cancer, and stem cell division. Cell. 2005;122:6–7. doi: 10.1016/j.cell.2005.06.036. [DOI] [PubMed] [Google Scholar]
- 15.Zhang L, Huang J, Yang N, Greshock J, Megraw MS, Giannakakis A, Liang S, Naylor TL, Barchetti A, Ward MR, Yao G, Medina A, O'Brien-Jenkins A, Katsaros D, Hatzigeorgiou A, Gimotty PA, Weber BL, Coukos G. microRNAs exhibit high frequency genomic alterations in human cancer. Proc Natl Acad Sci USA. 2006;103:9136–9141. doi: 10.1073/pnas.0508889103. [DOI] [PMC free article] [PubMed] [Google Scholar]
Associated Data
This section collects any data citations, data availability statements, or supplementary materials included in this article.
Supplementary Materials
Supplemental Material


