Abstract
The epithelial sodium channel (ENaC) mediates the fine-tuned regulation of external sodium (Na) balance. The circadian clock protein Period 1 (Per1) is an aldosterone-induced gene that regulates mRNA expression of the rate-limiting alpha subunit of ENaC (αENaC). In the present study, we examined the effect of Per1 on αENaC in the cortex, the site of greatest ENaC activity in the collecting duct, and examined the mechanism of Per1 action on αENaC. Compared to wild type mice, Per1 knockout mice exhibited a 50% reduction of steady state αENaC mRNA levels in the cortex. Importantly, siRNA-mediated knockdown of Per1 decreased total αENaC protein levels in mpkCCDc14 cells, a widely used model of the murine cortical collecting duct (CCD). Per1 regulated basal αENaC expression and participated in the aldosterone-mediated regulation of αENaC in mpkCCDc14 cells. Because circadian clock proteins mediate their effects as part of multi-protein complexes at E-box response elements in the promoters of target genes, the ability of Per1 to interact with these sequences from the αENaC promoter was tested. For the first time, we show that Per1 and Clock are present at an E-box response element found in the αENaC promoter. Together these data support an important role for the circadian clock protein Per1 in the direct regulation of αENaC transcription and have important implications for understanding the role of the circadian clock in the regulation of renal function.
Keywords: circadian rhythm, sodium channel, kidney, cortical collecting duct, E-box
1. Introduction
Rapidly accumulating evidence supports a link between the circadian clock and pathologies such as obesity [1] and hypertension [2]. Many physiological processes such as renal blood flow, body temperature, heart rate, and blood pressure exhibit circadian patterns [3, 4]. The molecular mechanism driving these circadian fluctuations has been the focus of recent investigation. The circadian clock consists of positive and negative feedback loops each of which have distinct effects. In the positive loop, Bmal/Clock heterodimers drive transcription of the Per genes (Per1, Per2 and Per3) and that of the Per binding partners, Cryptochrome (Cry1 and Cry2). In the negative feedback loop, Per/Cry inhibit Bmal/Clock action, thereby repressing their own transcription [3]. In addition to these feedback loops, the core clock proteins regulate output genes that contribute to physiological functions governed by the circadian clock. Studies in Bmal knockout mice suggest that Bmal/Clock can activate or repress transcription of target genes [5, 6]. Since Per1 appears to positively regulate clock targets [7, 8], it is likely that Per/Cry may antagonize Bmal/Clock action in a gene and tissue specific manner.
Circadian clock proteins mediate their transcriptional effects as part of multi-protein complexes present at E-box response elements in the promoters of target genes. Transcriptional profiling studies in a wide range of tissues have revealed that a significant portion of genes are expressed in a circadian fashion [9]. Anea et al. characterized the cardiovascular phenotype of mice lacking functional Bmal1 or Clock [10]. These mice exhibited increased pathological remodeling and vascular injury as well as endothelial dysfunction, underscoring the importance of the circadian clock in the vasculature. Martino et al. showed that heterozygous tau mutant hamsters, lacking the circadian clock regulator casein kinase-1ε, exhibited a cardiorenal phenotype [11]. Early death, cardiomyopathy, extensive fibrosis, and severely impaired contractility were observed in the tau mutant animals. The renal phenotype consisted of proteinuria, tubular dilation, and cellular apoptosis.
Another report emphasized the importance of circadian clock genes in the regulation of fluid and electrolyte balance and blood pressure homeostasis. Zuber et al. recently reported altered expression of aquaporins 2 and 4, the alpha subunit of the epithelial sodium channel (αENaC) and the vasopressin V2 receptor in two different strains of circadian clock mutant mice [12]. In this elegant study, microarray analysis demonstrated circadian rhythmicity in the expression of many genes involved in renal function. Interestingly, Clock knockout mice displayed a mild diabetes insipidus, aberrant Na excretion, and had lower blood pressure than wild-type animals.
ENaC is critical to the reabsorption of Na by the distal nephron and collecting duct and is important in the control of blood pressure. The importance of ENaC to Na homeostasis and blood pressure is underscored by gain of function mutations in ENaC subunits that lead to hypertension in Liddle's Syndrome [13]. Conversely, loss of function mutations in ENaC subunits results in severe hypotension that occurs in Pseudohypoaldosteronism type 1a. ENaC is a heteromeric channel consisting of α, β and γ subunits. ENaC is tightly regulated at the level of transcription, intracellular trafficking and plasma membrane recycling. In the kidney, αENaC is the rate limiting subunit for channel assembly [14, 15]. Recently we showed that the circadian clock protein Per1 regulates αENaC mRNA levels in the kidney [8]. Loss of Per1 resulted in decreased αENaC mRNA levels both in vitro and in vivo. siRNA-mediated knockdown of Per1 led to inhibition of αENaC mRNA expression and these effects occurred in the presence or absence of aldosterone. Moreover, Per1 knockout mice appeared to excrete more urinary Na than wild type mice, indicating a possible role for Per1 in regulating Na excretion.
We first identified Per1 as an early aldosterone target and a regulator of αENaC in a model of the murine inner medullary collecting duct, mIMCD-3 cells [8, 16]. To determine the downstream role of the aldosterone-regulated circadian clock gene Per1 in mediating aldosterone action, the effect of Per1 knockdown on the well known aldosterone target gene αENaC was examined [8]. This report demonstrated that siRNA-mediated knockdown of Per1 resulted in decreased αENaC mRNA expression in mIMCD-3, the outer medullary CD cell line OMCD-1 and the cortical CD cell line, mpkCCDc14. Importantly, these effects were observed in the presence or absence of aldosterone, suggesting that Per1 likely modulated basal αENaC mRNA expression independent of aldosterone. Analysis of heterogeneous RNA (hnRNA) levels in mIMCD-3 cells showed that Per1 knockdown decreased αENaC transcription and overexpression of Per1 led to an increase in αENaC promoter activity. Together these data suggest a direct role for Per1 in the regulation of αENaC mRNA expression but the mechanism of this effect remained to be defined.
The CCD is the site of the most robust ENaC activity in the CD and as such, the regulation of ENaC in this segment is critical to maintaining Na homeostasis (reviewed in [17]). The mpkCCDc14 cell line is a well characterized model of the cortical collecting duct [18] and these cells have been used extensively to study regulation of ENaC as well as aldosterone signaling [19–28]. In the present study, we extended the study of Per1 and αENaC to the cortex and investigated the mechanism by which Per1 regulates αENaC expression. We show for the first time that Per1 knockdown results in decreased αENaC protein levels in mpkCCDc14 cells. Importantly, αENaC appears to be a clock-controlled gene as evidenced by the presence of Per1 and Clock at an E-box response element from the αENaC promoter.
2. Materials and Methods
Animals
Kidneys from Per1 deficient mice and wild type controls (isogenic 129/sv) were the kind gift of Dr. David Weaver (University of Massachusetts Medical School). These animals have been described previously [29].
Cell culture
Dr. Alain Vandewalle provided the mpkCCDc14 cells (INSERM, Paris, France [18]). Cells were maintained in DMEM-F12 plus 10% FBS and 50 μg/ml gentamicin. For aldosterone treatments, 600,000 cells were plated in each well of a 6 well Corning Costar Transwell dish. Twenty-four hours after cells reached 100% confluency, the medium was changed to phenol-red free DMEM-F12 (Invitrogen) plus 10% charcoal-dextran treated FBS to deprive the cells of steroid hormones. An additional 24 hrs later, cells were treated with vehicle (ethanol) or 1 μM aldosterone for varying time intervals. Final ethanol concentration in both vehicle and aldosterone-treated cells was 0.1%.
RNA Silencing
For siRNA experiments, mpkCCDc14 cells were plated at a density of 75,000 cells / cm2 in transwell dishes in DMEM-F12 media containing 10% FBS and 50 μg/ml gentamicin. At the time of transfection, media were changed to DMEM-F12 without phenol red containing 10% charcoal-stripped FBS and no antibiotic. Cells were transfected for 24 hr with siRNA directed against Per1 (SMARTpool® siRNA, Dharmacon) using 2 μM siRNA in 6 μL of Dharmafect Reagent 4. Twenty-four hours after transfection, cells were treated with vehicle or aldosterone for 2, 4 or 6 hr.
RNA isolation and QPCR
Total RNA was isolated using Trizol (Invitrogen) according to the manufacturer's instructions. RNA samples (10 μg) were treated with DNA-free DNaseI (Ambion). DNaseI-treated RNA (2 μg) samples were used as template for reverse transcription with Superscript III (Invitrogen). The resulting cDNAs (20 ng) were then used as templates in duplicate QPCR reactions (Applied Biosystems) to evaluate changes in expression of several transcripts. Cycle threshold (Ct) values were normalized against actin mRNA and relative quantification was performed using the ΔΔCt method [30]. Fold change values were calculated as the change in mRNA expression levels relative to the vehicle treated control. Primer/probe sets were purchased from Applied Biosystems.
Western blot analysis
Total cell lysates were collected in 1× passive lysis buffer (Promega). Concentrations were determined using the BCA (bicinchoninic acid) assay (Pierce). Lysates were separated on a 10–20% Tris-HCl ready gel (BioRad). Proteins were transferred to PVDF membrane. The membrane was blocked in 2% Rodeo™ Blocker in TBS-S (TBS plus 0.05% Rodeo™ Saddle Soap) (USB) and then incubated overnight at 4°C with the anti-Per1 primary antibody (Affinity BioReagents) or anti-αENaC antibody (kind gift of Dr. Carolyn Ecelbarger, Georgetown University) in 2% Rodeo™ Blocker in TBS-S. The horseradish peroxidase conjugated anti-rabbit secondary antibody (USB) incubation was performed in 2% Rodeo™ Blocker in TBS-S for 1 hr at room temperature. Following the primary and secondary antibody incubations, the blot was washed in TBS-S three times for at least ten minutes. Detection was performed using Rodeo™ Sensitive detection reagents (USB).
Analysis of heterogeneous nuclear RNA (hnRNA)
Analysis of the short lived hnRNA can be used as a measure of transcriptional activity [31, 32]. The αENaC hnRNA primer sequences were designed to amplify a 238 bp product spanning exon 6/intron 6 of the Scnn1a gene. The forward primer sequence was: 5'-ggaggcaactacggagactg-3'. The reverse primer sequence was 5'-gagaagcaagaggcttcagg-3'. GAPDH primers were used as a control for aldosterone treatment and were designed to amplify an 874 bp cDNA fragment. The forward primer sequence was 5'-agacacgatggtgaaggtcggagtgaac-3'. The reverse primer sequence was 5'-gtggcactgttgaagtcgcaggag-3'. Total RNA was isolated from vehicle and aldosterone treated cells and DNase I treated as described above. DNase I treated RNA samples were incubated with master mix containing reverse transcription and PCR components for 30 min at 50°C. PCR reactions were performed using 40 ng of cDNA as template and the following cycling paramaters: Reactions were heated to 95°C for 15 min to activate the Taq polymerase. Thirty-five (αENaC) amplification cycles were performed using the following parameters: 95°C for 30 sec, 55°C for 30 sec, 72°C for 1 min followed by a final 10 min extension at 72°C.
Plasmids and Luciferase Assays
mpkCCDc14 cells were transfected with pGL3 (Promega) or an αENaC promoter-luciferase construct (gift of Dr. Christie Thomas, University of Iowa) using lipofectamine (Invitrogen) according to the manufacturer's instructions. Co-transfection was performed with empty vector or a mutant Per1 construct, pCS2-mPer1-K835A,R838A (gift of Dr. David Virshup, Duke University). Transfection efficiency was normalized to Renilla luciferase levels as all cells were co-transfected with identical amounts of the plasmid pRL-TK. Dual luciferase assays (Promega) were performed according to the manufacturer's instructions.
DNA Affinity Purification Assay (DAPA)
DAPA experiments were performed as described previously [20]. Nuclear extracts were isolated from mpkCCDc14 cells using the NePer kit (Pierce) according to the manufacturer's instructions. Single stranded biotinylated probes were ordered from GenoSys. Once annealed, the double stranded DAPA probe was incubated with 175 μg of nuclear extract in the presence of Streptavidin agarose beads (Sigma). The sequences of the DAPA probes were (E-box elements are underlined): E-box 1 5' gcattctgtctacaacagctgctggtccgctttgtg; E-box 2 5' aagttcagagggaaggggatg; E-box 3 5' tggtgggggccagcaggtgcttcccagttt;. E-box 4 5' gccaggcactgcacctgtcaggtgagagggtggag. These putative E-box elements were identified using a combination of TF Search (http://www.cbrc.jp/research/db/TFSEARCH.html) and TESS (http://www.cbil.upenn.edu/cgibin/tess/tess) to analyze the αENaC promoter.
Statistical Analysis
Student's unpaired t-test (Microsoft Excel) was used to compare two data sets. A two-way analysis of variance was used to evaluate the four groups of luciferase data in Figure 5 (Origin 8.0). Data are presented as the mean, ± standard error of the mean (SEM). P values less than 0.05 were considered significant.
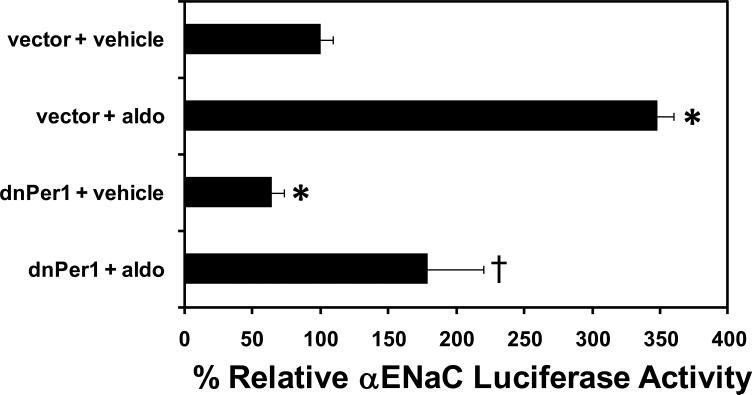
Figure 5. Dominant negative Per1 inhibits αENaC promoter activity.
mpkCCDc14 cells were transfected with pRL renilla luciferase and a plasmid containing the αENaC promoter cloned in front of the firefly luciferase cDNA. Cells were co-transfected with empty vector or dominant negative Per1 (dnPer1) expression vector and then treated with vehicle or 1 μM aldosterone for 24 hr. Data are presented as the mean ± standard error, n=3, *p<0.05 versus αENaC/luc + vector + vehicle; † p<0.05 versus αENaC/luc + vector + aldosterone
3. Results
3.1 αENaC expression is reduced in the renal cortex of Per1-deficient mice
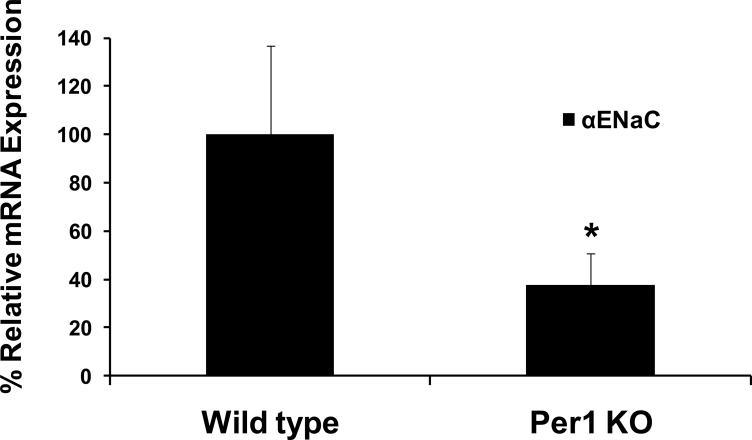
ENaC is the rate-limiting step for Na entry in the collecting duct and ENaC levels are the highest in the cortex. We previously demonstrated that αENaC mRNA levels were reduced in the inner and outer medulla of Per1 knockout mice compared to wild type [8]. To extend the investigation of Per1 and αENaC to the cortex, αENaC mRNA levels were analyzed in the renal cortex of Per1 knockout mice. Figure 1 demonstrates that αENaC steady state mRNA levels were reduced by approximately 50% in the cortex of mice lacking Per1 compared to wild type control mice. Consistent with our previous report of reduced αENaC expression in the medulla of Per1 deficient mice [8], the results clearly indicated a role for Per1 in the regulation of αENaC in the renal cortex in vivo.
Figure 1. αENaC mRNA expression is reduced in the renal cortex of Per1 knockout mice.
Total RNA was isolated from the renal cortex of wild type (129/sv) or Per1 knockout mice. QPCR was used to analyze changes in gene expression of αENaC in Per1 deficient animals. Fold change values were normalized against actin and relative to wild type control mice. Data are presented as the mean ± standard error, n=5 *p<0.05
3.2 Aldosterone treatment induces Per1 expression in mpkCCDc14 cells
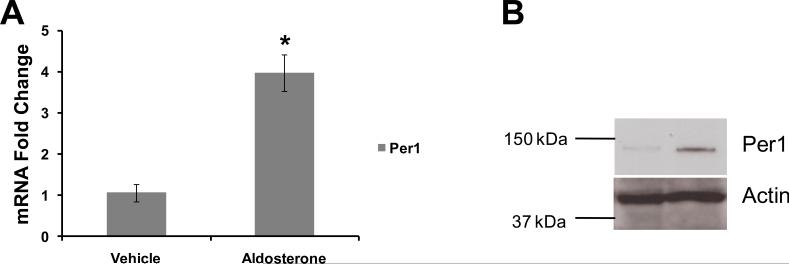
In order to demonstrate that mpkCCDc14 cells [18] were a valid model for studying the action of Per1, it was first necessary to determine if aldosterone induced Per1 expression in this model of the cortical collecting duct. Serum-depleted mpkCCDc14 cells were treated with vehicle (ethanol) or aldosterone for 24 hr. Quantitative real time PCR (QPCR) was used to evaluate Per1 mRNA levels in response to aldosterone treatment. Steady state Per1 mRNA increased approximately four-fold following aldosterone treatment (Figure 2A). Western blot analysis of total cell lysates from mpkCCDc14 cells treated with vehicle or aldosterone for 24 hr was performed (Figure 2B). The increase in Per1 mRNA resulted in a readily observable increase in Per1 protein.
Figure 2. Per1 is induced by aldosterone in mpkCCDc14 cells.
A. mpkCCDc14 cells were treated with vehicle (ethanol) or aldosterone (1 μM) for 24 hr. Quantitative real time RT-PCR (QPCR) was used to measure changes in gene expression. Fold change values were calculated relative to actin and compared to vehicle treated control cells. Data are presented as the mean, ± standard error, n=at least five independent experiments. *p<0.05 versus vehicle. B. mpkCCDc14 cells were treated with vehicle or 1 μM aldosterone for 24 hr. Total cell lysates were collected and analyzed via Western blot using an anti-Per1 antibody (Affinity Bioreagents). An anti-actin antibody (Sigma) was used for a loading control. Data are representative of three independent experiments.
3.3 Per1 knockdown inhibits αENaC protein and mRNA expression in mpkCCDc14 cells
Since the mpkCCDc14 cells appeared to be fully responsive to aldosterone, siRNA-mediated knockdown experiments were performed to assess the effect of Per1 removal on αENaC expression in the presence of aldosterone. To evaluate the effect of Per1 knockdown on αENaC protein levels, mpkCCDc14 cells were transfected with a non-target control siRNA or Per1 specific siRNA (Per1-8), and then exposed to aldosterone for 24 hr. Per1 mRNA expression decreased by 80% ±10 under these conditions. Per1 knockdown resulted in a marked decrease in total αENaC protein (Figure 3A). Densitometry analysis revealed that Per1 knockdown resulted in an approximate 60% reduction in total αENaC protein levels (Figure 3B).
Figure 3. Per1 knockdown inhibits αENaC protein expression.
A. mpkCCDc14 cells were transfected with a non-target control siRNA or a Per1 specific siRNA (Per1–8). Twenty four hours later, cells were treated with 1 μM aldosterone (aldo). Total cell lysates were collected 24 hr later and Western blot analysis was performed using an anti-αENaC antibody (gift of Dr. Carolyn Ecelbarger). An anti-actin antibody (Sigma) was used for a loading control. B. Densitometry analysis (Kodak Imaging) was performed on Western blots to determine the % decrease in αENaC protein following Per1 knockdown. Signal intensities were normalized against actin. *p<0.05 versus Non-target + aldo, n=4 in two independent experiments.
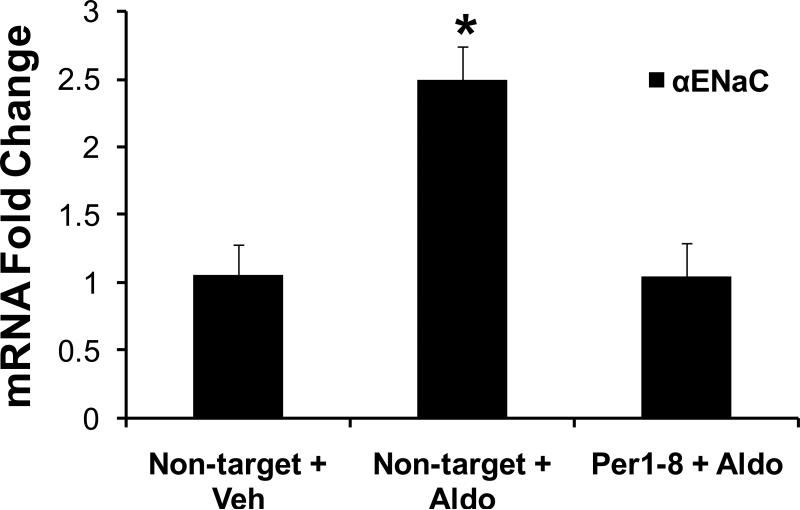
Increases in αENaC mRNA can be seen as early as 4 hr after hormone treatment of mpkCCDc14 cells, reflecting activation of gene transcription. Therefore, it was important to determine whether Per1 knockdown could inhibit the response of αENaC during the early period of the aldosterone response. Expression of αENaC was evaluated following 4 hr of aldosterone treatment in serum-depleted mpkCCDc14 cells transfected with a non-target or Per1-8 siRNA (Figure 4). A significant increase in αENaC mRNA was observed in control cells following 4 hr of hormone treatment. However, Per1 knockdown effectively blocked the early increase in αENaC expression in response to aldosterone. Therefore, the aldosterone-dependent effect of Per1 on αENaC gene expression occurred early in the hormone response, suggesting a direct role for Per1 in the regulation of αENaC expression in this model of the CCD.
Figure 4. Per1 knockdown inhibits αENaC expression early in the aldosterone response in mpkCCDc14 Cells.
mpkCCDc14 cells were transfected with a non-target siRNA or Per1–8 siRNA for 24 hr and then treated with vehicle (veh) or 1 μM aldosterone (aldo) for 4 hr. QPCR was used to analyze changes in gene expression of αENaC following Per1 knockdown in the presence of aldosterone compared to non-target siRNA transfected control samples. Fold change values were normalized against actin relative to the non-target siRNA-transfected, vehicle-treated control. Data are presented as the mean ± standard error, n=3. *p<0.05
3.4 Per1 knockdown decreases αENaC transcription
Loss of Per1 led to decreased αENaC mRNA expression in vivo and ENaC mRNA and protein in vitro. To determine the mechanism of this regulation, αENaC promoter activity was evaluated in the presence of a dominant negative Per1 (dnPer1). The dnPer1 construct contains a mutated nuclear localization signal (NLS) (Per1 K835E, R838D) and the protein product cannot enter the nucleus [33]. In addition to a functional NLS, Per1 requires interaction with its binding partner Cry to enter the nucleus. Over-expression of the dnPer1 presumably inhibits endogenous Per1 activity by binding and sequestering Cry in the cytoplasm, thus blocking endogenous Per1 from entering the nucleus with its binding partner. The dnPer1 was cotransfected into mpkCCDc14 cells with the αENaC promoter luciferase vector in the presence of vehicle or aldosterone (Figure 5). In vehicle treated cells, αENaC promoter activity decreased dramatically in the presence of dnPer1 compared to cells transfected with an empty control vector. Likewise, the presence of dnPer1 inhibited the effect of aldosterone on αENaC promoter luciferase activity by approximately 50%. Two-way ANOVA analysis of the data gave a statistically significant interaction term (p<0.05) for the effects of Per1 and aldosterone, indicating that Per1 activity influences the response of αENaC to aldosterone. Thus, Per1 appears to have aldosterone-dependent as well as aldosterone-independent effects on αENaC expression.
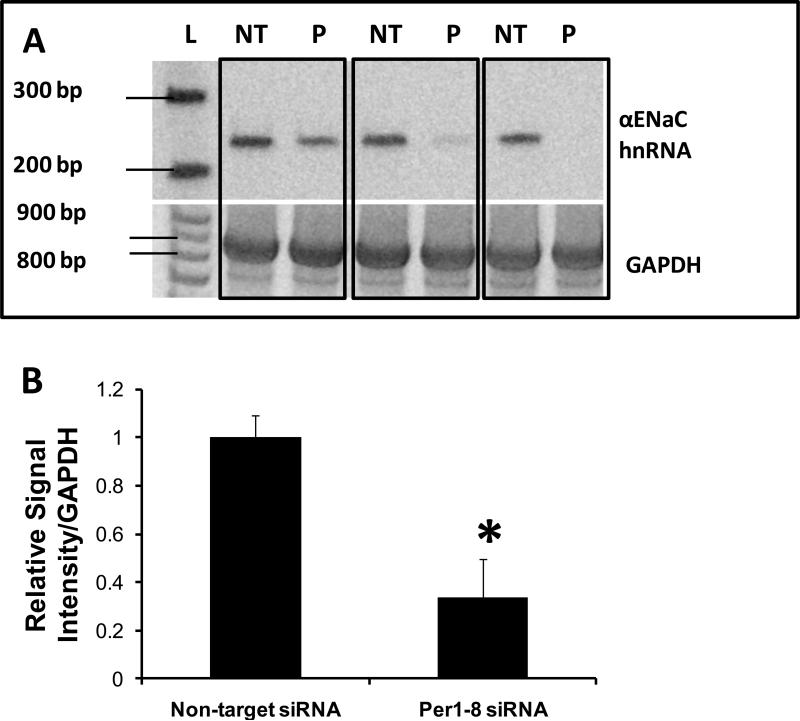
To further investigate the mechanism of the Per1-mediated regulation of αENaC mRNA expression, the effect of Per1 knockdown on transcription from the αENaC gene was evaluated. Heterogeneous nuclear RNA (hnRNA) levels can be used as a measure of transcriptional activity [31]. αENaC hnRNA levels were evaluated in mpkCCDc14 cells following transfection with a non target siRNA or the Per1-8 siRNA (Figure 6A). Basal αENaC mRNA levels appeared to differ between individual samples. However, the results of three independent experiments clearly showed that αENaC hnRNA levels were reduced in every sample set following Per1 knockdown (see boxed samples). Densitometry analysis of Figure 6A demonstrated that Per1 knockdown resulted in a greater than 60% reduction in αENaC hnRNA levels (Figure 6B). Thus, Per1 appears to regulate the basal expression of αENaC at the level of transcription in mpkCCDc14 cells.
Figure 6. Per1 knockdown Inhibits αENaC transcription in mpkCCDc14 cells.
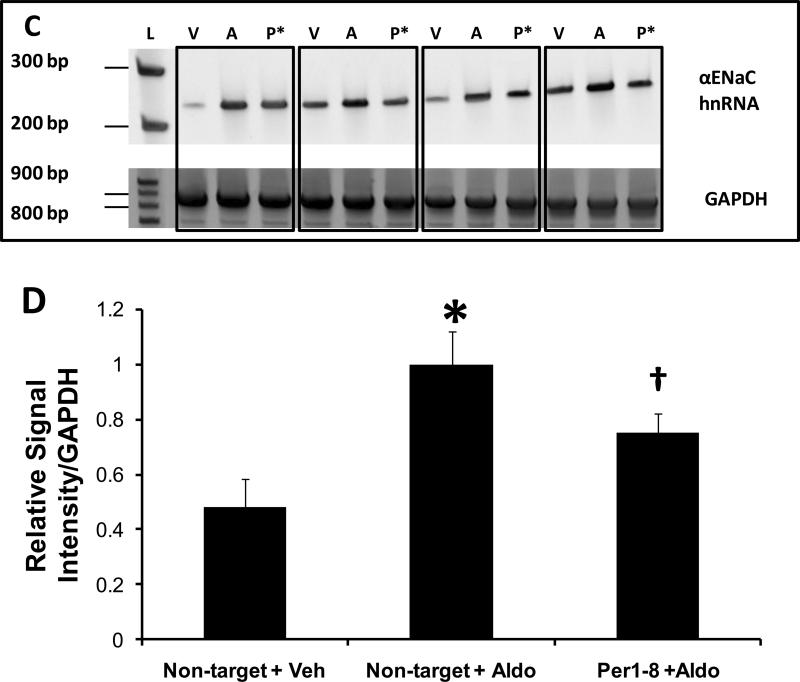
A. Top panel: Primers were designed to amplify a 238 bp region of the αENaC gene between exon 8 and intron 8 in order to measure heterogeneous nuclear RNA as an indicator of transcriptional activity. Templates from non-target siRNA or Per1–8 siRNA transfected mpkCCDc14 cells were used in PCR reactions, n=3. L: ladder, NT: non-target siRNA, P: Per1–8 siRNA. Bottom panel: An 874 bp GAPDH product was amplified as a PCR control. Boxed samples represent independent experiments. B. Densitometry analysis was performed on the gel images in panel A and is presented as signal intensity relative to GAPDH. * p<0.05 versus non-target siRNA. C. The same experiment was performed as described for (A) but mpkCCDc14 cells were treated with vehicle or aldosterone for 24 hr following siRNA transfection. L: ladder, V: non-target siRNA +vehicle, A: non-target siRNA +aldosterone, P*: Per1–8 siRNA plus aldosterone. N=3 D. Densitometry analysis was performed as described for Panel B. * p<0.05 versus non-target siRNA + vehicle; † p<0.05 versus non-target siRNA +aldosterone.
The effect of Per1 knockdown on αENaC hnRNA levels was next evaluated in mpkCCDc14 cells treated with vehicle or aldosterone (Figure 6C). αENaC hnRNA levels in control samples (non-target siRNA transfected, vehicle treated) again differed between independent samples. Nevertheless, as expected, aldosterone treatment in the presence of a non-target control siRNA led to a clear increase in αENaC transcription. Aldosterone treatment in the presence of the Per1–8 siRNA however, resulted in inhibition of αENaC transcription. These effects are illustrated in Figure 6D; densitometry analysis indicates that αENaC hnRNA levels more than doubled in response to aldosterone. Per1 knockdown led to a significant reduction in αENaC hnRNA to a level that was not significantly different from control. These results are consistent with the hypothesis that Per1 regulates αENaC mRNA expression and influences the response of αENaC to aldosterone.
3.5 Per1 Interacts with an E-box response element found in the αENaC Promoter
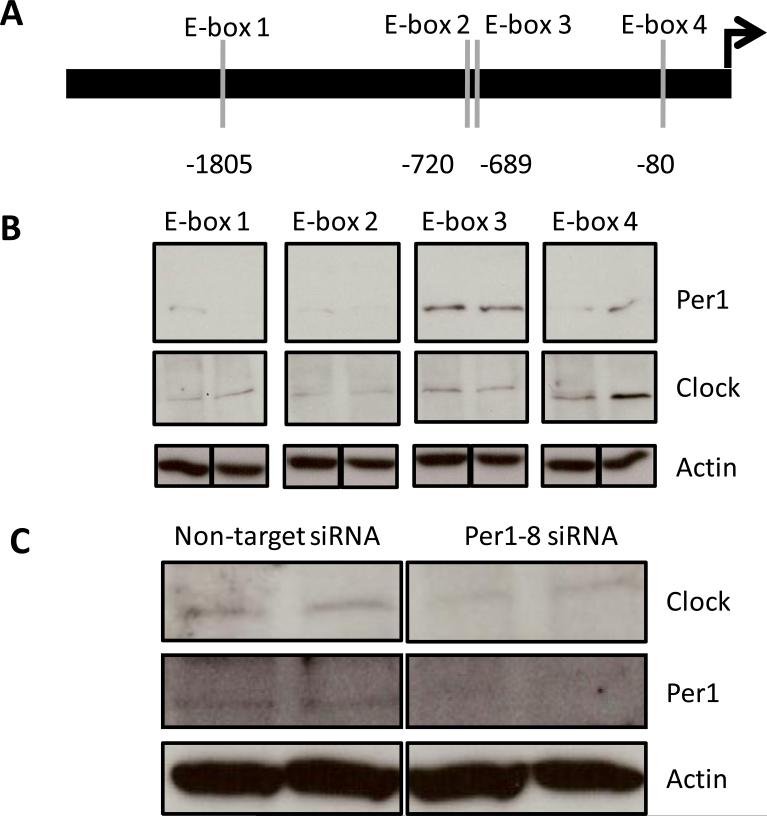
Several lines of evidence supported the hypothesis that Per1 directly regulates αENaC and has aldosterone-dependent and –independent effects on αENaC expression. Therefore, the next step was to attempt to identify the circadian response elements in the αENaC promoter. Transcription factors of the circadian clock mediate their effects through binding of E-box elements in the promoters of target genes [34]. In addition to the TF Search analysis performed previously [8], a more sophisticated computer analysis of the αENaC promoter was conducted using TESS (Transcription Element Search System). The 5' regulatory region of the murine αENaC promoter contained four predicted E-box elements (Figure 7A). To experimentally test the hypothesis that Per1 regulates αENaC as part of a protein complex that interacts with E-box response elements in the αENaC promoter, DNA affinity purification assays (DAPA) were performed. Nuclear extracts from mpkCCDc14 cells were incubated with biotinylated DAPA probes. Because Per1 lacks a DNA binding domain, any interaction with a promoter element would require the presence of Bmal/Clock. Thus, DNA/protein complexes bound to the probes containing putative E-box elements were analyzed by Western blot analysis with anti-Clock or anti-Per1 antibodies (Figure 7B). The Clock protein was detected at all four E-box response elements. Per1 was detected at a molecular weight of approximately 45 kDa; nuclear Per1 has previously been detected at this molecular weight in the kidney [35]. A very faint signal for Per1 was observed in duplicate samples at E-boxes 1, 2 and 4. The strongest signal for Per1 was clearly detected at E-box 3.
Figure 7. Per1 interacts with an E-box response element in the αENaC promoter.
A. Circadian clock proteins typically bind E-box elements. The αENaC promoter was analyzed for E-box elements using TFSEARCH and TESS. Four putative elements were found and are designated by the vertical gray lines. The position of each E-box element relative to the transcription start site is indicated. Complete DAPA probe sequences are listed in Methods. The consensus E-box sequence contained within each probe is: E-box 1, CAGCTG; E-box 2, CAGAGG; E-box 3, CAGGTG; E-box 4, CAGGTG. B. DNA affinity purification assays (DAPA) were performed using nuclear extract from duplicate mpkCCDc14 cell samples. Biotinylated probes representing each putative E-box from the αENaC promoter were incubated with nuclear extract samples and pulled down using streptavidin agarose beads. Samples were analyzed using Western blot analysis with an anti-Per1 antibody (Affinity BioReagents) or an anti-Clock antibody (Thermo Fisher Scientific). Data are representative of three independent experiments. In the lower panel, separate Western blot analysis for actin was performed on 20 μg of the input nuclear extract samples used in the DAPA experiment. C. DAPA experiments were performed as described for Panel B, but using only E-box 3 incubated with nuclear extract from non-target or Per1–8 siRNA transfected mpkCCDc14 cells. In the bottom panel, separate Western blot analysis for actin was performed on 20 μg of the input nuclear extract samples used in the DAPA experiment.
To test the specificity of this interaction, DAPA was performed using nuclear extracts from non-target siRNA or Per1–8 siRNA-transfected mpkCCDc14 cells (Figure 7C). These nuclear extracts were incubated with the biotinylated E-box 3 probe. Binding of the Clock protein to E-box 3 was detectable in the presence or absence of Per1, though the signal was reduced in the absence of Per1. Importantly, Per1 was undetectable at E-box 3 following Per1 knockdown.
4. Discussion
The goal of the present study was to characterize the role of Per1 in the regulation of αENaC expression in the renal cortex, the site of the most robust ENaC activity. The data presented here demonstrate a role for the circadian clock protein Per1 in direct transcriptional regulation of the αENaC gene. αENaC mRNA levels were reduced in the cortex of Per1 knockout mice compared to wild type, confirming that loss of Per1 leads to inhibition of αENaC expression in this region in vivo. Per1 was shown to be an aldosterone-induced gene in mpkCCDc14 cells. Several lines of evidence suggested that Per1 mediates the regulation of αENaC through a transcriptional mechanism. αENaC promoter luciferase assays and analysis of hnRNA levels indicated that Per1 mediates the basal regulation of αENaC and contributes to the aldosterone-dependent regulation of αENaC gene expression. Finally, DAPA was used to test whether a Per1-containing complex interacted with any of several E-box elements in the αENaC promoter. Per1 protein was far more readily detected at E-box 3 as opposed to the other putative E-box elements. To our knowledge, this is the first demonstration of direct interaction of an endogenously expressed circadian clock protein to a response element of a renal transport gene in a model of the mammalian CCD.
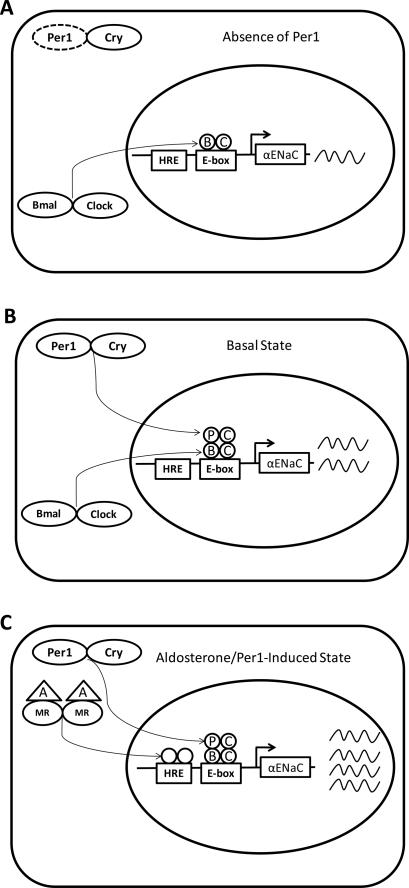
A working model has been developed to summarize these data and speculate on the action of Per1 at the αENaC promoter (Figure 8). In the absence of Per1, low levels of αENaC expression can be detected (Figure 8A). In the basal state, Per1 is present at the E-box at position −689 via interaction with Clock and presumably Bmal. This interaction yields an increase in transcription (Figure 8B). This prediction is based on data from the present report that Per1 interacts with the αENaC promoter and contributes to the basal regulation of αENaC in the absence of hormone. The two-fold increase in αENaC mRNA in the presence of Per1 (Figure 8B) relative to its absence (Figure 8A) is consistent with the 50% reduction in αENaC mRNA observed in the cortex of Per1 deficient mice compared to wild type mice [8]. Given the demonstrated circadian variation in αENaC mRNA [8], it is hypothesized that the presence of Per1 at the αENaC promoter E-box varies with the circadian cycle and thus αENaC mRNA expression fluctuates between the states depicted in Figures 8 A and B. Our demonstration of a role for Per1 as a positive regulator of gene expression is consistent with a recent study concerning the circadian regulation of prolactin gene expression in pituitary cells [7]). Similar to the present report of Per1 siRNA-mediated inhibition of αENaC expression, Bose and Boockfor showed that Per1 knockdown resulted in decreased prolactin expression. MR and the glucocorticoid receptor mediate aldosterone action via binding of hormone response elements (HRE) in the promoters of target genes. The HRE in the αENaC promoter at position −800 was previously characterized by Kohler et al. [36]. It is proposed that αENaC transcription is most highly activated when both Per1 and MR are present at the promoter (Figure 8C). It remains to be determined if a direct interaction between Per1 and MR occurs at the αENaC promoter. However, a connection between a nuclear receptor and a circadian clock protein is not without precedent. Direct interactions have been observed between the Clock protein and RARα and RXRα, with implications for resetting of the peripheral clock in the vasculature [37]. Per2 was recently shown to interact with nuclear receptors PPARα and RevERBα [38]). Indeed, Teboul et al. suggest that in light of recent evidence, it appears that nuclear receptor signaling “is a pivotal interface between the molecular clock and physiology [39].” Further investigation is needed to explore the possibility of direct interactions between nuclear hormone receptors and circadian clock proteins.
Figure 8. Model for Per1 action on αENaC gene expression.
The work described in the present study, together with previous reports on the regulation of αENaC by Per1 [8] and corticosteroids [36] have led to a proposed model for a transcriptional mechanism of gene regulation. A. In the absence of Per1, the Bmal/Clock heterodimer is bound to the promoter and αENaC mRNA levels are low. B. Per1 and its binding partner Cry are present at the promoter via interaction with Bmal/Clock to drive αENaC transcription under basal conditions. C. In the presence of aldosterone (A) the mineralocorticoid receptor (MR) heterodimerizes and translocates to the nucleus to increase transcription of αENaC. When Per1 is present, αENaC transcription is highly induced through the action of Per1 and MR.
The present observation that Per1 and Clock are present at an E-box element from the αENaC promoter is consistent with the known action of circadian clock proteins. It has previously been demonstrated that circadian clock proteins mediate their effects through transcriptional mechanisms and specifically through the binding of E-box elements in promoter regions [40]; the consensus E-box sequence is CAXXTG [41]. In the kidney, Saifur Rohman et al. showed that the Na/H exchanger NHE3 appears to be a circadian clock controlled gene [42]. Consistent with an in vivo role for the circadian clock in the regulation of NHE3, the circadian pattern of NHE3 mRNA expression was blunted in Cry deficient mice. Using an opossum kidney cell model, it was shown that this regulation was mediated through binding of Bmal/Clock to the E-box element CACGTG in the NHE3 promoter. The NHE3 promoter E-box differs by only one nucleotide from the αENaC promoter E-box 3 (CAGGTG) element identified in the present report (Figure 7).
Recently, aquaporin 2 was also identified as an apparent circadian clock controlled gene [12]. An in silico analysis of the mouse aquaporin 2 promoter was performed using TF Search (data not shown). Three putative E-box elements were identified at positions −449, −1259, and −1319, relative to the transcription start site. The E-box element with the strongest score was located at position −1259 with the sequence CATCTG. Confirmation of E-box elements in the promoters of αENaC and NHE3, together with identification of putative E-box elements in the aquaporin 2 promoter, suggests that future investigation into the role of the circadian clock in the kidney will likely identify many more genes regulated by this transcriptional mechanism.
Circadian patterns in renal function are well established [43, 44]. Likewise, there is a known diurnal variation in blood pressure, with values falling at relative night compared to the day. Clinical data convincingly show that when this dipping pattern is lost, so-called “non-dipper” patients are at a greater risk for end organ damage, heart attack and stroke [45]. Whereas the circadian patterns to physiological processes are well established, the underlying molecular mechanisms of these effects are the focus of current investigation. The results presented here support a transcriptional mechanism by which Per1, as part of a multi-protein complex containing Clock, exerts its effects on αENaC expression. Consistent with the present report is the work of other investigators demonstrating regulation of NHE3 [42] and other genes involved in renal transport such as aquaporin 2 [12] by the circadian clock. Clearly, the circadian clock is a critical regulator of gene expression in the kidney and this has implications for the circadian control of blood pressure and renal function. Further study of the mechanisms involved in circadian clock function in the kidney and the pathologies associated with loss of these mechanisms will be important for a complete understanding of the circadian clock in normal physiology as well as disease states.
Acknowledgments
The authors would like to thank Rene Cohn for technical assistance, Dr. David Virshup for the dnPer1 construct, Dr. Christie Thomas for the αENaC-luciferase construct, Dr. Alain Vandewalle for the mpkCCDc14 cells, Dr. Carolyn Ecelbarger for the αENaC antibody, and Dr. David Weaver for providing kidney tissue from Per1 KO and wild type control mice. This work was supported by the Department of Veterans Affairs and NIDDK RO1 DK049750 to C.S. Wingo and NIDDK T32 DK-07518 and AHA 0825467E to M.L. Gumz.
Footnotes
Publisher's Disclaimer: This is a PDF file of an unedited manuscript that has been accepted for publication. As a service to our customers we are providing this early version of the manuscript. The manuscript will undergo copyediting, typesetting, and review of the resulting proof before it is published in its final citable form. Please note that during the production process errors may be discovered which could affect the content, and all legal disclaimers that apply to the journal pertain.
4. References
- [1].Froy O. Metabolism and Circadian Rhythms--Implications for Obesity. Endocrine Reviews. 2009 doi: 10.1210/er.2009-0014. [DOI] [PubMed] [Google Scholar]
- [2].Rudic RD, Fulton DJ. Pressed for time: the circadian clock and hypertension. J Appl Physiol. 2009;107:1328–1338. doi: 10.1152/japplphysiol.00661.2009. [DOI] [PMC free article] [PubMed] [Google Scholar]
- [3].Albrecht U. The mammalian circadian clock: a network of gene expression. Front Biosci. 2004;9:48–55. doi: 10.2741/1196. [DOI] [PubMed] [Google Scholar]
- [4].Albrecht U, Eichele G. The mammalian circadian clock. Current Opinion in Genetics & Development. 2003;13:271–277. doi: 10.1016/s0959-437x(03)00055-8. [DOI] [PubMed] [Google Scholar]
- [5].Kondratov RV, Kondratova AA, Gorbacheva VY, Vykhovanets OV, Antoch MP. Early aging and age-related pathologies in mice deficient in BMAL1, the core componentof the circadian clock. Genes & Development. 2006;20:1868–1873. doi: 10.1101/gad.1432206. [DOI] [PMC free article] [PubMed] [Google Scholar]
- [6].Kondratov RV, Shamanna RK, Kondratova AA, Gorbacheva VY, Antoch MP. Dual role of the CLOCK/BMAL1 circadian complex in transcriptional regulation. Faseb J. 2006;20:530–532. doi: 10.1096/fj.05-5321fje. [DOI] [PubMed] [Google Scholar]
- [7].Bose S, Boockfor FR. Episodes of prolactin gene expression in GH3 cells are dependent on selective promoter binding of multiple circadian elements. Endocrinology. 2010;151:2287–2296. doi: 10.1210/en.2009-1252. [DOI] [PMC free article] [PubMed] [Google Scholar]
- [8].Gumz ML, Stow LR, Lynch IJ, Greenlee MM, Rudin A, Cain BD, Weaver DR, Wingo CS. The circadian clock protein Period 1 regulates expression of the renal epithelial sodium channel in mice. The Journal of Clinical Investigation. 2009;119:2423–2434. doi: 10.1172/JCI36908. [DOI] [PMC free article] [PubMed] [Google Scholar]
- [9].Duffield GE. DNA microarray analyses of circadian timing: the genomic basis of biological time. Journal of Neuroendocrinology. 2003;15:991–1002. doi: 10.1046/j.1365-2826.2003.01082.x. [DOI] [PubMed] [Google Scholar]
- [10].Anea CB, Zhang M, Stepp DW, Simkins GB, Reed G, Fulton DJ, Rudic RD. Vascular disease in mice with a dysfunctional circadian clock. Circulation. 2009;119:1510–1517. doi: 10.1161/CIRCULATIONAHA.108.827477. [DOI] [PMC free article] [PubMed] [Google Scholar]
- [11].Martino TA, Oudit GY, Herzenberg AM, Tata N, Koletar MM, Kabir GM, Belsham DD, Backx PH, Ralph MR, Sole MJ. Circadian rhythm disorganization produces profound cardiovascular and renal disease in hamsters. Am J Physiol Regul Integr Comp Physiol. 2008;294:R1675–1683. doi: 10.1152/ajpregu.00829.2007. [DOI] [PubMed] [Google Scholar]
- [12].Zuber AM, Centeno G, Pradervand S, Nikolaeva S, Maquelin L, Cardinaux L, Bonny O, Firsov D. Molecular clock is involved in predictive circadian adjustment of renal function. Proceedings of the National Academy of Sciences of the United States of America. 2009;106:16523–16528. doi: 10.1073/pnas.0904890106. [DOI] [PMC free article] [PubMed] [Google Scholar]
- [13].Hummler E, Horisberger JD. Genetic disorders of membrane transport. V. The epithelial sodium channel and its implication in human diseases. The American Journal of Physiology. 1999;76:G567–571. doi: 10.1152/ajpgi.1999.276.3.G567. [DOI] [PubMed] [Google Scholar]
- [14].Escoubet B, Coureau C, Bonvalet JP, Farman N. Noncoordinate regulation of epithelial Na channel and Na pump subunit mRNAs in kidney and colon by aldosterone. The American Journal of Physiology. 1997;272:C1482–1491. doi: 10.1152/ajpcell.1997.272.5.C1482. [DOI] [PubMed] [Google Scholar]
- [15].Masilamani S, Kim GH, Mitchell C, Wade JB, Knepper MA. Aldosterone-mediated regulation of ENaC alpha, beta, and gamma subunit proteins in rat kidney. The Journal of Clinical Investigation. 1999;104:R19–23. doi: 10.1172/JCI7840. [DOI] [PMC free article] [PubMed] [Google Scholar]
- [16].Gumz ML, Popp MP, Wingo CS, Cain BD. Early transcriptional effects of aldosterone in a mouse inner medullary collecting duct cell line. American Journal of Physiology. 2003;285:F664–673. doi: 10.1152/ajprenal.00353.2002. [DOI] [PubMed] [Google Scholar]
- [17].Thomas CP, Itani OA. New insights into epithelial sodium channel function in the kidney: site of action, regulation by ubiquitin ligases, serum- and glucocorticoid-inducible kinase and proteolysis. Current Opinion in Nephrology and Hypertension. 2004;13:541–548. doi: 10.1097/00041552-200409000-00010. [DOI] [PubMed] [Google Scholar]
- [18].Bens M, Vallet V, Cluzeaud F, Pascual-Letallec L, Kahn A, Rafestin-Oblin ME, Rossier BC, Vandewalle A. Corticosteroid-dependent sodium transport in a novel immortalized mouse collecting duct principal cell line. J Am Soc Nephrol. 1999;10:923–934. doi: 10.1681/ASN.V105923. [DOI] [PubMed] [Google Scholar]
- [19].Robert-Nicoud M, Flahaut M, Elalouf JM, Nicod M, Salinas M, Bens M, Doucet A, Wincker P, Artiguenave F, Horisberger JD, Vandewalle A, Rossier BC, Firsov D. Transcriptome of a mouse kidney cortical collecting duct cell line: effects of aldosterone and vasopressin. Proceedings of the National Academy of Sciences of the United States of America. 2001;98:2712–2716. doi: 10.1073/pnas.051603198. [DOI] [PMC free article] [PubMed] [Google Scholar]
- [20].Stow LR, Gumz ML, Lynch IJ, Greenlee MM, Rudin A, Cain BD, Wingo CS. Aldosterone modulates steroid receptor binding to the endothelin-1 gene (edn1) The Journal of Biological Chemistry. 2009;284:30087–30096. doi: 10.1074/jbc.M109.030718. [DOI] [PMC free article] [PubMed] [Google Scholar]
- [21].Fakitsas P, Adam G, Daidie D, van Bemmelen MX, Fouladkou F, Patrignani A, Wagner U, Warth R, Camargo SM, Staub O, Verrey F. Early aldosterone-induced gene product regulates the epithelial sodium channel by deubiquitylation. J Am Soc Nephrol. 2007;18:1084–1092. doi: 10.1681/ASN.2006080902. [DOI] [PubMed] [Google Scholar]
- [22].Edinger RS, Lebowitz J, Li H, Alzamora R, Wang H, Johnson JP, Hallows KR. Functional regulation of the epithelial Na+ channel by IkappaB kinase-beta occurs via phosphorylation of the ubiquitin ligase Nedd4-2. The Journal of Biological Chemistry. 2009;284:150–157. doi: 10.1074/jbc.M807358200. [DOI] [PMC free article] [PubMed] [Google Scholar]
- [23].Soundararajan R, Zhang TT, Wang J, Vandewalle A, Pearce D. A novel role for glucocorticoid-induced leucine zipper protein in epithelial sodium channel-mediated sodium transport. The Journal of Biological Chemistry. 2005;280:39970–39981. doi: 10.1074/jbc.M508658200. [DOI] [PubMed] [Google Scholar]
- [24].Hallows KR, Wang H, Edinger RS, Butterworth MB, Oyster NM, Li H, Buck J, Levin LR, Johnson JP, Pastor-Soler NM. Regulation of epithelial Na+ transport by soluble adenylyl cyclase in kidney collecting duct cells. The Journal of Biological Chemistry. 2009 doi: 10.1074/jbc.M805501200. [DOI] [PMC free article] [PubMed] [Google Scholar]
- [25].Staruschenko A, Pochynyuk O, Vandewalle A, Bugaj V, Stockand JD. Acute regulation of the epithelial Na+ channel by phosphatidylinositide 3-OH kinase signaling in native collecting duct principal cells. J Am Soc Nephrol. 2007;18:1652–1661. doi: 10.1681/ASN.2007010020. [DOI] [PubMed] [Google Scholar]
- [26].Pavlov TS, Levchenko V, Karpushev AV, Vandewalle A, Staruschenko A. PPAR{gamma} antagonists decrease Na+ transport via the epithelial Na+ channel (ENaC) Molecular Pharmacology. 2009 doi: 10.1124/mol.109.056911. [DOI] [PubMed] [Google Scholar]
- [27].Helms MN, Liu L, Liang YY, Al-Khalili O, Vandewalle A, Saxena S, Eaton DC, Ma HP. Phosphatidylinositol 3,4,5-trisphosphate mediates aldosterone stimulation of epithelial sodium channel (ENaC) and interacts with gamma-ENaC. The Journal of Biological Chemistry. 2005;280:40885–40891. doi: 10.1074/jbc.M509646200. [DOI] [PubMed] [Google Scholar]
- [28].Chang CT, Wu MS, Tian YC, Chen KH, Yu CC, Liao CH, Hung CC, Yang CW. Enhancement of epithelial sodium channel expression in renal cortical collecting ducts cells by advanced glycation end products. Nephrol Dial Transplant. 2007;22:722–731. doi: 10.1093/ndt/gfl668. [DOI] [PubMed] [Google Scholar]
- [29].Bae K, Jin X, Maywood ES, Hastings MH, Reppert SM, Weaver DR. Differential functions of mPer1, mPer2, and mPer3 in the SCN circadian clock. Neuron. 2001;30:525–536. doi: 10.1016/s0896-6273(01)00302-6. [DOI] [PubMed] [Google Scholar]
- [30].Livak KJ, Schmittgen TD. Analysis of relative gene expression data using real-time quantitative PCR and the 2(-Delta Delta C(T)) Method. Methods. 2001;25:402–408. doi: 10.1006/meth.2001.1262. [DOI] [PubMed] [Google Scholar]
- [31].Lipson KE, Baserga R. Transcriptional activity of the human thymidine kinase gene determined by a method using the polymerase chain reaction and an intron-specific probe. Proceedings of the National Academy of Sciences of the United States of America. 1989;86:9774–9777. doi: 10.1073/pnas.86.24.9774. [DOI] [PMC free article] [PubMed] [Google Scholar]
- [32].Chen H, Kilberg MS. Alignment of the transcription start site coincides with increased transcriptional activity from the human asparagine synthetase gene following amino acid deprivation of HepG2 cells. The Journal of Nutrition. 2006;136:2463–2467. doi: 10.1093/jn/136.10.2463. [DOI] [PMC free article] [PubMed] [Google Scholar]
- [33].Vielhaber E, Eide E, Rivers A, Gao ZH, Virshup DM. Nuclear entry of the circadian regulator mPER1 is controlled by mammalian casein kinase I epsilon. Molecular and Cellular Biology. 2000;20:4888–4899. doi: 10.1128/mcb.20.13.4888-4899.2000. [DOI] [PMC free article] [PubMed] [Google Scholar]
- [34].Oster H, van der Horst GT, Albrecht U. Daily variation of clock output gene activation in behaviorally arrhythmic mPer/mCry triple mutant mice. Chronobiology International. 2003;20:683–695. doi: 10.1081/cbi-120022408. [DOI] [PubMed] [Google Scholar]
- [35].Chilov D, Hofer T, Bauer C, Wenger RH, Gassmann M. Hypoxia affects expression of circadian genes PER1 and CLOCK in mouse brain. Faseb J. 2001;15:2613–2622. doi: 10.1096/fj.01-0092com. [DOI] [PubMed] [Google Scholar]
- [36].Kohler S, Pradervand S, Verdumo C, Merillat AM, Bens M, Vandewalle A, Beermann F, Hummler E. Analysis of the mouse Scnn1a promoter in cortical collecting duct cells and in transgenic mice. Biochimica et Biophysica Acta. 2001;1519:106–110. doi: 10.1016/s0167-4781(01)00228-7. [DOI] [PubMed] [Google Scholar]
- [37].McNamara P, Seo SB, Rudic RD, Sehgal A, Chakravarti D, FitzGerald GA. Regulation of CLOCK and MOP4 by nuclear hormone receptors in the vasculature: a humoral mechanism to reset a peripheral clock. Cell. 2001;105:877–889. doi: 10.1016/s0092-8674(01)00401-9. [DOI] [PubMed] [Google Scholar]
- [38].Schmutz I, Ripperger JA, Baeriswyl-Aebischer S, Albrecht U. The mammalian clock component PERIOD2 coordinates circadian output by interaction with nuclear receptors. Genes & Development. 2010;24:345–357. doi: 10.1101/gad.564110. [DOI] [PMC free article] [PubMed] [Google Scholar]
- [39].Teboul M, Grechez-Cassiau A, Guillaumond F, Delaunay F. How nuclear receptors tell time. J Appl Physiol. 2009;107:1965–1971. doi: 10.1152/japplphysiol.00515.2009. [DOI] [PubMed] [Google Scholar]
- [40].Jin X, Shearman LP, Weaver DR, Zylka MJ, de Vries GJ, Reppert SM. A molecular mechanism regulating rhythmic output from the suprachiasmatic circadian clock. Cell. 1999;96:57–68. doi: 10.1016/s0092-8674(00)80959-9. [DOI] [PubMed] [Google Scholar]
- [41].Park CW, Walker MD. Subunit structure of cell-specific E box-binding proteins analyzed by quantitation of electrophoretic mobility shift. The Journal of Biological Chemistry. 1992;267:15642–15649. [PubMed] [Google Scholar]
- [42].Saifur Rohman M, Emoto N, Nonaka H, Okura R, Nishimura M, Yagita K, van der Horst GT, Matsuo M, Okamura H, Yokoyama M. Circadian clock genes directly regulate expression of the Na(+)/H(+) exchanger NHE3 in the kidney. Kidney International. 2005;67:1410–1419. doi: 10.1111/j.1523-1755.2005.00218.x. [DOI] [PubMed] [Google Scholar]
- [43].Buijsen JG, van Acker BA, Koomen GC, Koopman MG, Arisz L. Circadian rhythm of glomerular filtration rate in patients after kidney transplantation. Nephrol Dial Transplant. 1994;9:1330–1333. [PubMed] [Google Scholar]
- [44].Voogel AJ, Koopman MG, Hart AA, van Montfrans GA, Arisz L. Circadian rhythms in systemic hemodynamics and renal function in healthy subjects and patients with nephrotic syndrome. Kidney International. 2001;59:1873–1880. doi: 10.1046/j.1523-1755.2001.0590051873.x. [DOI] [PubMed] [Google Scholar]
- [45].Hermida RC, Ayala DE, Portaluppi F. Circadian variation of blood pressure: The basis for the chronotherapy of hypertension. Advanced Drug Delivery Reviews. 2007;59:904–922. doi: 10.1016/j.addr.2006.08.003. [DOI] [PubMed] [Google Scholar]


