

Abstract
Background
Alteration of glutamatergic neurotransmission in the prefrontal cortex (PFC) may contribute to the pathophysiology of alcoholism and major depressive disorder (MDD). Among glial cells, astrocytes are mostly responsible for recycling synaptic glutamate by uptake through excitatory amino acid transporters 1 and 2 (EAAT1 and EAAT2), and conversion to glutamine with glutamine synthetase (GS). Low density of astrocytes in the PFC of “uncomplicated’ alcoholics and MDD subjects may parallel altered glutamate transporters and GS in the PFC.
Methods
Immunohistochemistry and Western blotting for glutamate transporters, GS and glial fibrillary acidic protein (GFAP) were applied to postmortem tissue of the left orbitofrontal cortex from 13 subjects with MDD, 13 with alcoholism, 10 with comorbid alcoholism plus MDD (MDA), and 13 non-psychiatric controls. Area fraction of immunoreactivity was measured in sections, and protein levels in Western blots.
Results
EAAT2 immunoreactivity was significantly lower in MDD and MDA subjects than in controls. EAAT1 levels were lower in MDA and MDD subjects as compared to controls, while GS levels in MDA were significantly lower than in alcoholics and controls, and lower in MDD subjects than in alcoholics. Area fraction of GFAP was lower in MDD, but not in MDA subjects as compared to controls or alcoholics.
Limitations
High variability of protein levels in some groups and effects of antidepressant treatment, although appearing to be limited, cannot be fully evaluated.
Conclusions
There are differential changes in the expression of glial glutamatergic markers in depression and alcoholism, suggesting a depletion of certain aspects of glutamatergic processing in depression.
Keywords: Astrocytes, Alcohol dependence, Major depressive disorder, Orbitofrontal cortex, Postmortem, Human
1. Introduction
Altered glutamatergic neurotransmission in the prefrontal cortex (PFC) may contribute to the pathophysiology of depression (Auer et al., 2000; Choudary et al., 2005; Paul and Skolnick, 2003; Sanacora et al., 2004) and alcoholism (Davis and Wu, 2001; Krystal et al., 2003; Tsai, 1998). In addition, a reduced density of glial cells was reported in specific PFC areas of subjects with major depressive disorder (MDD) and “uncomplicated” alcoholics (without Wernicke’s or Korsakoff’s syndromes) (Miguel-Hidalgo et al., 2002, 2006), and in the hippocampus of alcoholics (Korbo, 1999). Astrocytes uptake glutamate through transporters EAAT1 and EAAT2 (Anderson and Swanson, 2000) and convert glutamate to glutamine employing the enzyme glutamine synthetase (GS), heavily expressed by gray matter astrocytes (Toro et al., 2006). Glutamine, less toxic than glutamate, then is transferred to neurons where it converts to glutamate (Hertz et al., 1999). Interestingly, gene microarray studies have revealed reduced expression of mRNA for excitatory amino acid transporter 1 (EAAT1), EAAT2 and GS in the PFC of MDD subjects (Choudary et al., 2005).
Many astrocytes also express the cytoskeletal protein glial fibrillary acidic protein (GFAP). The levels of GFAP or its mRNA, and the spatial extent occupied by GFAP immunoreactive processes were reduced in the PFC in depression (Johnston-Wilson et al., 2000; Miguel-Hidalgo et al., 2000; Si et al., 2004) (although in late-life depression there might be a rebound increase in GFAP levels (Davis et al., 2002)). The levels of GFAP in the PFC, according to gene expression studies, may also be reduced in alcoholism (Lewohl et al., 2000; Lewohl et al., 2005; Miguel-Hidalgo, 2005; Miguel- Hidalgo et al., 2002; Worst and Vrana, 2005).
MDD and alcoholism are comorbid at a rate greater than chance, but they also occur separately, displaying distinct behavioral and emotional disturbances (Nurnberger et al., 2002; Petrakis et al., 2002). Thus, despite similarities in glial density alterations, those two disorders may differ in details of glial involvement. Differences between alcoholism and MDD might be explained by the frequent exposure to ethanol in alcoholics, because ethanol is known to heavily and directly affect the function of glial cells (Snyder, 1996), while the glial pathology observed in depressed subjects might be related to alteration in molecular mechanisms more specific to idio-pathic neuronal and molecular alterations in MDD. In astrocyte cultures and during development, motility of astrocyte processes, glial cell proliferation and expression of GFAP are reduced by ethanol (Crews et al., 2004; Guerri and Renau-Piqueras, 1997). In addition, acute alcohol exposure or alcohol-induced brain damage can result in gliosis (enlargement of astrocytes and their processes) and increased GFAP synthesis (Crews et al., 2004; Evrard et al., 2006). In contrast to acute exposure, prolonged ethanol intake results in down-regulation of GFAP immunoreactivity (Duvernoy et al., 1981; Franke et al., 1997; Miguel-Hidalgo, 2005).
In animal models that test the behavioral effects of antidepressant treatments, glutamate transporter activity within the PFC may play an important role in the expression of stress-like behaviors that are sensitive to antidepressant administration (Banasr et al., 2008). Thus, the antidepressant actions of riluzole detected in clinical trials (Sanacora et al., 2007) may depend on the stimulation of glutamate uptake in the PFC (Banasr et al., 2008; Chowdhury et al., 2008; Sanacora et al., 2007). Moreover, experimentally induced damage to GFAP positive glial cells in the PFC of rats is concomitant with the manifestation of depression-like behaviors in rats (Banasr and Duman, 2008). On the other hand, ethanol alters the expression of glutamate receptors (Freund and Anderson, 1996; Tsai and Coyle, 1998) and transporters (Flatscher-Bader et al., 2005; Flatscher-Bader and Wilce, 2008; Zink et al., 2004), and the activity and levels of GS (Davies and Vernadakis, 1984; Matsuda-Matsumoto et al., 2007) as detected in vitro and in postmortem human brain tissue. The direction of some of glutamate transporter changes in alcoholics as compared to controls is apparently in the opposite direction to the changes reported in postmortem studies of MDD subjects (Choudary et al., 2005; Kang et al., 2007). Thus, there may be differences in the expression of glutamate transporters, GS and GFAP in alcoholics as compared to depressed subjects, particularly in the orbitofrontal region (ORB) of the human prefrontal cortex, where functional and cellular changes have been detected both in depression and alcoholism (Miguel-Hidalgo, 2009; Volkow and Li, 2004; Williams et al., 2004). The present study sought to determine if the expression of glial glutamate transporters, GS and GFAP were differentially altered in the ORB of subjects with alcoholism, depression without alcoholism or depression comorbid with alcoholism.
2. Methods
2.1. Human subjects
Human postmortem brain tissue was collected from autopsies at the Cuyahoga County Coroner’s Office in Cleveland, OH. Institutional Review Board policies were followed in obtaining consent from the next-of-kin, and performing retrospective psychiatric assessments. Retrospective diagnoses and psychiatric assessments were based on information obtained from knowledgeable informants (significant others, first-degree family members) and medical records. Information regarding psychiatric symptoms or the lack thereof was collected with the Structured Clinical Interview for the Diagnostic and Statistical Manual of Mental Disorders, Fourth Edition (DSM-IV). Additional information on the subjects comes from hospital records from other records of prior medical or substance abuse problems and from postmortem toxicology reports. Subjects with evidence of head trauma or neurological disease were excluded. Family reports and available medical records did not report Korsakoff’s psychosis or Wernicke’s encephalopathy in any of the subjects. The brains of 49 subjects were included in this study: 13 subjects with MDD and no alcohol dependence, 10 with comorbid MDD and alcohol dependence, 13 with alcohol dependence but no other psychiatric diagnosis, and 13 healthy. All subjects were younger than 81 years of age at death and had postmortem delays between death and sample collection shorter than 32 h. For each subject, a pH value was obtained using frozen brain tissue stored at −80 °C. In the group of 13 MDD subjects without alcoholism, 6 subjects were taking currently prescribed antidepressant medication, while, among the remaining seven, three were not being medicated and the other four did not take their prescribed antidepressant medication for more than four days. In the group of MDD subjects with comorbid alcoholism (MDA), 5 subjects were taking antidepressant medication. None of the control or the alcohol-dependent subjects was taking psychotropic medications. Table 1 summarizes demographic characteristics of the diagnostic groups.
Table 1.
Demographic characteristics of the groups of subjects in the present study.
| AGE | GENDER | Causes of death | ETHNICITY | PMD | pH | ONSET (MDD) | DURATION (MDD) | ONSET (ALC) | DURATION (ALC) | |
|---|---|---|---|---|---|---|---|---|---|---|
| Control | 51.15±14.44 | 6M, 7F | 10 CV, 1BP, 1PN, 1MT | 8C, 4AA, 1A | 22.44±7.28 | 6.43±0.40 | N/A | N/A | N/A | N/A |
| MDD (no ALC) | 48.54±19.89 | 9M, 4F | 9 SUIC, 1 HK, 1 GW, 2 CV | 11C, 1AA, 1A | 24.42±8.60 | 6.65±0.18 | 37.38±21.41 | 7.01±8.80 | N/A | N/A |
| MDD-ALC | 50.50±13.20 | 4M, 6F | 6 SUIC, 3 CV, 1 PTE | 10C | 26.05±4.76 | 6.61±0.23 | 30.78±13.53 | 15.52±11.93 | 26.40±10.42 | 23.18±15.31 |
| Alcoholism | 48.08±14.17 | 11M, 2F | 6 SUIC, 5 CV, 1 APX, 1 EG | 12C, 1AA | 22.73±7.72 | 6.66±0.16 | N/A | N/A | 22.23±5.89 | 25.92±11.76 |
Abbreviations: AA=African American, A: East Asian, APX=asphyxia, ALC=alcohol dependence, BP=bronchopneumonia, C=Caucasian, CV=cardiovascular disease, EG = esophagitis, F = female, GW = gunshot wound, HK = hyperkalemia, M = male, N/A = not applicable, MDD = major depressive disorder, MT = Multitrauma in car accident, PMD = Postmortem delay (time from death to freezing of brain samples), PN = pancreatitis, PTE = pulmonary thromboembolism, SUIC=suicide. AGE, ONSET and DURATION are given in years, and PMD in hours. Numerical values for AGE, PMD, pH, ONSET and DURATION are given as mean± standard deviation.
2.2. Tissue
Human postmortem tissue from the left ORB (Brodmann’s area 47) was examined. The groups of subjects were closely matched by age, postmortem delay, tissue pH, gender, and race and there was no significant difference in any of those variables between the groups. The detection of the borders of the rostral part of Brodmann’s area 47 located in front of the transverse sulcus and laterally to the medial orbital sulcus was based on cytoarchitectonic criteria and the pattern of orbital gyri and sulci (Duvernoy et al., 1981; Miguel-Hidalgo et al., 2006; Rajkowska and Goldman-Rakic, 1995; Rajkowska et al., 1999). Blocks of ORB were fresh frozen at autopsy to avoid further degradation or disturbance of tissue proteins and stored at −80 °C. For immunohistochemical and Western blot processing each frozen block was cut into 20-μm thick and 50-μm thick sections, respectively.
2.3. Immunohistochemistry
Sections for immunohistochemistry were cut directly at a thickness of 20 μm from fresh-frozen brain tissue blocks (because alternating 50-μm sections are dedicated to determine levels of specific proteins in Western blots), mounted on slides, fixed for 30 min in 4% paraformaldehyde, washed in phosphate buffer saline (pH 7.4) and processed using primary antibodies to EAAT2 (dilution 1:1000, polyclonal from guinea pig, Millipore, Temecula, CA), EAAT1 (dilution 1:1000, polyclonal from guinea pig, Millipore), GFAP (monoclonal from mouse, dilution 1:1000, Millipore) or GS (monoclonal from mouse, dilution 1:1000, Millipore). Biotinylated secondary antibodies were used and revealed by the ABC method using with 3′3′-diaminobenzidine enhanced with nickel ammonium sulfate.
In immunostained sections the two-dimensional extent of immunoreactivity was calculated as an area fraction. Sections for immunohistochemical techniques were available for 10 MDD subjects, 7 MDA subjects, 10 alcohol-dependent subjects and 10 normal subjects, and consequently statistical analyses involving area fractions include only these subjects. The area fraction was measured defining a non-immunoreactive background in the white matter and calculating the percent of area of the cortical gray matter with positive immunoreaction over the background levels (for methods see (Miguel-Hidalgo et al., 2000, 2002)), using the ImageJ software. The reference background level was obtained from non-immunoreactive portions of the white matter immediately adjacent to the region of interest by determining the optical density on a 0 to 255 grayscale (0 being white and 255 black) in three 100×100 μm squares with a 4× objective. The lack of immunoreactivity in reference background squares was confirmed by comparison to neighbor sections in which no specific primary antibody was used (only non-immune serum from the species of the first antibody) but was otherwise processed in the same way as sections subjected to specific primary antibodies. Both in sections without specific primary antibody and in sections with the specific antibody there was no significant difference in the grayscale levels of background portions between the groups, and the coefficient of variation of average gray levels of the background within each group was smaller than 2%. Specific immunoreactivity was considered to be at 20 grayscale levels over background for all preparations (grayscale levels ranged from 0 to 255). This procedure was applied to GFAP and EAAT2 immunostaining, in which immunoreactivity is unevenly distributed and displays a good contrast between the immunoreactive structures and the non-immunoreactive background within the cortical layers. The area fraction of immunoreactivity was quantified in three sections per subject for EAAT2, but, due to limitations in the availability of material for a few subjects, we analyzed area fraction for GFAP in only one section per subject. For EAAT1 and GS the pattern of immunostaining was diffuse and highly uniform across the neuropil. At high magnification, EAAT1 and GS immunoreactivity had a particulate appearance with lower density of immunoreactive particles in layer I. In these cases the area fraction could not be reliably measured to reveal differences between the diagnostic groups (slight changes in the intensity in the specific staining would not result in changes in area fraction) and only data of proteins levels quantified in Western blots are presented. In parallel experiments, absence of the primary antibody or the secondary antibody completely prevented the appearance of specific immunostaining. Likewise, preadsorption of the primary antibodies with their specific proteins resulted in absence of immunostaining.
2.4. Western blotting
Frozen sections with a thickness of 50 μm obtained from a fresh-frozen brain sample were used to obtain punches from the gray matter of area 47 that spanned from the brain surface to the border between gray and white matter. Each punch was made with a circular puncher in which care was taken to locate the edge of the punching circle at the border between gray and white matter and the rest of the punching circle encompassed all the cortical layers. Since the punch was 5 mm in diameter there was no problem in including all cortical layers so that equal proportions of all layers entered in each sample. Punches were homogenized in 0.01 M Tris–HCl containing 1% sodium dodecyl sulfate (SDS), 2 mM EDTA, and fresh protease inhibitor (Complete Mini, Roche, Basel, Switzerland). The homogenate was centrifuged at 4 °C and 12,000 g for 30 min. The supernatant was removed and stored at −80 °C until used.
Proteins from the supernatant were run by electrophoresis with the NuPAGE Bis–Tris Electrophoretic System (Invi-trogen, Carlsbad, California) using precast gels with 10% Bis–Tris, and transferred to polyvinylidene difluoride (PVDF) membranes. Membranes were incubated overnight at 4 °C with two antibodies simultaneously: one antibody to either of the proteins of interest, and the other antibody to glyceral-dehyde 3-phosphate dehydrogenase (GAPDH). GAPDH was chosen as referent due to its monomerici molecular weight (about 37 kD), appearing as a single band in the reducing conditions used in our experiments. This permitted non-overlapping simultaneous detection of GAPDH with each of the proteins of interest (approximate weighs: 45 kD for GS, 50 kD for GFAP, 62 kD for EAAT2, and 65 kD for EAAT1). Amounts of total protein used per lane in gels for each protein of interest were as follows: EAAT1-5 μg, EAAT2-2 μg, GS-1 μg, GFAP-1 μg. The following antibodies were used to probe the membranes: polyclonal guinea pig anti-EAAT1 (dilution 1:5000, Millipore, Temecula, CA), polyclonal guinea pig anti-EAAT2 (1:5000, Millipore, Temecula, CA), monoclonal mouse anti-GS (dilution 1:1000, Millipore), mouse anti-GFAP (1:1000, Millipore), monoclonal mouse anti-GAPDH (1:300, Millipore). Omission of the primary or secondary antibodies on histological sections or membranes resulted in disappearance of specific staining. Specific immunostaining was also prevented by incubating the primary antibodies with blocking peptides for each protein used in this investigation.
Western blot bands were detected using alkaline-phosphatase conjugated secondary antibodies and a chemiluminescent reaction. Samples for each subject were run in duplicate, altering the position in the gel to ensure replicability, the value of both duplicates was averaged. Levels of each protein were calculated as a ratio of the density of positive bands to the band of housekeeping protein GAPDH. In addition, in an independent experiment, we found that there was no difference between groups in the levels of GAPDH relative to another housekeeping protein, actin. The optical densities of bands for actin itself were not statistically distinguishable across gels and subjects.
Quantification of protein bands in Western blots was performed with ImageJ software using images from Kodak Image Station 440 CF with standardized parameters for all blot membranes. The amounts of homogenate delivered to gel lanes for each protein studied were calculated so that the densitometry measurements in the blots were made within the linear range of staining intensities of the chemiluminescent detection device.
2.5. Statistical analyses
For both immunohistochemistry and Western blotting, mean values of immunoreactivity and protein level, respectively, were compared among groups using analysis of covariance (ANCOVA) with age, postmortem interval, and brain tissue pH as covariates, and a significance level of p<0.05 was considered significant. Post hoc univariate pairwise analyses with the Bonferroni correction for multiple comparisons were applied, with p<0.05 considered significant. Significance of partial correlations between variables of interest was performed controlling for postmortem delay and brain pH. Error bars in the figures represent the standard error of the mean.
3. Results
3.1. Distribution and levels of EAAT2
EAAT2-like immunostaining (EAAT2-I) in sections of area 47 was uneven across the six layers of the cortex (Fig. 1A, B, C, and D). EAAT2-I was particularly abundant in layer II forming a band of strong immunoreactivity. The staining was scant in layer 1 and sparse in layers III, IV and V, where single cells or groups of cells with morphology of astrocytes were easily identifiable at high magnification (Fig. 1F). The amount of immunostaining was again higher around layer VI before dropping in the white matter. In immunostained sections, there was marked variability in the area fraction of immunostaining between individual subjects as revealed by analysis of covariance (with age, postmortem delay and pH as covariates). Area fraction of EAAT2-I was significantly different among diagnostic groups (F=5.343, p<0.005) (Fig. 1E). Bonferroni-corrected pairwise comparisons by univariate analysis showed that area fraction was significantly lower in the MDD (p=0.006) and MDA (p=0.018) groups (Fig. 1E), as compared to the control group.
Fig. 1.
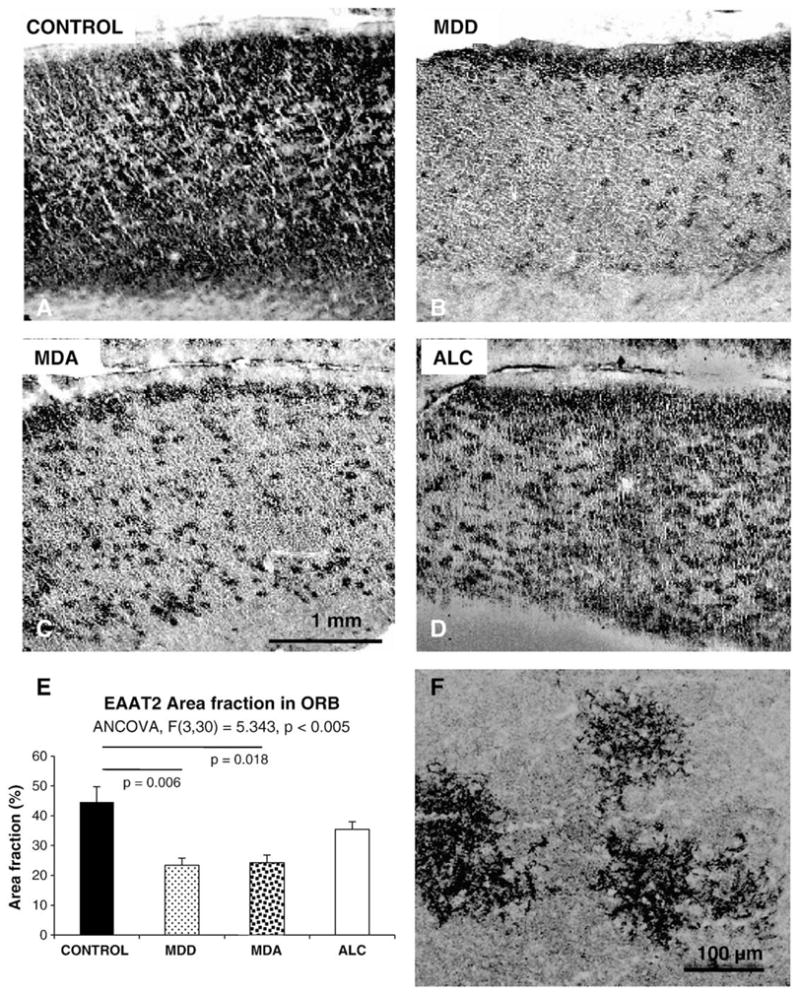
The top four panels are representative micrographs of EAAT2 immunoreactivity in the ORB of normal controls (A), MDD subjects without alcoholism (MDD) (B), MDD subjects with comorbid alcoholism (MDA) (C), and alcoholics (D). E) is a graph summarizing the results of measurements and the statistical comparisons of the area fraction of EAAT2 immunoreactivity in the same groups of subjects. F) High magnification picture of EAAT2 immunoreactive astrocytes in layer III of a control subject. Note the localization of immunoreactivity to the fine branches of astrocyte processes. MDD: Subjects with diagnosis of Major depressive disorder but not alcoholism; MDA: Subjects with comorbid diagnoses of major depressive disorder and alcoholism: ALC: Subjects with a diagnosis of alcoholism, and without diagnosis of comorbid major psychiatric disorder. Bar in C applies to A, B, C and D panels.
Levels of EAAT2 calculated from Western blots were particularly variable in controls and MDA subjects and the result of ANCOVA was not statistically significant (F(3,42)= 2.3, p=0.091), but the lowest levels were found among MDD and MDA subjects (Fig. 2A and B). Protein levels and area fraction of EAAT2 were significantly correlated when considering all subjects in the study (r=0.636, p<0.0001). However, when considering the groups separately the correlation was only significant in the control group (r=0.693, p=0.026).
Fig. 2.

Representative Western blots (A and C), and graphs (B and D) summarizing the quantification of the relative levels of EAAT2 and EAAT1 from Western blots for the four diagnostic groups in this study. Abbreviations as in Fig. 1.
3.2. Distribution and levels of EAAT1
EAAT1 immunoreactivity was more evenly distributed across cortical layers than EAAT2 or GFAP immunoreactivities. Therefore, quantification of EAAT1 in the present study was solely based on levels of EAAT1 protein determined from Western blots. EAAT1 protein levels were significantly different across groups (F(3,42)=3.682, p=0.019) (Fig. 2C and D) and pairwise comparisons revealed a significantly lower EAAT1 level in MDD and MDA as compared to the control group (MDD p=0.043, MDA p=0.038 (Fig. 2C and D).
3.3. Distribution and levels of GS
GS immunoreactivity was strong and evenly distributed in all cortical layers. Levels of GS determined from Western blots differed significantly among the four groups (F=5.685, p=0.002) (Fig. 3A and B). The highest average level of GS protein and thesmallest variance corresponded toALC subjects, which had a significantly higher GS level as compared to MDD (p=0.039) and MDA (p=0.009) subjects. The level of GS in MDA subjects was also lower than in controls (p=0.035). A significant negative correlation between the levels of GS and EAAT2 was present both in control (r=−0.663, p=0.037) and alcohol-dependent (r=−0.676, p=0.032) (ALC) subjects (Fig. 4A and B), while a non-significant trend for a negative correlation was detected in the MDD subjects (r=−0.409, p=0.165) and no correlation observed in the MDA group (r= −0.227, p=0.665). Only in the group of normal controls tendency for a positive correlation between GS and EAAT1 could be detected (r=0.618, p=0.057).
Fig. 3.
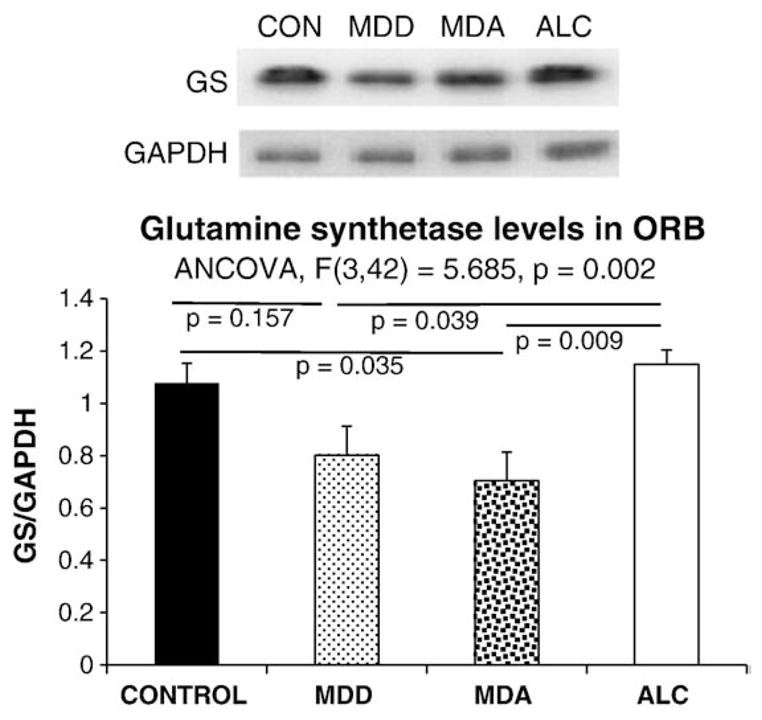
Representative Western blots (A), and graph (B) summarizing the quantification of the relative levels of glutamine synthetase (GS) from Western blots for the four diagnostic groups in this study. Abbreviations as in Fig. 1.
Fig. 4.

Scatter plots illustrating the negative correlation between levels of GS and levels of EAAT2 in control (A) and alcohol-dependent subjects (B).
3.4. Distribution and levels of GFAP
As in other prefrontal cortical areas, GFAP immunoreactivity in area 47 displayed a laminated pattern across the cortical layers (Fig. 5A, B, C, and D), being very abundant in layer I (where immunoreactive elements abut at the pial surface of the brain), and in layers II and VI. GFAP immunoreactivity was sparse in layers III, IV and V and showed considerable interindividual and intergroup variabilities. To estimate the extent of GFAP immunostaining across the cortical layers we calculated an area fraction of GFAP immunoreactivity, which mainly depends on the extent of GFAP positive astrocytic processes deemed to be immunoreactive over a non-specific background staining. Area fraction was significantly different among groups as revealed by ANCOVA (F=4.366, p=0.012) (Fig. 5E). Pairwise comparisons revealed that GFAP area fraction was significantly lower in MDD than in control (p=0.040) or ALC subjects (p=0.003) (Fig. 5E). However, values for MDA subjects were comparable to controls and were not significantly different from alcoholics.
Fig. 5.
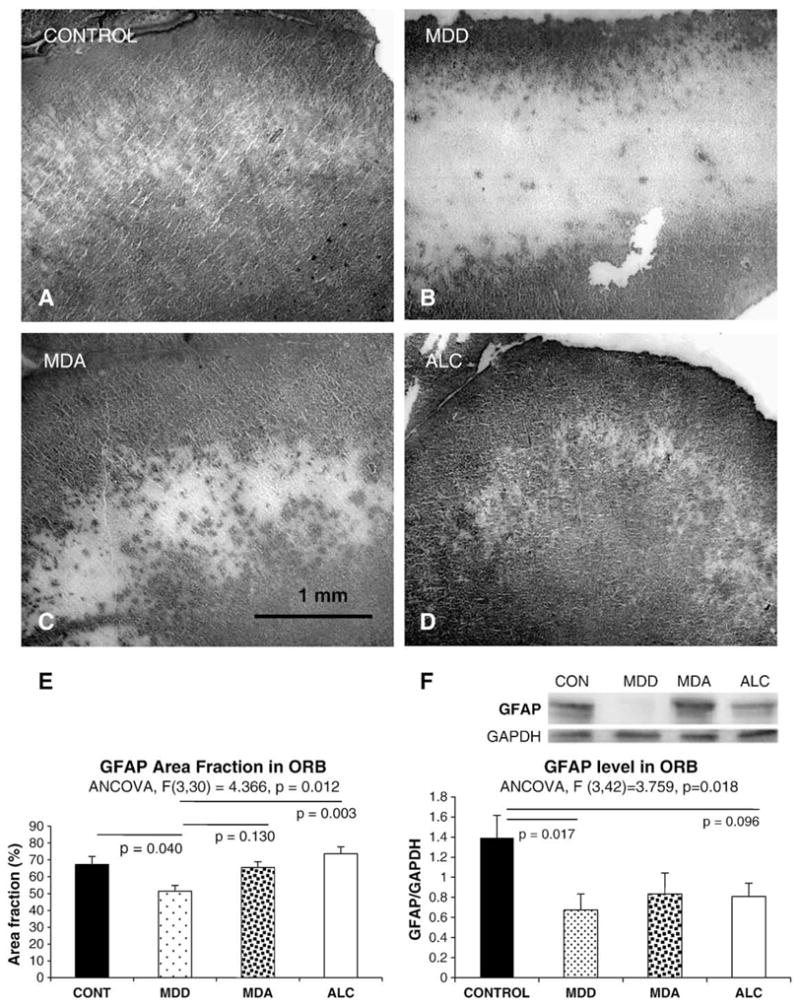
The top four panels are representative micrographs of GFAP immunoreactivity in the ORB of normal controls (A), MDD subjects without alcoholism (B), MDA subjects (C), and alcoholics (D). Panel E summarizes the results of measurements and the statistical comparisons of the area fraction of EAAT2 immunoreactivity in the same groups of subjects. Abbreviations as in Fig. 3. Panel F shows a representative Western blot for GFAP protein in the ORB and summarizes in a graph the results for GFAP levels in the four groups. Abbreviations as in Fig. 1.
Levels of GFAP in Western blots (Fig. 5F), as analyzed by ANCOVA, differed significantly among groups (F(3,42)= 3.759, p=0.018). The lowest values of GFAP levels were present in the MDD group, these levels being significantly lower as compared to controls (p=0.017), but not as compared to MDA or alcohol-dependent subjects. There was significant correlation between the area fraction of GFAP and GFAP levels (r=0.381, p=0.022) when all depressed subjects (MDD+MDA) were combined. This correlation was also significant (r=0.769, p=0.009) in MDD subjects alone, and close to significant in alcoholics (r=0.618, p=0.057), but far from statistical significance in MDA or control subjects.
4. Influence of medication, gender, duration of psychiatric disorder and age at the time of death
When subjects with MDD that had antidepressant medication detected in the postmortem toxicology screening were compared to those without antidepressant, no differences in EAAT1, EAAT2, GS or GFAP levels were detected. There were not significant differences in these parameters between male and female subjects either.
To assess the possibility of a relationship between the progress of the diagnosed disorders and the levels or area fraction of immunostaining, we also investigated whether the estimated age at onset and the duration of the disorders were correlated with the neurochemical parameters studied (partial correlations controlling for postmortem delay and brain pH). In the MDD group a late onset of depression was highly correlated with increased EAAT1 levels (r=0.869, p=0.005) (Fig. 6A). The onset of alcoholism in MDA subjects was also positively correlated with the levels of EAAT1 (r=0.903, p=0.014) (Fig. 6B). In the MDA group the levels of GS demonstrated a significant positive correlation with the duration of depression (r=0.862, p=0.027) while the levels of GFAP were negatively correlated with the duration of alcoholism (r=−0.838, p=0.037) (Fig. 6C), but not correlated with the duration of depression. In the group of alcoholics, however, there was no correlation between the duration or the onset of alcoholism and the levels or area fraction of the proteins in the study (for all correlation tests p>0.25).
Fig. 6.
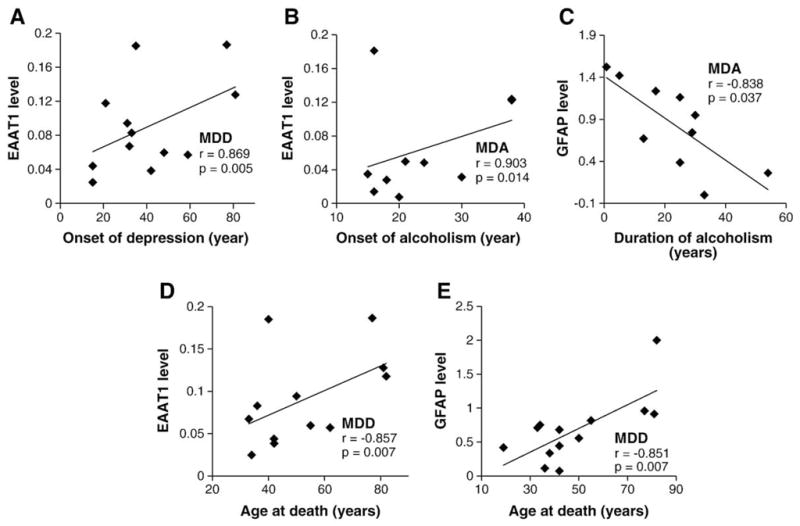
Scatter plots illustrating the correlation between onset of disorder (A and B), duration (C) or age (D and E) and the levels of EAAT1 or GFAP.
Age at the time of death was not significantly correlated with area fraction of EAAT2 in any of the groups. However, age was positively correlated with EAAT1 levels in MDD subjects (r=0.857, p=0.007) (Fig. 6D). In alcoholics and MDA subjects, age held a significant positive correlation with GFAP area fraction (r=0.672, p=0.033 for MDA subjects; r=0.808, p=0.005 for alcoholics) and in MDD subjects it was positively correlated with GFAP levels (r=0.851, p=0.007) (Fig. 6E). In contrast, a trend for a negative correlation between age and GFAP levels was also present in MDA, although it was not significant (r=−0.755, p=0.083).
5. Discussion
The present study reveals that the levels of proteins critically involved in the glutamate-processing functions of astrocytes are significantly reduced in the gray matter of area 47 of the human PFC of MDD subjects as compared to controls and alcoholics. The data obtained also support the idea that a lowered function of glutamate transport and conversion to glutamine may be occurring in the ORB in depressed subjects regardless of comorbidity with alcohol dependence, although we did not directly measure activities of these proteins. That is, despite similar reductions in glial density (Miguel-Hidalgo et al., 2006; Miguel-Hidalgo and Rajkowska, 2003), a lowered glutamatergic function of astrocytes might be mainly associated with depression and not with alcoholism. From the data presented in this study it is not possible to determine whether lower levels of glutamate transporters are a secondary adaptation to lower levels of glutamate in the PFC or if they would lead to higher concentrations of synaptic (or extracellular) glutamate. However, data derived from functional neuroimaging studies support an adaptation to low glutamate levels. For instance, magnetic-resonance-spectroscopy (MRS) studies in MDD have reported low levels of glutamate and glutamate/glutamine in the PFC (Hasler et al., 2007) or a negative correlation of duration of depression with glutamate levels (Caetano et al., 2005). Lower glutamate levels have been also found in the anterior cingulate cortex of children or adolescents diagnosed with MDD as compared to controls (Mirza et al., 2004; Rosenberg et al., 2004; Rosenberg et al., 2005). In contrast to the frontal lobe, the levels of glutamate are increased in the visual cortex in subjects with MDD (Sanacora et al., 2004). It would be interesting to determine whether the levels of glutamate transporters are increased in visual cortex in depression. However, given that it is not yet known which compartments (neurons, glia, extracellular glutamate) are mainly responsible for the altered levels of glutamate detected by MRS, the relationship of the present results and MRS signals detected in other studies remains open to interpretation.
The reduced levels of glutamate transporters and GFAP in the ORB that we have observed in depression are consistent with reports of reduced glial cell density in the PFC of MDD subjects (Cotter et al., 2001; Öngür et al., 1998; Rajkowska et al., 1999) and are in agreement with observations of reduced MRS-based myo-inositol levels (considered a marker for glial cells) in the PFC of depressed subjects (Coupland et al., 2005).
As suggested above, lower levels of glutamate transporters in the ORB may be an adaptation to reduced glutamate. However, upon stress or increased demand for neuronal signaling, glutamate release may increase and glutamate transport deficit may result in neuronal damage. This damage might be an underlying cause for reductions in neuronal sizes and densities observed in some prefrontal areas of MDD patients (33) (Cotter et al., 2002). Contribution of altered glutamate transport to the pathophysiology of depression would also be consistent with recent findings of significant improvement of depressive symptoms produced by treatment with the pharmacological agent riluzole (Sanacora et al., 2007). Riluzole modulates glutamate release (Risterucci et al., 2006) and increases glutamate uptake (Azbill et al., 2000; Frizzo et al., 2004). In animal models of neurodegeneration riluzole also prevents neuronal damage (Risterucci et al., 2006). Furthermore, in an animal model of depression-like induced behaviors by chronic unpredictable stress riluzole reverses damage to GFAP immunoreactive astrocytes and prevents behaviors that are also sensitive to treatment with other antidepressants (Banasr et al., 2008). Likewise, ceftriaxone, a beta-lactamic antibiotic that increases glutamate uptake, has antidepressant-like activity in animal models (Mineur et al., 2007).
To examine possible group differences in proteins not directly involved in the glutamatergic physiology of astrocytes this study included immunodetection of GFAP, a cytoskeletal protein of astrocytes, the level of which reflects structural or neurodegenerative changes in the tissue surrounding the astrocytes. The area fraction of GFAP and EAAT2 immunoreactivity was also included in this investigation, as the area fraction is a structural measurement that mainly reflects the spatial extent of cellular processes containing those two proteins in the tissue. The area fraction data reveal a significantly lower spatial extent of immunore-active structures for both GFAP and EAAT2 in MDD. In contrast, the area fraction of GFAP in alcoholics and depressed subjects comorbid for alcoholism (i.e. the MDA group) was similar to control values. At the same time, there was a tendency for lower levels of GFAP (as assessed in Western blots) in all three diseased groups of subjects as compared to control subjects, suggesting that in alcoholism GFAP-containing processes of astrocytes could be as extensive as those in controls (and thus the fraction, a measure of spatial extent in alcohol-dependent subjects is not different from controls), but that both alcoholism and MDD may result in lower expression of GFAP. Hence, alcoholism might be associated with plastic structural changes in the length of astrocytic processes and those changes may not develop in MDD. Clearly, more detailed studies of astrocyte morphology will be necessary to ascertain whether there are differential structural changes that distinguish alcoholism (without depressive symptoms) from MDD.
Several subjects in the groups with MDD were being treated with antidepressant medication. Thus, the lower levels of glutamate transporters and GFAP in depressed subjects could be effects of antidepressant medication, possibly contributing to the mechanism of action of anti-depressants. However, none of the MDD subjects in this study were in remission at the time of death, supporting the interpretation that it is unlikely that the glutamatergic changes observed are involved in the therapeutic action of antidepressants. Furthermore, the MDD subjects with 4 or less days of antidepressant treatment (n=6) had levels of glutamate transporters significantly lower than the alcoholic subjects without MDD or the control subjects. This group of MDD subjects with short-term or no antidepressant therapy was also statistically indistinguishable from depressed subjects with longer antidepressant treatment.
Low glial densities in the PFC are common to MDD and alcoholism. However, the present data indicate that the levels of glutamate transporters in the ORB region of the PFC in MDD subjects are significant lower than in controls, whereas the alcoholics without MDD were not different from controls. In addition, GS levels were also significantly higher in alcoholics than in MDD subjects, and (even if the average was not statistically different) consistently higher in alcoholics (lower variance) than in most of the controls. If we take into account lower overall glial cell density and lower GFAP levels in “uncomplicated” alcoholics (Korbo, 1999; Miguel-Hidalgo et al., 2002, 2006), unchanged or higher GS levels would be rather consistent with an increase in GS levels per astrocyte. Since the area fraction of GFAP immunoreactive processes is also larger in alcoholics and in MDD subjects with comorbid alcoholism than in MDD subjects, this would indicate an increased area fraction of GFAP and GS immunoreactivity per astrocyte in subjects with alcoholism, but not in depressed subjects. A putative activation of astrocytes in alcoholism involving increased GS expression might be due to the repeated exposure to alcohol or to periods of withdrawal that defines alcoholism. This possible augmentation of GS expression per astrocyte in alcoholics is supported by augmented GS immunoreactivity detected in the PFC of alcohol-consuming rats three days after withdrawal from alcohol (Miguel-Hidalgo, 2006). In this animal model, the GS immunoreactivity was significantly correlated with the amount of ethanol ingested in the days before withdrawal. Further research should determine whether the morphological plasticity and GS expression are induced more readily in chronic alcoholics despite a paradoxical association of chronic alcohol intake with low glial or astrocyte density (Korbo, 1999; Miguel-Hidalgo et al., 2002, 2006).
The alcohol-dependent subjects in this study were not diagnosed with cirrhosis. However, it cannot be ruled out that some degree of alcohol-related hepatic pathology may result in higher brain glutamine and/or GS (Sawara et al., 2004) in alcoholics. However, the relatively low levels of GS in the ORB of MDA subjects may argue against a simple liver-mediated effect of alcohol on brain GS levels. Thus, a parsimonious explanation for putative increases in GS per astrocyte and in area fraction of GFAP in alcoholics as compared to MDD subjects would be that prolonged exposure to alcohol and associated complications (like withdrawal or ethanol-induced metabolic abnormalities) result in a pattern of glial changes that is different from depression and thus associated with very different behavioral anomalies. Depression would only manifest in those alcohol-dependent subjects in whom the physiology of glutamate transport and glutamate–glutamine conversion have changed or persist with a pattern similar to that in MDD subjects. Our observation of lower levels of GS in MDD subjects is also in line with a proteomics study of the anterior cingulate cortex by Beasley et al. (Beasley et al., 2006) showing significantly lower GS in MDD subjects as compared to controls. In addition, while we observed a significant negative correlation between GS and EAAT2 levels in controls and alcoholics (ALC) there was no correlation in MDD and MDA subject, which points to similar glutamatergic disturbances in the ORB of MDA and MDD subjects.
In summary, immunohistochemical and Western blot determinations of glial glutamate transporters and glutamine synthetase suggest that there might be a reduction in the glutamate-processing capacity of astrocytes in the ORB of human subjects diagnosed with MDD. Alcoholism is often comorbid with the diagnosis of major depression and also appears to involve pathological changes in the ORB. However, the present results suggest that alcohol dependence is not necessarily associated with deficits in ORB glial glutamatergic markers, and lower levels of astrocytic glutamatergic markers would be observed in the ORB only when alcohol dependence is associated with or results in MDD.
Acknowledgments
We thank the excellent technical assistance provided by Valerie Wanzo and Victoria Lo.
Role of the funding source
Funding for this study was provided by The National Alliance for Research on Schizophrenia and Depression (NARSAD), and NIH Grants RR017701, MH60451, MH67996, and MH82297. NARSAD and the NIH had no further role in study design; in the collection, analysis and interpretation of data; in the writing of the report; and in the decision to submit the paper for publication.
Footnotes
Conflict of Interest
All authors declare that they have no conflicts of interest.
References
- Anderson CM, Swanson RA. Astrocyte glutamate transport: review of properties, regulation, and physiological functions. Glia. 2000;32:1–14. [PubMed] [Google Scholar]
- Auer DP, Putz B, Kraft E, Lipinski B, Schill J, Holsboer F. Reduced glutamate in the anterior cingulate cortex in depression: an in vivo proton magnetic resonance spectroscopy study. Biol Psychiatry. 2000;47:305–313. doi: 10.1016/s0006-3223(99)00159-6. [DOI] [PubMed] [Google Scholar]
- Azbill RD, Mu X, Springer JE. Riluzole increases high-affinity glutamate uptake in rat spinal cord synaptosomes. Brain Res. 2000;871:175–180. doi: 10.1016/s0006-8993(00)02430-6. [DOI] [PubMed] [Google Scholar]
- Banasr M, Duman RS. Glial loss in the prefrontal cortex is sufficient to induce depressive-like behaviors. Biol Psychiatry. 2008;64:863–870. doi: 10.1016/j.biopsych.2008.06.008. [DOI] [PMC free article] [PubMed] [Google Scholar]
- Banasr M, Chowdhury GM, Terwilliger R, Newton SS, Duman RS, Behar KL, Sanacora G. Glial pathology in an animal model of depression: reversal of stress-induced cellular, metabolic and behavioral deficits by the glutamate-modulating drug riluzole. Mol Psychiatry. 2008 doi: 10.1038/mp.2008.106. On line. doi. [DOI] [PMC free article] [PubMed] [Google Scholar]
- Beasley CL, Pennington K, Behan A, Wait R, Dunn MJ, Cotter D. Proteomic analysis of the anterior cingulate cortex in the major psychiatric disorders: evidence for disease-associated changes. Proteomics. 2006;6:3414–3425. doi: 10.1002/pmic.200500069. [DOI] [PubMed] [Google Scholar]
- Caetano SC, Fonseca M, Olvera RL, Nicoletti M, Hatch JP, Stanley JA, Hunter K, Lafer B, Pliszka SR, Soares JC. Proton spectroscopy study of the left dorsolateral prefrontal cortex in pediatric depressed patients. Neurosci Lett. 2005;384:321–326. doi: 10.1016/j.neulet.2005.04.099. [DOI] [PubMed] [Google Scholar]
- Choudary PV, Molnar M, Evans SJ, Tomita H, Li JZ, Vawter MP, Myers RM, Bunney WE, Jr, Akil H, Watson SJ, Jones EG. Altered cortical glutamatergic and GABAergic signal transmission with glial involvement in depression. Proc Natl Acad Sci USA. 2005;102:15653–15658. doi: 10.1073/pnas.0507901102. [DOI] [PMC free article] [PubMed] [Google Scholar]
- Chowdhury GM, Banasr M, de Graaf RA, Rothman DL, Behar KL, Sanacora G. Chronic riluzole treatment increases glucose metabolism in rat prefrontal cortex and hippocampus. J Cereb Blood Flow Metab. 2008;28:1892–1897. doi: 10.1038/jcbfm.2008.78. [DOI] [PMC free article] [PubMed] [Google Scholar]
- Cotter D, Mackay D, Landau S, Kerwin R, Everall I. Reduced glial cell density and neuronal size in the anterior cingulate cortex in major depressive disorder. Arch Gen Psychiatry. 2001;58:545–553. doi: 10.1001/archpsyc.58.6.545. [DOI] [PubMed] [Google Scholar]
- Cotter D, Mackay D, Chana G, Beasley C, Landau S, Everall IP. Reduced neuronal size and glial cell density in area 9 of the dorsolateral prefrontal cortex in subjects with major depressive disorder. Cereb Cortex. 2002;12:386–394. doi: 10.1093/cercor/12.4.386. [DOI] [PubMed] [Google Scholar]
- Coupland NJ, Ogilvie CJ, Hegadoren KM, Seres P, Hanstock CC, Allen PS. Decreased prefrontal Myo-inositol inmajor depressive disorder. Biol Psychiatry. 2005;57:1526–1534. doi: 10.1016/j.biopsych.2005.02.027. [DOI] [PubMed] [Google Scholar]
- Crews FT, Collins MA, Dlugos C, Littleton J, Wilkins L, Neafsey EJ, Pentney R, Snell LD, Tabakoff B, Zou J, Noronha A. Alcohol-induced neurodegeneration: when, where and why? Alcohol Clin Exp Res. 2004;28:350–364. doi: 10.1097/01.alc.0000113416.65546.01. [DOI] [PubMed] [Google Scholar]
- Davies DL, Vernadakis A. Effects of ethanol on cultured glial cells: proliferation and glutamine synthetase activity. Brain Res. 1984;318:27–35. doi: 10.1016/0165-3806(84)90059-2. [DOI] [PubMed] [Google Scholar]
- Davis KM, Wu JY. Role of glutamatergic and GABAergic systems in alcoholism. J Biomed Sci. 2001;8:7–19. doi: 10.1007/BF02255966. [DOI] [PubMed] [Google Scholar]
- Davis S, Thomas A, Perry R, Oakley A, Kalaria RN, O’Brien JT. Glial fibrillary acidic protein in late life major depressive disorder: an immunocytochemical study. J Neurol Neurosurg Psychiatry. 2002;73:556–560. doi: 10.1136/jnnp.73.5.556. [DOI] [PMC free article] [PubMed] [Google Scholar]
- Duvernoy HM, Delon S, Vannson JL. Cortical blood vessels of the human brain. Brain Res Bull. 1981;7:519–579. doi: 10.1016/0361-9230(81)90007-1. [DOI] [PubMed] [Google Scholar]
- Evrard SG, Duhalde-Vega M, Tagliaferro P, Mirochnic S, Caltana LR, Brusco A. A low chronic ethanol exposure induces morphological changes in the adolescent rat brain that are not fully recovered even after a long abstinence: an immunohistochemical study. Exp Neurol. 2006;200:438–459. doi: 10.1016/j.expneurol.2006.03.001. [DOI] [PubMed] [Google Scholar]
- Flatscher-Bader T, Wilce PA. Impact of alcohol abuse on protein expression of midkine and excitatory amino acid transporter 1 in the human prefrontal cortex. Alcohol Clin Exp Res. 2008;32:1849–1858. doi: 10.1111/j.1530-0277.2008.00754.x. [DOI] [PubMed] [Google Scholar]
- Flatscher-Bader T, van der Brug M, Hwang JW, Gochee PA, Matsumoto I, Niwa S, Wilce PA. Alcohol-responsive genes in the frontal cortex and nucleus accumbens of human alcoholics. J Neurochem. 2005;93:359–370. doi: 10.1111/j.1471-4159.2004.03021.x. [DOI] [PubMed] [Google Scholar]
- Franke H, Kittner H, Berger P, Wirkner K, Schramek J. The reaction of astrocytes and neurons in the hippocampus of adult rats during chronic ethanol treatment and correlations to behavioral impairments. Alcohol. 1997;14:445–454. doi: 10.1016/s0741-8329(96)00209-1. [DOI] [PubMed] [Google Scholar]
- Freund G, Anderson KJ. Glutamate receptors in the frontal cortex of alcoholics. Alcohol Clin Exp Res. 1996;20:1165–1172. doi: 10.1111/j.1530-0277.1996.tb01106.x. [DOI] [PubMed] [Google Scholar]
- Frizzo ME, Dall’Onder LP, Dalcin KB, Souza DO. Riluzole enhances glutamate uptake in rat astrocyte cultures. Cell Mol Neurobiol. 2004;24:123–128. doi: 10.1023/B:CEMN.0000012717.37839.07. [DOI] [PMC free article] [PubMed] [Google Scholar]
- Guerri C, Renau-Piqueras J. Alcohol, astroglia, and brain development. Mol Neurobiol. 1997;15:65–81. doi: 10.1007/BF02740616. [DOI] [PubMed] [Google Scholar]
- Hasler G, van der Veen JW, Tumonis T, Meyers N, Shen J, Drevets WC. Reduced prefrontal glutamate/glutamine and gamma-aminobutyric acid levels in major depression determined using proton magnetic resonance spectroscopy. Arch Gen Psychiatry. 2007;64:193–200. doi: 10.1001/archpsyc.64.2.193. [DOI] [PubMed] [Google Scholar]
- Hertz L, Dringen R, Schousboe A, Robinson SR. Astrocytes: glutamate producers for neurons. J Neurosci Res. 1999;57:417–428. [PubMed] [Google Scholar]
- Johnston-Wilson NL, Sims CD, Hofmann JP, Anderson L, Shore AD, Torrey EF, Yolken RH. Disease-specific alterations in frontal cortex brain proteins in schizophrenia, bipolar disorder, and major depressive disorder. The Stanley Neuropathology Consortium. Mol Psychiatry. 2000;5:142–149. doi: 10.1038/sj.mp.4000696. [DOI] [PubMed] [Google Scholar]
- Kang HJ, Adams DH, Simen A, Simen BB, Rajkowska G, Stockmeier CA, Overholser JC, Meltzer HY, Jurjus GJ, Konick LC, Newton SS, Duman RS. Gene expression profiling in postmortem prefrontal cortex of major depressive disorder. J Neurosci. 2007;27:13329–13340. doi: 10.1523/JNEUROSCI.4083-07.2007. [DOI] [PMC free article] [PubMed] [Google Scholar]
- Korbo L. Glial cell loss in the hippocampus of alcoholics. Alcohol Clin Exp Res. 1999;23:164–168. [PubMed] [Google Scholar]
- Krystal JH, Petrakis IL, Mason G, Trevisan L, D’Souza DC. N-methyl-D-aspartate glutamate receptors and alcoholism: reward, dependence, treatment, and vulnerability. Pharmacol Ther. 2003;99:79–94. doi: 10.1016/s0163-7258(03)00054-8. [DOI] [PubMed] [Google Scholar]
- Lewohl JM, Wang L, Miles MF, Zhang L, Dodd PR, Harris RA. Gene expression in human alcoholism: microarray analysis of frontal cortex. Alcohol Clin Exp Res. 2000;24:1873–1882. [PubMed] [Google Scholar]
- Lewohl JM, Wixey J, Harper CG, Dodd PR. Expression of MBP, PLP, MAG, CNP, and GFAP in the human alcoholic brain. Alcohol Clin Exp Res. 2005;29:1698–1705. doi: 10.1097/01.alc.0000179406.98868.59. [DOI] [PubMed] [Google Scholar]
- Matsuda-Matsumoto H, Iwazaki T, Kashem MA, Harper C, Matsumoto I. Differential protein expression profiles in the hippocampus of human alcoholics. Neurochem Int. 2007;51:370–376. doi: 10.1016/j.neuint.2007.04.001. [DOI] [PubMed] [Google Scholar]
- Miguel-Hidalgo JJ. Lower packing density of glial fibrillary acidic protein-immunoreactive astrocytes in the prelimbic cortex of alcohol-naive and alcohol-drinking alcohol-preferring rats as compared with alcohol-nonpreferring and Wistar rats. Alcohol Clin Exp Res. 2005;29:766–772. doi: 10.1097/01.alc.0000164378.92680.fa. [DOI] [PMC free article] [PubMed] [Google Scholar]
- Miguel-Hidalgo JJ. Withdrawal from free-choice ethanol consumption results in increased packing density of glutamine synthetase-immunoreactive astrocytes in the prelimbic cortex of alcohol-preferring rats. Alcohol Alcohol. 2006;41:379–385. doi: 10.1093/alcalc/agl006. [DOI] [PMC free article] [PubMed] [Google Scholar]
- Miguel-Hidalgo JJ. Neuropathology of depression, alcoholism, and their comorbidity in the human prefrontal cortex. In: Sher L, editor. Comorbidity of Depression and Alcohol Use Disorders. Nova Science Publishers, Inc; New York: 2009. pp. 171–179. [Google Scholar]
- Miguel-Hidalgo JJ, Rajkowska G. Comparison of prefrontal cell pathology between depression and alcohol dependence. J Psychiatr Res. 2003;37:411–420. doi: 10.1016/s0022-3956(03)00049-9. [DOI] [PMC free article] [PubMed] [Google Scholar]
- Miguel-Hidalgo JJ, Baucom C, Dilley G, Overholser JC, Meltzer HY, Stockmeier CA, Rajkowska G. GFAP-immunoreactivity in the prefrontal cortex distinguishes younger from older adults in major depressive disorder. Biol Psychiatry. 2000;48:860–872. doi: 10.1016/s0006-3223(00)00999-9. [DOI] [PubMed] [Google Scholar]
- Miguel-Hidalgo JJ, Wei J, Andrew M, Overholser JC, Jurjus G, Stockmeier CA, Rajkowska G. Glia pathology in the prefrontal cortex in alcohol dependence with and without depressive symptoms. Biol Psychiatry. 2002;52:1121–1133. doi: 10.1016/s0006-3223(02)01439-7. [DOI] [PMC free article] [PubMed] [Google Scholar]
- Miguel-Hidalgo JJ, Overholser J, Meltzer H, Stockmeier C, Rajkowska G. Reduced glial and neuronal packing density in the orbitofrontal cortex in alcohol dependence and its relationship to suicide and duration of alcohol dependence. Alcohol Clin Exp Res. 2006;30:1845–1855. doi: 10.1111/j.1530-0277.2006.00221.x. [DOI] [PMC free article] [PubMed] [Google Scholar]
- Mineur YS, Picciotto MR, Sanacora G. Antidepressant-like effects of ceftriaxone in male C57BL/6 J mice. Biol Psychiatry. 2007;61:250–252. doi: 10.1016/j.biopsych.2006.04.037. [DOI] [PubMed] [Google Scholar]
- Mirza Y, Tang J, Russell A, Banerjee SP, Bhandari R, Ivey J, Rose M, Moore GJ, Rosenberg DR. Reduced anterior cingulate cortex glutamatergic concentrations in childhood major depression. J Am Acad Child Adolesc Psychiatry. 2004;43:341–348. doi: 10.1097/00004583-200403000-00017. [DOI] [PubMed] [Google Scholar]
- Nurnberger JI, Jr, Foroud T, Flury L, Meyer ET, Wiegand R. Is there a genetic relationship between alcoholism and depression? Alcohol Res Health. 2002;26:233–240. [PMC free article] [PubMed] [Google Scholar]
- Öngür D, Drevets WC, Price JL. Glial reduction in the subgenual prefrontal cortex in mood disorders. Proc Natl Acad Sci USA. 1998;95:13290–13295. doi: 10.1073/pnas.95.22.13290. [DOI] [PMC free article] [PubMed] [Google Scholar]
- Paul IA, Skolnick P. Glutamate and depression: clinical and preclinical studies. Ann NY Acad Sci. 2003;1003:250–272. doi: 10.1196/annals.1300.016. [DOI] [PubMed] [Google Scholar]
- Petrakis IL, Gonzalez G, Rosenheck R, Krystal JH. Comorbidity of alcoholism and psychiatric disorders. An overview. Alcohol Res Health. 2002;26:81–89. [Google Scholar]
- Rajkowska G, Goldman-Rakic PS. Cytoarchitectonic definition of prefrontal areas in the normal human cortex: II. Variability in locations of areas 9 and 46. Cereb Cortex. 1995;4:323–337. doi: 10.1093/cercor/5.4.323. [DOI] [PubMed] [Google Scholar]
- Rajkowska G, Miguel-Hidalgo JJ, Wei J, Dilley G, Pittman SD, Meltzer HY, Overholser JC, Roth BL, Stockmeier CA. Morphometric evidence for neuronal and glial prefrontal cell pathology in major depression. Biol Psychiatry. 1999;45:1085–1098. doi: 10.1016/s0006-3223(99)00041-4. [DOI] [PubMed] [Google Scholar]
- Risterucci C, Coccurello R, Banasr M, Stutzmann JM, Amalric M, Nieoullon A. The metabotropic glutamate receptor subtype 5 antagonist MPEP and the Na+ channel blocker riluzole show different neuroprotective profiles in reversing behavioral deficits induced by excitotoxic prefrontal cortex lesions. Neuroscience. 2006;137:211–220. doi: 10.1016/j.neuroscience.2005.08.054. [DOI] [PubMed] [Google Scholar]
- Rosenberg DR, Mirza Y, Russell A, Tang J, Smith JM, Banerjee SP, Bhandari R, Rose M, Ivey J, Boyd C, Moore GJ. Reduced anterior cingulate glutamatergic concentrations in childhood OCD and major depression versus healthy controls. J Am Acad Child Adolesc Psychiatry. 2004;43:1146–1153. doi: 10.1097/01.chi.0000132812.44664.2d. [DOI] [PubMed] [Google Scholar]
- Rosenberg DR, Macmaster FP, Mirza Y, Smith JM, Easter PC, Banerjee SP, Bhandari R, Boyd C, Lynch M, Rose M, Ivey J, Villafuerte RA, Moore GJ, Renshaw P. Reduced anterior cingulate glutamate in pediatric major depression: a magnetic resonance spectroscopy study. Biol Psychiatry. 2005;58:700–704. doi: 10.1016/j.biopsych.2005.05.007. [DOI] [PubMed] [Google Scholar]
- Sanacora G, Gueorguieva R, Epperson CN, Wu YT, Appel M, Rothman DL, Krystal JH, Mason GF. Subtype-specific alterations of gamma-aminobutyric acid and glutamate in patients with major depression. Arch Gen Psychiatry. 2004;61:705–713. doi: 10.1001/archpsyc.61.7.705. [DOI] [PubMed] [Google Scholar]
- Sanacora G, Kendell SF, Levin Y, Simen AA, Fenton LR, Coric V, Krystal JH. Preliminary evidence of riluzole efficacy in antidepressant-treated patients with residual depressive symptoms. Biol Psychiatry. 2007;61:822–825. doi: 10.1016/j.biopsych.2006.08.037. [DOI] [PMC free article] [PubMed] [Google Scholar]
- Sawara K, Kato A, Yoshioka Y, Suzuki K. Brain glutamine and glutamate levels in patients with liver cirrhosis: assessed by 3.0-T MRS. Hepatol Res. 2004;30:18–23. doi: 10.1016/j.hepres.2004.03.013. [DOI] [PubMed] [Google Scholar]
- Si X, Miguel-Hidalgo JJ, O’Dwyer G, Stockmeier CA, Rajkowska G. Age-dependent reductions in the level of glial fibrillary acidic protein in the prefrontal cortex in major depression. Neuropsychopharmacology. 2004;29:2088–2096. doi: 10.1038/sj.npp.1300525. [DOI] [PMC free article] [PubMed] [Google Scholar]
- Snyder A. Responses of glia to alcohol. In: Aschner N, Kimelberg H, editors. The Role of Glia in Neurotoxicity. CRC Press; Boca Raton: 1996. pp. 111–135. [Google Scholar]
- Toro CT, Hallak JE, Dunham JS, Deakin JF. Glial fibrillary acidic protein and glutamine synthetase in subregions of prefrontal cortex in schizophrenia and mood disorder. Neurosci Lett. 2006;404:276–281. doi: 10.1016/j.neulet.2006.05.067. [DOI] [PubMed] [Google Scholar]
- Tsai G. Glutamatergic neurotransmission in alcoholism. J Biomed Sci. 1998;5:309–320. doi: 10.1007/BF02253441. [DOI] [PubMed] [Google Scholar]
- Tsai G, Coyle JT. The role of glutamatergic neurotransmission in the pathophysiology of alcoholism. Annu Rev Med. 1998;49:173–184. doi: 10.1146/annurev.med.49.1.173. [DOI] [PubMed] [Google Scholar]
- Volkow ND, Li TK. Drug addiction: the neurobiology of behaviour gone awry. Nat Rev Neurosci. 2004;5:963–970. doi: 10.1038/nrn1539. [DOI] [PubMed] [Google Scholar]
- Williams W, Reimold M, Kerich M, Hommer D, Bauer M, Heinz A. Glucose utilization in the medial prefrontal cortex correlates with serotonin turnover rate and clinical depression in alcoholics. Psychiatry Res. 2004;132:219–224. doi: 10.1016/j.pscychresns.2004.07.004. [DOI] [PubMed] [Google Scholar]
- Worst TJ, Vrana KE. Alcohol and gene expression in the central nervous system. Alcohol Alcohol. 2005;40:63–75. doi: 10.1093/alcalc/agh119. [DOI] [PubMed] [Google Scholar]
- Zink M, Schmitt A, Vengeliene V, Henn FA, Spanagel R. Ethanol induces expression of the glutamate transporters EAAT1 and EAAT2 in organotypic cortical slice cultures. Alcohol Clin Exp Res. 2004;28:1752–1757. doi: 10.1097/01.alc.0000145810.12545.b3. [DOI] [PubMed] [Google Scholar]