

Abstract
Investigations into the physiological mechanisms of sleep control require an animal psychomotor vigilance task (PVT) with fast response times (<300ms). Rats provide a good PVT model since whisker stimulation produces a rapid and robust cortical evoked response, and animals can be trained to lick following stimulation. Our prior experiments used deprivation-based approaches to maximize motivation for operant conditioned responses. However, deprivation can influence physiological and neurobehavioral effects. In order to maintain motivation without water deprivation, we conditioned rats for immobilization and head restraint, then trained them to lick for a 10% sucrose solution in response to whisker stimulation. After approximately 8 training sessions, animals produced greater than 80% correct hits to the stimulus. Over the course of training, reaction times became faster and correct hits increased. Performance in the PVT was examined after 3, 6 and 12 hours of sleep deprivation achieved by gentle handling. A significant decrease in percent correct hits occurred following 6 and 12 hours of sleep deprivation and reaction times increased significantly following 12 hours of sleep deprivation. While behaviorally the animals appeared to be awake, we observed significant increases in EEG delta power prior to misses. The rat PVT with fast response times allows investigation of sleep deprivation effects, time on task and pharmacological agents. Fast response times also allow closer parallel studies to ongoing human protocols.
Keywords: PVT, restraint, conditioned learning, lick, somatosensory cortex, electrophysiology, sleep deprivation, reaction time
Introduction
Human performance in operational tasks depends on the amount of prior sleep and time spent on the task [60]. An understanding of the physiological mechanisms that underlie performance deficits will provide methods to both predict and enhance performance. In order to study the neural responses during performance deficits, an animal model is required that allows manipulation of sleep and vigilance as well as basic neural recordings, and testing with pharmacological agents.
The psychomotor vigilance task (PVT) is widely used to test simple reaction times (RT). Since the task is simple, it is relatively easy to maintain motivation and provides a large amount of data in a relatively short time [33]. The PVT is also practical and reliable such that after an initial learning period, no additional learning over repeated trials is needed. The primary measures collected include reaction time and number of lapses or misses. Compared to other neurobehavioral tests, the PVT is most sensitive to sleep restriction [21, 33]. Other methods include The Walter Reed performance assessment battery [55], 5-choice reaction time task [7, 19, 46] and 2-choice reaction time task [50]. Signal detection theory (SDT) also provides tools to assess behavioral measures of performance [32, 52, 53].
Selection of the Discriminitive Stimulus
Since rats use their whiskers to explore and build spatial representations of the surrounding environment, the rat whisker-to-barrel cortex pathway serves as an ideal model system for investigating the mechanisms of sensory information processing. The spatial layout of the whiskers consists of a matrix of mystacial vibrissa (5 rows × 5–9 columns) and provides a topographical map between the whiskers and a highly organized section of the somatosensory cortex referred to as the barrel cortex. Each cortical barrel corresponds to an individual whisker on the contralateral side of the rats face [17, 40, 64]. Whisker stimulation provides a rapid and robust evoked-cortical response. Many aspects of the barrel cortex system have been studied such as the dynamics of signal processing [2–4, 35, 63], plasticity [23, 27, 31, 38, 49, 62] and behavioral studies including texture discrimination and object localization [1, 4, 29, 39, 41, 59]. Additional behavioral models using whisker stimulation will aid in the understanding and investigation of sensory mechanisms. The present study utilizes the rat’s whisker as a stimulus that will, once the appropriate training has occurred (see below), guide behavior in the PVT.
Selection of the Conditioned Response
Many studies have investigated reaction times of freely moving animals, but with significantly slower reaction times, and limits to selective and precise stimulation [13, 25, 50]. In the present study, licking was chosen as the response that would ultimately be paired with whisker stimulation in an instrumental manner because it provides a cognitive response as opposed to the eye blink which is traditionally considered a classical conditioned response [54]. The eye blink is an involuntary reflex where licking is a voluntary or operant behavior. Other cognitive operant behaviors have been used. For example, lever pressing with licking behavior under restrained conditions can be paired with whisker stimulation [24, 28, 61]. Nose poking has also been used, but doesn't allow for detailed whisker stimulation and fast reaction times [13, 20]. Licking provides reaction times as fast as 100ms and can be performed under total body and head restraint, a condition needed if brain imaging or intracellular recordings are performed.
Importance of Restrained Conditions
Many conditioned learning paradigms allow for freely moving animals [13, 25, 50] but reaction times are relatively slow. Restraint is needed to perform detailed whisker twitching with fast response times. Other studies have employed restraint methods such as a hanging hammock, or a rigid restraint chamber to record evoked potentials paired with an aversive stimuli (shock by an electric current to the tail or ear) or other neural activity [8, 24, 26, 38, 51, 66]. Disadvantages of the hammock include the possibility of swinging motions which may disrupt intra-cranial pressure and introduce noise into the recording. Additionally, circulation may be reduced in the limbs since they hang down through holes of the hammock. The rigid restraint chamber has restricted space so movement by the animal can cause unwanted tension on the head stage by twisting of the recording cables if the head is not fixed. Our studies previously tested different methods of restraint and found the wrap to be the most comfortable method, exhibiting fewer bad behaviors [56]. Head fixation has many advantages including the ability to perform precisely timed whisker stimulation that is time-locked to an event such as licking and recording the neuronal activity related to this behavior. The animal is unable to explore the setup and is therefore forced to focus on the task at hand, allowing for a large amount of trials in a short time period (i.e., >100 in 25 min).
Selection of Reinforcer
Food and/or fluid deprivation is a common laboratory procedure used to increase motivation for obtaining a reward [8, 12, 13, 19, 24, 56]. However, dietary restriction has several physiological and neurobehavioral effects. Chronic food restriction in rats augments the rewarding and motor-activating effects of many drugs of abuse [6, 9–11]. Our studies have previously employed a fluid restriction model to increase motivation for water reward but responses were not consistent [56]. Restriction-based training regimens are problematic because performance drops significantly in the second half of the session suggesting that they may have reached satiation and therefore water may not have been reinforcing enough to maintain operant behavior for the duration of the session. Our current rat PVT model uses positive reinforcement under ad libitum conditions instead of a deprivation based approach. The current model is easier to implement because the investigator does not need to regulate or monitor food/water intake by the animals. Positive reinforcement involves the presentation of something pleasurable immediately following a response and makes the behavior more likely to occur in the future. We chose a sucrose solution as the reinforcer because preference and consumption remains high over a wide range of concentrations (i.e., 0.5–20%) [18, 19]. Sucrose maintains operant behavior in ad libitum fed rats without the need for deprivation [19, 50]. Rats will eagerly consume palatable solutions available in limited access when maintained on a bland diet such as lab chow [47].
Animal Training
In order to track progress through the various training stages, a quantitative method is needed to assess performance and tolerance for the experimental conditions. We used an ethogram procedure to record distinct behaviors engaged by the animals, quantify the behavior while in the wrap, and track the level of tolerance to immobilization [56]. This allowed for the selection of animals with desired behaviors for the conditioned learning paradigm. Depending on how well the trainer interacted with the animals, approximately 15–20% of the animals did not cooperate and were used in other experiments that did not require restraint but were more social due to the daily handling.
Physiological Studies
The underlying mechanisms involved in the processing of sensory information during different behavioral situations can be understood by recording evoked response potentials (ERPs) from the barrel cortex of an un-anesthetized rat. Since the cortical ERP is both state and context dependent, various components within the ERP can be used to assess levels of neural activity and processing [43]. Conditioned stimulation during different learning tasks also induces changes in electrical activity [27, 31, 36, 38, 56]. The size and shape of evoked potentials can aid in determining what drives plasticity in the cortex during information processing from external stimuli. In particular, electroencephalographic (EEG) brain activity and PVT performance collected simultaneously can provide a powerful tool to explore the spatial and temporal patterns of the cortex involved with conditioned learning [13]. Sustained attention is the ability to direct attention and focus cognitive activity on rare or unpredictably occurring stimuli over time. Data interpreted in terms of sustained attention include lapses, false alarms, correct hits/responses, etc. which show signs of vigilance decrements. Activation of cortical areas in the right hemisphere occurs during sustained attention and can decrease as time on task increases [14, 48]. Markers within the EEG/ERP can tell us about the state of the animal and possibly the local state of the tissue.
The objective of this study was to establish a low stress, non-deprivation based method to train rats to lick in response to an individual whisker twitch while simultaneously collecting cortical brain activity with electrocorticography (ECoG) arrays, specifically in the whisker barrels. In order to test the effects of conditions that should affect performance, we examined 3, 6, and 12 hours of sleep deprivation using the proposed model of the rat PVT. With this method, we can relate PVT performance to cortical activity under a variety of conditions.
Methods
Animals
Female Sprague-Dawley rats (Simonsen Laboratories, Gilroy, California, USA, n=4) weighing 240–280 grams on arrival were used in this study. Animals were pair-housed in a temperature- and humidity-controlled vivarium maintained on a 12 hour light/dark cycle (lights on at 7 am) and then single housed post-surgery. All procedures were in accordance with the “Guide for the Care and Use of Laboratory Animals” and were approved by the Washington State University Animal Care and Use Committee. Food and water were available ad libitum.
Wrap Restraint Training
Rats were trained to suppress movement while immobilized by wrapping them in a custom-designed straight-jacket type wrap [56]. The wrap was made from denim fabric and Velcro was used to hold it together tightly around the rat’s body (Figure 1). The use of Velcro made it possible to adjust for different sized rats, allowing for a tighter fit to prevent body movement. An internal “collar” at the top of the wrap provided a tight fit around the neck and restricted/limited head movement (Figure 1A). The rat was initially wrapped in a piece of felt before being placed in the wrap to allow for more comfortable conditions. The felt was folded over the rat’s front paws to prevent the rat from getting them out while in the wrap. The animal’s progress during the restraint training protocol was measured using an ethogram procedure developed in our lab [56]. Behaviors elicited by the rats under restraint were recorded every 30 seconds and categorized as good or bad. Bad behaviors included chattering, vocalizations, fluid excretions, and movements while good behavior involved the animal remaining calm. The ethogram was also a useful means to standardize behavior and training across different personnel. Good and bad behaviors were totaled to obtain a percentage of good behavior. Training started with 3–5 days of handling before introducing the wrap. Animals were placed in the wrap for 5 minutes on the first day and increased in 5–10 minute increments daily, as long as the animal didn’t show signs of distress, such as body movements, tearing, chattering, etc. Training lasted for approximately 7 weeks to ensure that the animals would behave well with the additional head restraint in the licking setup. The whiskers were gently stroked during the last 2 weeks to accustom the rat to whisker stimulation.
Figure 1.

Two pictures show an animal in our custom designed wrap during different stages of wrapping. A) The rat was first wrapped in felt, covering the front paws with Velcro forming the internal collar around the neck to restrict/limit head movement. B) Denim fabric was wrapped around the rat and secured with Velcro to prevent body movements.
Surgical procedures
Animals were anesthetized for chronic implantation using isoflurane (5% for induction and 2.3–2.6% for maintenance). EKG and respiration were monitored using subcutaneous pin electrodes and body temperature was maintained using a heating pad. Eye ointment was placed over the eyes and a lactated ringer solution was administered subcutaneously to prevent dehydration. EEG screw electrodes were placed in the frontal and parietal cortices and two ground reference screws were placed 1 mm lateral and 1 mm caudal to the lambda-midline intersection. Two multi-stranded stainless steel wires were inserted bilaterally into the neck muscles and subcutaneously on either side of the lower rib cage to record muscle activity (EMG) and heart rate (EKG), respectively. The somatosensory cortex was exposed by performing a unilateral craniotomy over the right hemisphere. A 64 (8 × 8) channel electrode array (5 × 5 mm in size with individual electrode diameters of 250 µm, spaced 400 µm apart) designed in our laboratory was placed over intact dura (Figure 2) [56]. The array was constructed from black acetal material by drilling 250 µm holes with a computer controlled mill, then inserting stainless steel wires into the holes. The face of the array was polished flat and then the wires were soldered to an 8 × 8 pin header connector with 1.25 mm spacing. The array and wires were attached to the skull using dental acrylic. A short piece of square hollow aluminum was attached to the dental acrylic posterior to the array connectors to aid in head restraint during whisker stimulation. Flunixin (1.1mg/kg) and penicillin (10,000 ui/kg) were injected after the surgery and the animals were allowed 1 week for recovery before training resumed.
Figure 2.

A schematic of electrode placement shows the 64 channel array used to map the somatosensory cortex. The skull was removed over the right hemisphere to implant the 64 (8 × 8) channel electrode array over the intact dura. Stainless steel screws were used to record frontal and parietal EEG with two additional screws behind lamda serving as a ground reference. Two stainless steel wires were guided under the skin across the rib cage to record EKG and two wires in the neck muscles recorded EMG activity.
Whisker mapping and electrophysiological recording procedures
After recovery from surgery, animals were re-familiarized with the wraps and introduced to the recording setup. Whisker stimulation began once the animals were calm while wrapped in the setup. We developed a solenoid whisker stimulator using a hooked steel wire coupled to a permanent magnet to perform whisker stimulation. The stimulator was placed 5–10 mm from the whisker base and deflected by 1–2 mm in 2 ms. The stimulator allowed controlled deflection of the desired whisker without trimming the surrounding whiskers or permanently attaching the whisker to the stimulator. White noise was produced on a computer by connecting the sound card output to an amplified speaker (10 watt) and directing a random number generator to the sound card DSP input. The white noise started at 50 dB and was gradually increased to 80 dB on subsequent days to allow the animals to become accustomed to the noise and to mask any possible noise produced by the stimulator [51].
In order to identify the cortical column corresponding to the stimulated whisker, the barrel cortex was mapped with high spatial and temporal resolution [56]. The location of each whisker barrel on the array was mapped by averaging 50–60 stimuli at a 1 to 2s inter-stimulus interval (ISI) for each whisker and generating a 3D surface map of the electrical potentials. The peak amplitude in the map provided the channel that correlated with the location of the whisker barrel associated to the stimulated whisker. Any whisker with a clearly mapped evoked response could be used as the reward whisker for the licking paradigm. Up to four separate whiskers with well defined mapped responses could be used as a stimulus (e.g. control) but for the purposes of the present study only one whisker was used. Whisker barrel mapping experiments occurred once a day for approximately 2–3 weeks. The EEG, EMG and EKG were sampled by a custom data system [42] at a rate of 20 kHz, amplified by a factor of 1000, and filtered between 0.1 Hz and 3.2 kHz.
PVT training
We initiated lick training once the reward whisker was selected. A 10% sucrose solution was used as the reinforcer and was given to the animals in their home cage 3–5 days prior to exposure in the recording setup shown in Figure 3. Rats are reluctant to ingest unfamiliar or novel food and have an innate fear of doing so (i.e., are neophobic) due to the possible fatal consequences [34, 44]. Introducing the sucrose solution in the home cage prior to delivery in the recording setup helped overcome this phenomenon. The first day allowed the animal free access to the sucrose solution while restrained in the setup. A fluid solenoid delivered the sucrose solution through a tube placed in front of the animal’s mouth at a rate of 100 µl every 1–3 seconds. Licking was measured using a force transducer (model #FT03E, Grass Instruments, West Warwick, RI) that detected any movement on the sipper tube caused by the rat’s tongue. A light located 2 cm above the sipper tube was illuminated when the fluid was available as another signal to train the animals to lick. For some animals, the sipper tube was placed in contact with the animal's mouth to show that the sucrose solution was available. On day two, the reward whisker was stimulated at the same time as the fluid delivery to begin the association, after which the animals were required to respond within two seconds of the stimulus to receive the sucrose solution. Then, for approximately 5 sessions, the ISI was slowly increased from 2 – 4 s to a maximum ISI of 8 – 16 s once the animals made 5 consecutive correct hits. During the initial training sessions, if the animals started to struggle, an experimenter-delivered reward was presented to initiate licking. To prevent random or continuous licking, if the animal licked within two seconds prior to the stimulus, the program reset and a stimulus was not delivered for that trial. The desired criterion level of performance was greater than 80% correct hits for 3 consecutive days. Approximately 13 sessions were run to secure the association. Once reaching criterion, licking sessions lasted for 25 minutes. Total session times lasted a maximum of 1 hour during the animals light phase in a dimly lit room. Approximately 60 averaged evoked responses at 1 to 2s ISI were recorded before the licking portion of the session to get a baseline and were compared to averages during licking. The sipper tube was not in front of the animal’s mouth during the initial trials to prevent the association between baseline trials and the receiving of a reward.
Figure 3.

The experimental setup includes a sipper tube (connected to the force transducer) placed in front of the rat’s face to measure licks and deliver fluid. The rat’s body was restrained using the wrap described in Figure 1, and the head was held steady by inserting earbars into the hollow tube on the back of the rat’s head stage. Amplifier boards were connected to the rat’s head stage and electrode array to record evoked responses when the whiskers were stimulated. The whisker was placed in the hook at the end of the whisker stimulator for stimulation. The rat was trained to lick in response to the whisker stimulation to receive 100 µl of a sucrose solution.
To determine if animals could hear any possible noise produced by the whisker stimulator, a noise test was conducted once the learning criterion was met. The noise test assessed licks when the whisker was stimulated and under two sham conditions that consisted of the whisker in the stimulator, but the stimulator inactive and the whisker out of the stimulator, but the stimulator active. The noise test occurred on two separate days with day one consisting of the whisker in (WIN) and whisker out (WO) condition and day two including the WIN condition and the whisker in, but no stimulus condition (WNS). The sessions lasted 15 minutes for each condition.
Sleep Deprivation
In order to test the effects of conditions that should affect performance, a sleep deprivation response curve (3, 6, and 12 consecutive hours) was conducted according to a Latin square design. Animals were deprived once a week, allowing a 1 week recovery period to account for carry over effects. Baseline sessions were run prior to sleep deprivation at times corresponding to deprivation recording times (10am for 3 hours, 1pm for 6 hours, and 7pm for 12 hours) to account for possible circadian effects and were used for comparisons. Sleep deprivation began at the beginning of the animals light cycle (7am) and involved gentle handling in the home cage, allowing a larger range of natural behaviors than forced motion. The animals were not handled during sleep deprivation but were nudged with a ruler it they appeared to be falling asleep. The ruler was also used to lightly tap on the cage or move the bedding around to keep the rat awake. PVT sessions were initiated directly after sleep deprivation ceased. Food and water was available ad libitum during sleep deprivation.
Data Analyses
Statistical analyses were performed using repeated measures analysis of variance (ANOVA, SPSS version 16.0, SPSS Inc., Chicago IL, USA) to account for changes over time during the repeated training and testing periods and when appropriate, paired-sample t-tests. Evoked responses were averaged using Octave, an open source data analysis package (www.octave.org). EEG was sorted into 2s epochs and converted using fast Fourier transform to calculate a power spectrum for delta (0.5– 4 Hz), gamma (25–45 Hz), and EMG activity during the sleep deprivation sessions.
Once the animals had reached the criterion that was set for learning (i.e., session performance > 80% correct hits for three consecutive days), within session performance was analyzed to determine whether there was a change in responsiveness or accuracy. The average percent correct hits and reaction times during the first and last 5 minutes were compared using a paired t-test. The average reaction times during each 5 minute bin (1–5 min, 5–10 min, 10–15 min, 15–20 min, and 20–25 min) of the 25 minute session were analyzed using a regression analysis. Any response >1000ms was omitted from the reaction time and percent correct component of the 5 minute analysis and considered a random lick.
Results
Restraint Training
Behaviors observed during restraint training were monitored using an ethogram and allowed differentiation between calm versus active rats. Progress over time for each session was monitored by recording behaviors every 30 s. The ethogram indicated that the percentage of good behaviors steadily increased across session (ANOVA, F (27, 108) = 25.936, p<0.001). After 3 days of restraint training, the average percentage of good behaviors was greater than 90% and the time in the wrap reached 60 minutes after approximately 13 sessions. The total wrap training lasted 1–2 months to ensure that the good behaviors remained for the licking phase of the experiment. Stroking the animal’s whiskers during the wrap training made introduction to the recording setup less stressful since they were habituated to whisker stimulation. The animals did not lose weight during the wrap training, indicating that they were not stressed by the procedure. 1–2 pieces of sweetened multi-grain cereal were given to the animals after the wrap training sessions as well as the licking sessions to help build a positive association between the restraint paradigms and a reward.
Noise Test
To confirm that there were no differences during the noise test for the whisker in (WIN) condition on days 1 and 2, a paired-sample t-test was conducted for both groups and were shown to not be statistically different from each other (t (3) = −1.773, p > 0.05). Once we determined that there were no differences between the day 1 and 2 WIN data, the average of WIN days 1 and 2 was compared against the two sham conditions (i.e., whisker out, but stimulator active (WO) and whisker in, but no stimulus condition (WNS)) using a repeated measures ANOVA. As seen in Figure 4, WIN, WNS and WO performance indicated a significant effect (F (2, 6) = 37.747, p ≤ 0.001) of test condition, with post-hoc analysis identifying that WIN performance was significantly higher than WO or WNS performance in the presence of 80 dB white noise (p < 0.01), but WO and WNT were not different from each other (p > 0.05). Any “correct” hit during WNS and WO conditions could be associated with random lick events.
Figure 4.
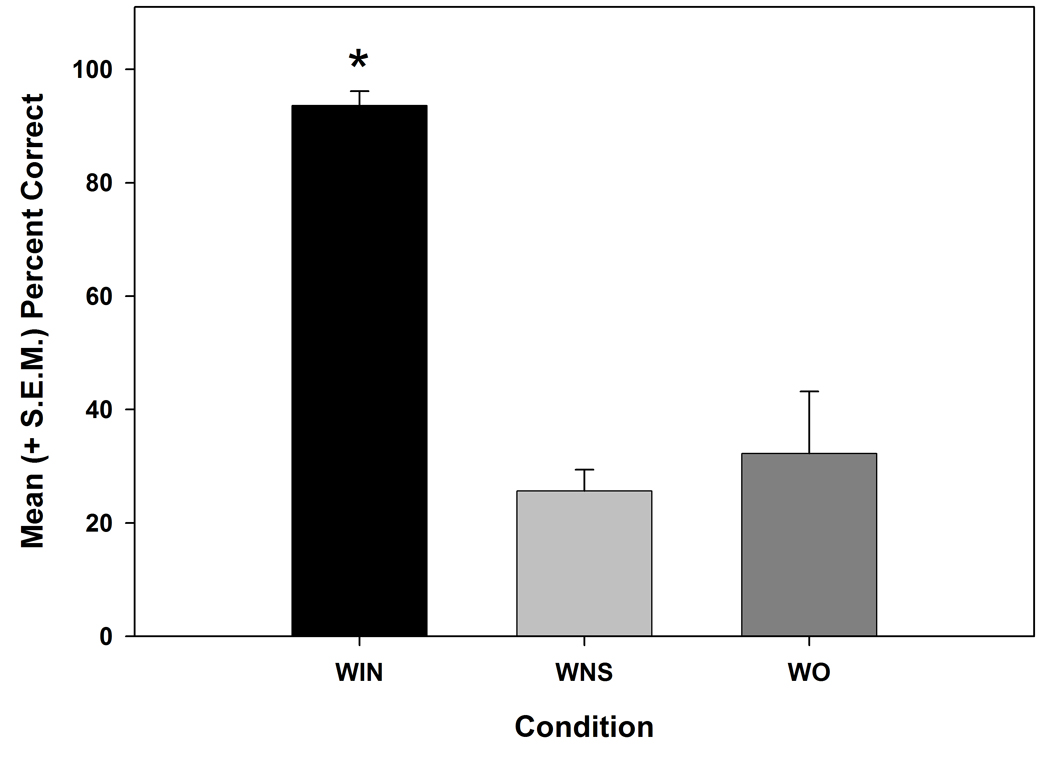
Bar graphs illustrate the mean (+S.E.M.) percent correct hits to the PVT under the three conditions of: 1) the whisker in the stimulator and receiving stimulation (WIN) 2) the whisker in the stimulator with no stimulation (WNS) and 3) the whisker out of the stimulator and the stimulator operating (WO) (* = p < 0.001 when compared to other conditions). Test was done with 80 dB background white noise. Any licks within 2s of the stimulus during WNS and WO conditions were most likely random lick events.
Lick Training
Once the maximum ISI of 8–16s was reached, reaction time and percent correct hits (number of correct hits / number of correct hits + number of misses) over 20 training sessions were individually analyzed using a repeated-measures ANOVA. We found a statistically significant increase in percent correct hits (F (19, 57) = 64.134, p < 0.001) over the course of lick training and reaction time also improved significantly (F (19, 57) = 45.643, p < 0.001) over the 20 training sessions (Figure 5). After approximately 8 lick training sessions, the animals produced greater than 80% correct hits to the stimulus, reaction times were less than 400ms, and animals drank an average of 5.77±0.37 mls during a 25 minute licking session.
Figure 5.
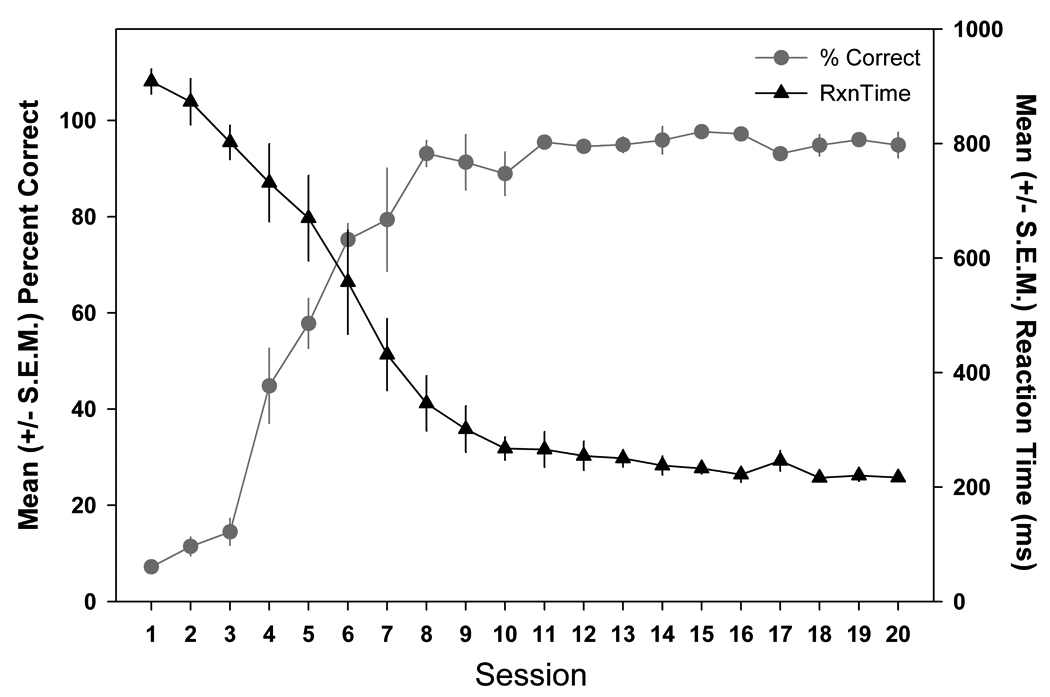
Mean (± S.E.M.) percent correct and reaction times over the twenty training sessions show that the animals significantly improved their accuracy over the training sessions (p < 0.001), reaching the criterion of 80% correct for 3 consecutive days by the eighth session. The animals performed significantly faster over the training sessions (p < 0.001).
Effects of Conditioning on Evoked Potentials
When whiskers were stimulated, we recorded cortical evoked response potentials (ERP) from the electrode over the corresponding cortical column within the electrode array. Once training was established (percent correct > 80% correct for 3 consecutive days), ERP P1/N1 amplitude was consistent across the subsequent 13 session (F (12, 36) = 1.856, p > 0.05), indicating that cortical potentials did not change over time. Figure 6 displays an example ERP during the baseline before licking (BBL), during licking (DL), and the baseline after licking (BAL) from each animal along with the licking behavior. When comparing P1-N1 amplitude between baseline conditions (whiskers were stimulated, but the sipper tube was removed and no licking occurred) and that during licking, the P1-N1 amplitude increased during the lick response period (two-way ANOVA, F (1, 3) = 31.021, p < 0.05). In contrast, the N1-P2 component showed no significant effects of testing condition or session (F (1, 3) = 8.417 and F(12, 36) = 0.466, ps > 0.05, respectively).
Figure 6.

Example averaged evoked responses from all animals are shown during the baseline before licking (BBL, black trace), during licking (DL, thick gray trace), and the baseline after licking (BAL, light gray trace). The licking behavior during the DL period is shown as a solid black line below the evoked responses in the form of an event histogram. No licks could be recorded during baseline conditions because the sipper tube was not available. An increase in P1/N1 amplitude was seen during conditioned learning when comparing baseline averages (whiskers were stimulated, but the sipper tube was removed and no licking occurred) to those during active licking (p < 0.05).
Sleep Deprivation
Effects on percent correct hits and reaction time
A two-way ANOVA evaluated the mean (over the 25 minutes session) reaction times and percent correct hits according to deprivation level (i.e., baseline and sleep deprivation) and deprivation time (i.e., 3, 6, and 12 hours of deprivation). Percent correct during baseline and sleep deprivation showed a significant effect for sleep deprivation time (i.e., 3, 6, and 12 hours; F (2, 6) = 126.071, p < 0.001) and deprivation day (i.e., baseline vs. deprivation; F (1, 3) = 87.676, p < 0.005). In addition, a significant Deprivation Time × Day of Deprivation interaction was identified (F (2, 6) = 73.541, p < 0.001). Post-hoc analyses indicated that percent correct hits at 6 and 12 hour deprivation time points significantly decreased from baseline (t (3) = 8.233, p < 0.005 and t (3) = 9.875, p < 0.005, respectively; see Figure 7, A).
Figure 7.
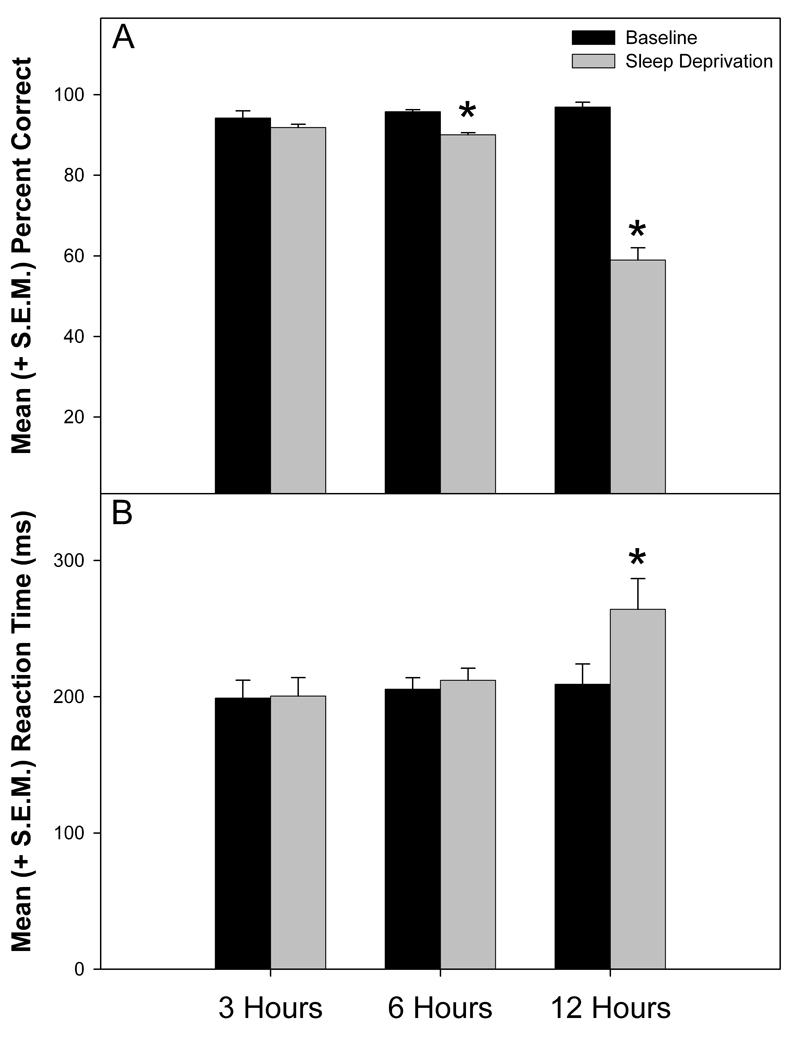
Mean (+ S.E.M.) percent correct hits during baseline and sleep deprivation sessions are shown in the upper panel (A). The animal’s performance significantly decreased during 6 and 12 hours of sleep deprivation (p < 0.005). Mean (+ S.E.M.) reaction time during baseline and sleep deprivation sessions are shown in the lower panel (B). The reaction time significantly increased during 12 hours of sleep deprivation (p < 0.05).
Reaction times during baseline and sleep deprivation also showed a significant effect for sleep deprivation time (i.e., 3, 6, and 12 hours; F(2,6) = 5.260, p < 0.05) and deprivation day (i.e., baseline vs. deprivation; F(1,3) = 24.667, p < 0.05) as well as a significant Deprivation Time × Day of Deprivation interaction (F(2,6) = 6.253, p < 0.05). Post-hoc analyses indicated that reaction time at the12 hour deprivation time point was significantly increased from baseline (t (3) = −4.688, p < 0.05) (Figure 7, B).
Within session analysis
Once the animals reached 80% correct hits for 3 consecutive days, the percent correct hits (t (3) = −0.179, p > 0.05) and reaction times (t (3) = 2.05, p > 0.05) of the training session did not change when the first 5 minutes to the last 5 minutes of the session were compared.
Within session performance related to percent correct during baseline and sleep deprivation sessions showed a significant effect of deprivation level (i.e., baseline and sleep deprivation) and deprivation time (i.e., 3, 6, and 12 hours of deprivation) (F (1, 3) = 99.372, p < 0.01 and F (2, 6) = 61.788, p < 0.001, respectively), as well as a Deprivation Level × Deprivation Time interaction (F (2, 6) = 58.269, p < 0.001) using a repeated measures ANOVA. However, percent correct did not change significantly between the first and last 5 minutes of the 25 minute session. Conversely, reaction times during the first and last 5 minutes of the session showed a main effect of session time (F (1, 3) = 11.095, p < 0.05), but no other significant effects or interactions.
The reaction times were analyzed for each 5 minute bin (1–5 min, 5–10 min, 10–15 min, 15–20 min, and 20–25 min) of the 25 minute session during the training (once reaching criterion of > 80% correct hits for 3 consecutive days), baseline and sleep deprivation sessions in order to assess consistency within a session. Regression analysis revealed a linear relationship during the training and baseline sessions such that reaction times decreased during the session (p < 0.01, r2 = 0.96 and r2 = 0.92, respectively), but not during the sleep deprivation sessions (p > 0.05, r2 = 0.02 for 3 hours, r2 = 0.05 for 6 hours, and r2 = 0.00 for 12 hours of deprivation) (Figure 8).
Figure 8.
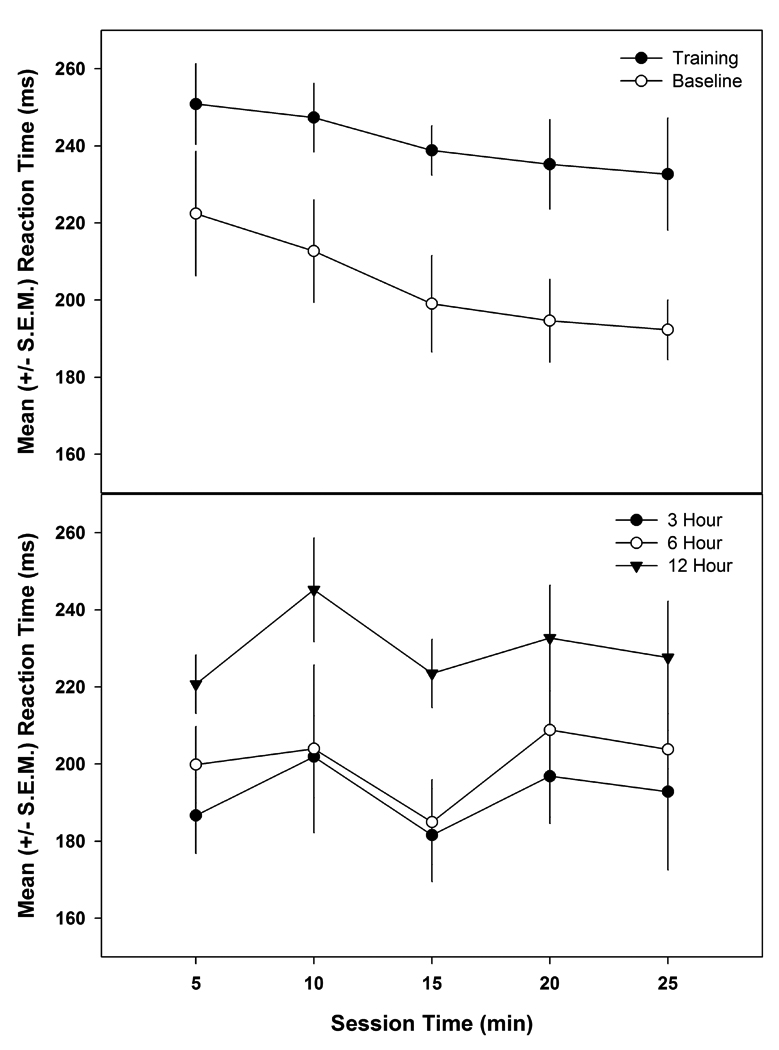
The average reaction times during each 5 minute bin (1–5 min, 5–10 min, 10–15 min, 15–20 min, and 20–25 min) of the 25 minute session were analyzed using a regression analysis. The top panel shows the mean (+S.E.M.) reaction times for each 5 minute bin during the training and baseline sessions. The regression analysis revealed a linear relationship (p < 0.01, r2 = 0.96 and r2 = 0.92, respectively) such that reaction times decreased during the session but not during the sleep deprivation sessions (p > 0.05, r2 = 0.02 for 3 hours, r2 = 0.05 for 6 hours, and r2 = 0.00 for 12 hours of deprivation) as seen in the lower panel.
Effects of sleep deprivation on EEG and EMG activity
EEG and EMG activity during the sleep deprivation sessions were analyzed to assess differences in delta, gamma or EMG power depending on whether the animal made a correct hit or miss (Figure 9). Delta power was significantly higher (t (3) = −4.82, p < 0.05) and EMG activity was lower when the animal did not respond to the stimulus. While the gamma and EMG differences did not reach statistical significance, there was a trend for higher gamma and EMG activity (p < 0.15) when the animal made a correct hit to the stimulus.
Figure 9.
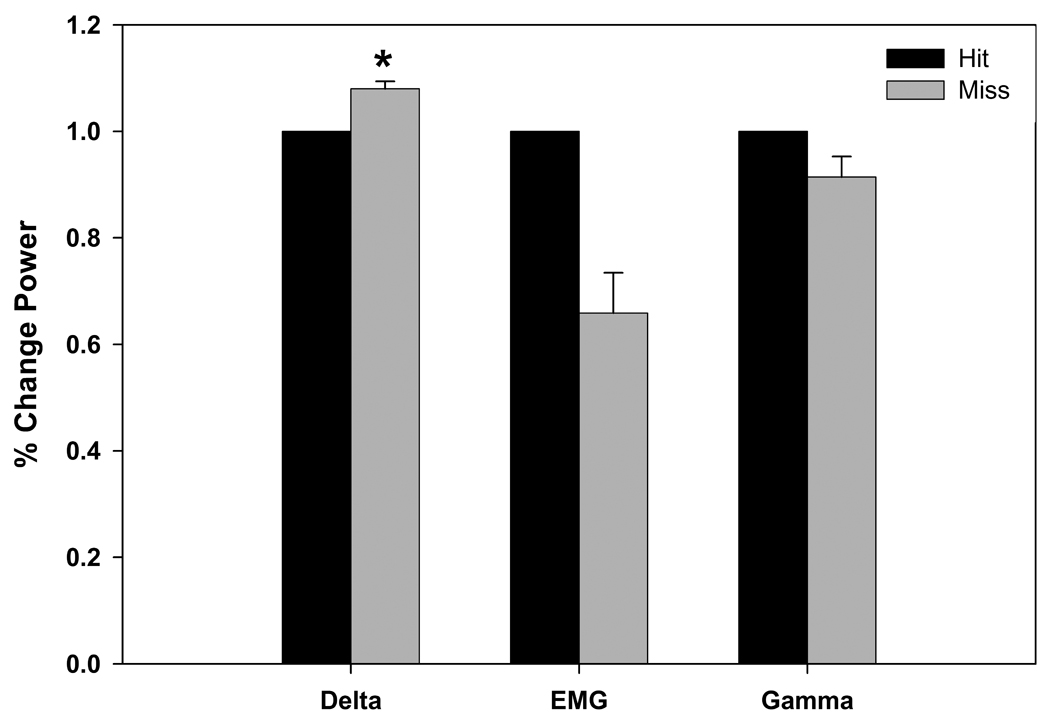
The mean (+ S.E.M.) delta, EMG and gamma power (% change) during sleep deprivation sessions show delta power was significantly higher when the animal did not respond to the stimulus (miss) (* = p < 0.05). There was a trend for EMG and EEG gamma power to be lower when the animal did not respond to the stimulus but did not reach significance (p < 0.15).
Discussion
Animals performed a fast stimulus/response task without the use of water deprivation. A highly palatable sucrose solution motivated the animals to maintain operant responding for extended lengths of time. The use of an ethogram procedure gradually habituated the animals to immobilization, resulting in the animals remaining calm for up to an hour while restrained. Signs of stress decreased as restraint time increased and no weight loss was observed over the length of the experiment.
Time on task effects
Percent correct hits increased and reaction times became faster over the training sessions, demonstrating that the animals were learning the task. For within session performance, the baseline sessions resemble the training sessions with decreased reaction times seen in the last five minutes of the 25 minute session when compared to the first five minutes. This decrease was not observed during sleep deprivation conditions. The percent correct hits did not change between the beginning (i.e. the first 5 minutes) and the end (i.e. the last 5 minutes) of the 25 minute session.
Monotonous tasks such as the PVT typically induce greater time-on-task (TOT) impairments due to fatigue, decreased motivation, boredom, and sleepiness [45]. Human studies report a decline in response speed (reciprocal of reaction time) over a 10 minute duration, especially during sleep deprivation [60]. The reaction time and percent correct in the present study did not decline over the 25 minute session which may be due to the additional incentive of reward after each stimulus, whereas the human subjects only receive one reward at the end of the study. Another variable to consider is the longer ISI length used in the present study compared to the 2–10s ISI in the human PVT [33]. The increased ISI may also allow animals more recovery time and hence exhibit reduced TOT effects [57]. More studies are required to explore the effects of varying ISIs used in the PVT. The proposed model of the rat PVT with a 100 µl reward is useful to study vigilance impairments without a decline in performance due to satiety or boredom.
Sleep Deprivation
The effects of sleep deprivation in the rat PVT resemble impairments seen during human sleep-deprivation. Percent correct hits decreased and reaction times became slower, demonstrating that they are sensitive measures useful in detecting impairments induced by sleep deprivation [5, 33]. 6 and 12 hours of sleep deprivation resulted in a significant decrease in percent correct hits and an increase in reaction times was observed after 12 hours of deprivation. Individual variations in response to sleep loss have been seen in humans [58] and can be expected to occur in animals, however, the deficits should be stable within individuals. The described model of the rat PVT involves a tactile stimulus rather than an auditory or visual stimulus. It is possible that the effects of sleep deprivation may differ depending on the type of stimulus presented.
Differences in EEG and EMG power were observed during the sleep deprivation sessions. Delta power was significantly higher and EMG activity was lower when the animal did not respond to the stimulus, suggesting that the animal was sleepy during those trials. Indeed, from the EEG and EMG parameters the animals exhibited some sleep-like characteristics when they made a mistake, although other behavioral parameters indicated that the animals were awake. Investigations into objective measures of sleepiness and performance are one of the future goals of this project [5, 30].
We chose psychomotor vigilance task (PVT) methods to assess sleep deprivation effects because reaction time changes are one of the most sensitive markers of performance deficits after restricted sleep. PVT primarily looks at reaction times, lapses/misses (failure to respond in the given time frame) and false alarms or premature responses. This data is useful in understanding which aspects of task performance are affected by vigilance decrements. Another tool, signal detection theory (SDT), is a useful method to analyze decision making in the presence of uncertainty or other distractions [16, 22, 32, 37, 52, 53]. The most common SDT measures are correct hits (signal present and response present), correct rejections (stimulus absent and no response), misses (stimulus present but no response) and false alarms (signal is absent but responds as if signal is present). We were unable to record false alarms in the current study but our data system can be easily modified to collect this information for future experiments. If we had access to false alarm information, and had utilized a second whisker, then SDT would provide additional important information about the animals’ ability to detect and respond to the stimulus. Future experiments could include a second whisker, with one being the reward whisker and the second being a control whisker, enabling more in depth SDT analysis.
Comparison to Human Studies
The long term goal of the present study was to develop an animal model for the PVT which parallels human studies. However, humans learn the task more quickly because they receive instruction from the experimenter, whereas rats require training. However, the rat PVT is easy to learn, allowing the rats to reach criterion relatively quickly. The 4- to 6-week length of training (including mapping of the barrel cortex) is comparable to a previously described version of the rat PVT which also takes between 4- to 6-weeks of training [13]. The primary measures collected are reaction time and lapses (misses). In this model, lapses were defined as a failure to respond within 2 second of the twitch whereas human studies usually define lapses as a failure to respond within 500 ms [33]. Once the animals reached criterion in the present study, the average response time was <500 ms, therefore, the cutoff time should be reduced in future studies to more closely parallel the human PVT. The rat PVT allows for comparisons between animal and human studies but is limited by the fact that self-reported measures or mood/feelings of the animal are not available.
Cortical Plasticity
The somatosensory cortex provides a model system to study plasticity induced by conditioning, trimming of whiskers, and preferential use of one or more of whiskers. We observed an increase in peak amplitudes during conditioning which is consistent with previous reports, suggesting that plasticity may occur with conditioned learning [15, 27, 31, 38]. The increase in amplitude appeared to be stimulus-specific, occurring only with licking behavior, and may be an indicator of learning and sensory processing. The experience-dependent changes observed may be due to alterations in an ascending pathway and not solely to changes in the cortex. Vigilance performance and sustained attention rely on the fronto-parietal sustained attention network of the right hemisphere as well as cortical and subcortical motor systems [21, 48]. Right hemispheric prefrontal and parietal regions are activated during sustained attention performance. Rats, as well as humans, have shown greater sensory neglect with right cortical lesions in comparison to left lesions [48]. The placement of the electrode array over the right hemisphere allows mapping and identification of individual whisker barrels for optimal recording of evoked potentials and EEG in the barrel cortex during PVT sessions. The functional dynamics of cortical activation that occurs during conditioning as well as during different sleep states can be explored.
Conclusions
The PVT is a sensitive measure to sleep loss [5, 21], as well as changes in circadian systems [65]. The whisker stimulator/lick response paradigm can be used to investigate the effects of varying lengths of sleep restriction as well as the anti-somnolence properties of drugs. This conditioning paradigm will also aid in the study of physiological mechanisms in the control of sleep and allow for the investigation of localized sleep-like functional states or plasticity that may occur in the cortical columns.
Research Highlights.
The psychomotor vigilance task is a widely used test of simple reaction times and is a sensitive measure of sleep deprivation.
Sucrose can be used as a reinforcer to maintain responding in conditioned learning paradigms without the need for deprivation.
A significant decrease in percent correct hits occurred following 6 and 12 hours of sleep deprivation and reaction times increased significantly following 12 hours of sleep deprivation.
Increases in EEG delta power and lower EMG power were observed prior to misses during sleep deprivation sessions.
An increase in evoked response peak amplitudes was observed during conditioning, suggesting that plasticity may occur with conditioned learning.
Acknowledgements
Support for this research was provided by the W.M. Keck Foundation and NIH MH71830. The authors would like to thank Chelsea Baker, Sam Bobrowisk, Christi Pedrow and Derrick Phillips for their technical assistance.
Footnotes
Publisher's Disclaimer: This is a PDF file of an unedited manuscript that has been accepted for publication. As a service to our customers we are providing this early version of the manuscript. The manuscript will undergo copyediting, typesetting, and review of the resulting proof before it is published in its final citable form. Please note that during the production process errors may be discovered which could affect the content, and all legal disclaimers that apply to the journal pertain.
References
- 1.Ahissar E, Knutsen PM. Object localization with whiskers. Biol. Cybern. 2008;98:449–458. doi: 10.1007/s00422-008-0214-4. [DOI] [PubMed] [Google Scholar]
- 2.Arabzadeh E, Panzeri S, Diamond ME. Whisker vibration information carried by rat barrel cortex neurons. J. Neurosci. 2004;24:6011–6020. doi: 10.1523/JNEUROSCI.1389-04.2004. [DOI] [PMC free article] [PubMed] [Google Scholar]
- 3.Arabzadeh E, Panzeri S, Diamond ME. Deciphering the spike train of a sensory neuron: counts and temporal patterns in the rat whisker pathway. J. Neurosci. 2006;26:9216–9226. doi: 10.1523/JNEUROSCI.1491-06.2006. [DOI] [PMC free article] [PubMed] [Google Scholar]
- 4.Arabzadeh E, Zorzin E, Diamond ME. Neuronal encoding of texture in the whisker sensory pathway. PLoS. Biol. 2005;3:e17. doi: 10.1371/journal.pbio.0030017. [DOI] [PMC free article] [PubMed] [Google Scholar]
- 5.Balkin TJ, Bliese PD, Belenky G, Sing H, Thorne DR, Thomas M, Redmond DP, Russo M, Wesensten NJ. Comparative utility of instruments for monitoring sleepiness-related performance decrements in the operational environment. J. Sleep Res. 2004;13:219–227. doi: 10.1111/j.1365-2869.2004.00407.x. [DOI] [PubMed] [Google Scholar]
- 6.Bell SM, Stewart RB, Thompson SC, Meisch RA. Food-deprivation increases cocaine-induced conditioned place preference and locomotor activity in rats. Psychopharmacology (Berl) 1997;131:1–8. doi: 10.1007/s002130050258. [DOI] [PubMed] [Google Scholar]
- 7.Bizarro L, Patel S, Murtagh C, Stolerman IP. Differential effects of psychomotor stimulants on attentional performance in rats: nicotine, amphetamine, caffeine and methylphenidate. Behav. Pharmacol. 2004;15:195–206. [PubMed] [Google Scholar]
- 8.Bryant JL, Roy S, Heck DH. A technique for stereotaxic recordings of neuronal activity in awake, head-restrained mice. J. Neurosci. Methods. 2009;178:75–79. doi: 10.1016/j.jneumeth.2008.11.014. [DOI] [PMC free article] [PubMed] [Google Scholar]
- 9.Cabeza dV, Carr KD. Food restriction enhances the central rewarding effect of abused drugs. J. Neurosci. 1998;18:7502–7510. doi: 10.1523/JNEUROSCI.18-18-07502.1998. [DOI] [PMC free article] [PubMed] [Google Scholar]
- 10.Carr KD, Kim GY, Cabeza dV. Chronic food restriction in rats augments the central rewarding effect of cocaine and the delta1 opioid agonist, DPDPE, but not the delta2 agonist, deltorphin-II. Psychopharmacology (Berl) 2000;152:200–207. doi: 10.1007/s002130000523. [DOI] [PubMed] [Google Scholar]
- 11.Carr KD, Kim GY, Cabeza dV. Rewarding and locomotor-activating effects of direct dopamine receptor agonists are augmented by chronic food restriction in rats. Psychopharmacology (Berl) 2001;154:420–428. doi: 10.1007/s002130000674. [DOI] [PubMed] [Google Scholar]
- 12.Christie MA, Bolortuya Y, Chen LC, McKenna JT, McCarley RW, Strecker RE. Microdialysis elevation of adenosine in the basal forebrain produces vigilance impairments in the rat psychomotor vigilance task. Sleep. 2008;31:1393–1398. [PMC free article] [PubMed] [Google Scholar]
- 13.Christie MA, McKenna JT, Connolly NP, McCarley RW, Strecker RE. 24 hours of sleep deprivation in the rat increases sleepiness and decreases vigilance: introduction of the rat-psychomotor vigilance task. J. Sleep Res. 2008;17:376–384. doi: 10.1111/j.1365-2869.2008.00698.x. [DOI] [PMC free article] [PubMed] [Google Scholar]
- 14.Coull JT. Neural correlates of attention and arousal: insights from electrophysiology, functional neuroimaging and psychopharmacology. Prog. Neurobiol. 1998;55:343–361. doi: 10.1016/s0301-0082(98)00011-2. [DOI] [PubMed] [Google Scholar]
- 15.Cybulska-Klosowicz A, Mazarakis NK, Van DA, Blakemore C, Hannan AJ, Kossut M. Impaired learning-dependent cortical plasticity in Huntington's disease transgenic mice. Neurobiol. Dis. 2004;17:427–434. doi: 10.1016/j.nbd.2004.08.009. [DOI] [PubMed] [Google Scholar]
- 16.Demeter E, Sarter M, Lustig C. Rats and humans paying attention: cross-species task development for translational research. Neuropsychology. 2008;22:787–799. doi: 10.1037/a0013712. [DOI] [PMC free article] [PubMed] [Google Scholar]
- 17.Diamond ME, von HM, Knutsen PM, Kleinfeld D, Ahissar E. 'Where' and 'what' in the whisker sensorimotor system. Nat. Rev. Neurosci. 2008;9:601–612. doi: 10.1038/nrn2411. [DOI] [PubMed] [Google Scholar]
- 18.DiBattista D. Voluntary lactose ingestion in gerbils, rats, mice, and golden hamsters. Physiol Behav. 1992;52:59–63. doi: 10.1016/0031-9384(92)90433-3. [DOI] [PubMed] [Google Scholar]
- 19.Diergaarde L, Pattij T, Nawijn L, Schoffelmeer AN, De Vries TJ. Trait impulsivity predicts escalation of sucrose seeking and hypersensitivity to sucrose-associated stimuli. Behav. Neurosci. 2009;123:794–803. doi: 10.1037/a0016504. [DOI] [PubMed] [Google Scholar]
- 20.Domenger D, Schwarting RK. Sequential behavior in the rat: role of skill and attention. Exp. Brain Res. 2007;182:223–231. doi: 10.1007/s00221-007-0987-z. [DOI] [PubMed] [Google Scholar]
- 21.Drummond SP, Bischoff-Grethe A, Dinges DF, Ayalon L, Mednick SC, Meloy MJ. The neural basis of the psychomotor vigilance task. Sleep. 2005;28:1059–1068. [PubMed] [Google Scholar]
- 22.Dudchenko P, Paul B, Sarter M. Dissociation between the effects of benzodiazepine receptor agonists on behavioral vigilance and responsitivity. Psychopharmacology (Berl) 1992;109:203–211. doi: 10.1007/BF02245501. [DOI] [PubMed] [Google Scholar]
- 23.Feldman DE, Brecht M. Map plasticity in somatosensory cortex. Science. 2005;310:810–815. doi: 10.1126/science.1115807. [DOI] [PubMed] [Google Scholar]
- 24.Fontanini A, Katz DB. 7 to 12 Hz activity in rat gustatory cortex reflects disengagement from a fluid self-administration task. J. Neurophysiol. 2005;93:2832–2840. doi: 10.1152/jn.01035.2004. [DOI] [PubMed] [Google Scholar]
- 25.Galvez R, Weiss C, Cua S, Disterhoft J. A novel method for precisely timed stimulation of mouse whiskers in a freely moving preparation: application for delivery of the conditioned stimulus in trace eyeblink conditioning. J. Neurosci. Methods. 2009;177:434–439. doi: 10.1016/j.jneumeth.2008.11.002. [DOI] [PMC free article] [PubMed] [Google Scholar]
- 26.Hall RD, Clayton RJ, Mark RG. A device for the partial restraint of rats in operant conditioning studies. J. Exp. Anal. Behav. 1966;9:143–145. doi: 10.1901/jeab.1966.9-143. [DOI] [PMC free article] [PubMed] [Google Scholar]
- 27.Hall RD, Mark RG. Fear and the modification of acoustically evoked potentials during conditioning. J. Neurophysiol. 1967;30:893–910. doi: 10.1152/jn.1967.30.4.893. [DOI] [PubMed] [Google Scholar]
- 28.Harvey MA, Bermejo R, Zeigler HP. Discriminative whisking in the head-fixed rat: optoelectronic monitoring during tactile detection and discrimination tasks. Somatosens. Mot. Res. 2001;18:211–222. doi: 10.1080/01421590120072204. [DOI] [PubMed] [Google Scholar]
- 29.Knutsen PM, Ahissar E. Orthogonal coding of object location. Trends Neurosci. 2009;32:101–109. doi: 10.1016/j.tins.2008.10.002. [DOI] [PubMed] [Google Scholar]
- 30.Krueger JM, Rector DM, Roy S, Van Dongen HP, Belenky G, Panksepp J. Sleep as a fundamental property of neuronal assemblies. Nat. Rev. Neurosci. 2008;9:910–919. doi: 10.1038/nrn2521. [DOI] [PMC free article] [PubMed] [Google Scholar]
- 31.Kublik E. Contextual impact on sensory processing at the barrel cortex of awake rat. Acta Neurobiol. Exp. (Wars.) 2004;64:229–238. doi: 10.55782/ane-2004-1508. [DOI] [PubMed] [Google Scholar]
- 32.Leitner DS, Carmody DP, Girten EM. A signal detection theory analysis of gap detection in the rat. Percept. Psychophys. 1997;59:774–782. doi: 10.3758/bf03206023. [DOI] [PubMed] [Google Scholar]
- 33.Lim J, Dinges DF. Sleep deprivation and vigilant attention. Ann. N. Y. Acad. Sci. 2008;1129:305–322. doi: 10.1196/annals.1417.002. [DOI] [PubMed] [Google Scholar]
- 34.Lin JY, Roman C, St AJ, Reilly S. Taste, olfactory and trigeminal neophobia in rats with forebrain lesions. Brain Res. 2009;1251:195–203. doi: 10.1016/j.brainres.2008.11.040. [DOI] [PMC free article] [PubMed] [Google Scholar]
- 35.Lubke J, Feldmeyer D. Excitatory signal flow and connectivity in a cortical column: focus on barrel cortex. Brain Struct. Funct. 2007;212:3–17. doi: 10.1007/s00429-007-0144-2. [DOI] [PubMed] [Google Scholar]
- 36.Mark RG, Hall RD. Acoustically evoked potentials in the rat during conditioning. J. Neurophysiol. 1967;30:875–892. doi: 10.1152/jn.1967.30.4.875. [DOI] [PubMed] [Google Scholar]
- 37.Melia KF, Koob GF, Ehlers CL. Ethanol effects on delayed spatial matching as modeled by a negative exponential forgetting function. Psychopharmacology (Berl) 1990;102:391–398. doi: 10.1007/BF02244109. [DOI] [PubMed] [Google Scholar]
- 38.Musial P, Kublik E, Panecki SJ, Wrobel A. Transient changes of electrical activity in the rat barrel cortex during conditioning. Brain Res. 1998;786:1–10. doi: 10.1016/s0006-8993(97)01290-0. [DOI] [PubMed] [Google Scholar]
- 39.O'Connor DH, Clack NG, Huber D, Komiyama T, Myers EW, Svoboda K. Vibrissa-based object localization in head-fixed mice. J. Neurosci. 2010;30:1947–1967. doi: 10.1523/JNEUROSCI.3762-09.2010. [DOI] [PMC free article] [PubMed] [Google Scholar]
- 40.Petersen CC. The functional organization of the barrel cortex. Neuron. 2007;56:339–355. doi: 10.1016/j.neuron.2007.09.017. [DOI] [PubMed] [Google Scholar]
- 41.Prigg T, Goldreich D, Carvell GE, Simons DJ. Texture discrimination and unit recordings in the rat whisker/barrel system. Physiol Behav. 2002;77:671–675. doi: 10.1016/s0031-9384(02)00917-4. [DOI] [PubMed] [Google Scholar]
- 42.Rector DM, George JS. Continuous image and electrophysiological recording with real-time processing and control. Methods. 2001;25:151–163. doi: 10.1006/meth.2001.1232. [DOI] [PubMed] [Google Scholar]
- 43.Rector DM, Schei JL, Van Dongen HP, Belenky G, Krueger JM. Physiological markers of local sleep. Eur. J. Neurosci. 2009;29:1771–1778. doi: 10.1111/j.1460-9568.2009.06717.x. [DOI] [PMC free article] [PubMed] [Google Scholar]
- 44.Reilly S, Bornovalova MA. Conditioned taste aversion and amygdala lesions in the rat: a critical review. Neurosci. Biobehav. Rev. 2005;29:1067–1088. doi: 10.1016/j.neubiorev.2005.03.025. [DOI] [PubMed] [Google Scholar]
- 45.Richter S, Marsalek K, Glatz C, Gundel A. Task-dependent differences in subjective fatigue scores. J. Sleep Res. 2005;14:393–400. doi: 10.1111/j.1365-2869.2005.00473.x. [DOI] [PubMed] [Google Scholar]
- 46.Robbins TW. The 5-choice serial reaction time task: behavioural pharmacology and functional neurochemistry. Psychopharmacology (Berl) 2002;163:362–380. doi: 10.1007/s00213-002-1154-7. [DOI] [PubMed] [Google Scholar]
- 47.Rowland NE. Food or fluid restriction in common laboratory animals: balancing welfare considerations with scientific inquiry. Comp Med. 2007;57:149–160. [PubMed] [Google Scholar]
- 48.Sarter M, Givens B, Bruno JP. The cognitive neuroscience of sustained attention: where top-down meets bottom-up. Brain Res. Brain Res. Rev. 2001;35:146–160. doi: 10.1016/s0165-0173(01)00044-3. [DOI] [PubMed] [Google Scholar]
- 49.Siucinska E, Kossut M. Short-lasting classical conditioning induces reversible changes of representational maps of vibrissae in mouse SI cortex--a 2DG study. Cereb. Cortex. 1996;6:506–513. doi: 10.1093/cercor/6.3.506. [DOI] [PubMed] [Google Scholar]
- 50.Slawecki CJ, Roth J. Assessment of sustained attention in ad libitum fed Wistar rats: effects of MK-801. Physiol Behav. 2005;85:346–353. doi: 10.1016/j.physbeh.2005.04.021. [DOI] [PubMed] [Google Scholar]
- 51.Stuttgen MC, Ruter J, Schwarz C. Two psychophysical channels of whisker deflection in rats align with two neuronal classes of primary afferents. J. Neurosci. 2006;26:7933–7941. doi: 10.1523/JNEUROSCI.1864-06.2006. [DOI] [PMC free article] [PubMed] [Google Scholar]
- 52.Stuttgen MC, Schwarz C. Psychophysical and neurometric detection performance under stimulus uncertainty. Nat. Neurosci. 2008;11:1091–1099. doi: 10.1038/nn.2162. [DOI] [PubMed] [Google Scholar]
- 53.Talwar SK, Gerstein GL. A signal detection analysis of auditory-frequency discrimination in the rat. J. Acoust. Soc. Am. 1999;105:1784–1800. doi: 10.1121/1.426716. [DOI] [PubMed] [Google Scholar]
- 54.Thompson RF, Steinmetz JE. The role of the cerebellum in classical conditioning of discrete behavioral responses. Neuroscience. 2009;162:732–755. doi: 10.1016/j.neuroscience.2009.01.041. [DOI] [PubMed] [Google Scholar]
- 55.Thorne DR, Genser SG, Sing HC, Hegge FW. The Walter Reed performance assessment battery. Neurobehav. Toxicol. Teratol. 1985;7:415–418. [PubMed] [Google Scholar]
- 56.Topchiy IA, Wood RM, Peterson B, Navas JA, Rojas MJ, Rector DM. Conditioned lick behavior and evoked responses using whisker twitches in head restrained rats. Behav. Brain Res. 2009;197:16–23. doi: 10.1016/j.bbr.2008.07.032. [DOI] [PMC free article] [PubMed] [Google Scholar]
- 57.Tucker AM, Basner RC, Stern Y, Rakitin BC. The variable response-stimulus interval effect and sleep deprivation: an unexplored aspect of psychomotor vigilance task performance. Sleep. 2009;32:1393–1395. doi: 10.1093/sleep/32.10.1393. [DOI] [PMC free article] [PubMed] [Google Scholar]
- 58.Van Dongen HP, Baynard MD, Maislin G, Dinges DF. Systematic interindividual differences in neurobehavioral impairment from sleep loss: evidence of trait-like differential vulnerability. Sleep. 2004;27:423–433. [PubMed] [Google Scholar]
- 59.von HM, Itskov PM, Arabzadeh E, Diamond ME. Neuronal activity in rat barrel cortex underlying texture discrimination. PLoS. Biol. 2007;5:e305. doi: 10.1371/journal.pbio.0050305. [DOI] [PMC free article] [PubMed] [Google Scholar]
- 60.Wesensten NJ, Belenky G, Thorne DR, Kautz MA, Balkin TJ. Modafinil vs. caffeine: effects on fatigue during sleep deprivation. Aviat. Space Environ. Med. 2004;75:520–525. [PubMed] [Google Scholar]
- 61.Wiest MC, Nicolelis MA. Behavioral detection of tactile stimuli during 7–12 Hz cortical oscillations in awake rats. Nat. Neurosci. 2003;6:913–914. doi: 10.1038/nn1107. [DOI] [PubMed] [Google Scholar]
- 62.Wilbrecht L, Holtmaat A, Wright N, Fox K, Svoboda K. Structural plasticity underlies experience-dependent functional plasticity of cortical circuits. J. Neurosci. 2010;30:4927–4932. doi: 10.1523/JNEUROSCI.6403-09.2010. [DOI] [PMC free article] [PubMed] [Google Scholar]
- 63.Wolfe J, Hill DN, Pahlavan S, Drew PJ, Kleinfeld D, Feldman DE. Texture coding in the rat whisker system: slip-stick versus differential resonance. PLoS. Biol. 2008;6:e215. doi: 10.1371/journal.pbio.0060215. [DOI] [PMC free article] [PubMed] [Google Scholar]
- 64.Woolsey TA, Van der Loos H. The structural organization of layer IV in the somatosensory region (SI) of mouse cerebral cortex. The description of a cortical field composed of discrete cytoarchitectonic units. Brain Res. 1970;17:205–242. doi: 10.1016/0006-8993(70)90079-x. [DOI] [PubMed] [Google Scholar]
- 65.Wright KP, Jr, Hull JT, Czeisler CA. Relationship between alertness, performance, and body temperature in humans. Am. J. Physiol Regul. Integr. Comp Physiol. 2002;283:R1370–R1377. doi: 10.1152/ajpregu.00205.2002. [DOI] [PubMed] [Google Scholar]
- 66.Wrobel A, Kublik E, Musial P. Gating of the sensory activity within barrel cortex of the awake rat. Exp. Brain Res. 1998;123:117–123. doi: 10.1007/s002210050552. [DOI] [PubMed] [Google Scholar]