Abstract
Response rates of auditory nerve fibers (ANFs) to electric pulse trains change over time, reflecting substantial spike-rate adaptation that depends on stimulus parameters. We hypothesize that adaptation affects the representation of amplitude-modulated pulse trains used by cochlear prostheses to transmit speech information to the auditory system. We recorded cat ANF responses to sinusoidally amplitude-modulated (SAM) trains with 5,000 pulse/s carriers. Stimuli delivered by a monopolar intracochlear electrode had fixed modulation frequency (100 Hz) and depth (10%). ANF responses were assessed by spike-rate measures, while representation of modulation was evaluated by vector strength (VS) and the fundamental component of the fast Fourier transform (F0 amplitude). These measures were assessed across the 400 ms duration of pulse-train stimuli, a duration relevant to speech stimuli. Different stimulus levels were explored and responses were categorized into four spike-rate groups to assess level effects across ANFs. The temporal pattern of rate adaptation to modulated trains was similar to that of unmodulated trains, but with less rate adaptation. VS to the modulator increased over time and tended to saturate at lower spike rates, while F0 amplitude typically decreased over time for low driven rates and increased for higher driven rates. VS at moderate and high spike rates and degree of F0 amplitude temporal changes at low and moderate spike rates were positively correlated with the degree of rate adaptation. Thus, high-rate carriers will modify the ANF representation of the modulator over time. As the VS and F0 measures were sensitive to adaptation-related changes over different spike-rate ranges, there is value in assessing both measures.
Keywords: spike rate, adaptation, vector strength, FFT, F0 amplitude, cochlear implant
Introduction
Most multi-channel auditory prostheses stimulate auditory nerve fibers (ANFs) using amplitude-modulated electric pulse trains to encode the temporal information of sound. How well ANFs represent that information is likely important for determining the quality of hearing and speech perception. ANF responses to electrical stimulation differ from those with acoustic stimulation in several ways, including greater across- and within-ANF synchronization and narrow dynamic ranges (Moxon 1971; Hartmann et al. 1984; van den Honert and Stypulkowski 1984, 1987b; Javel et al. 1987; Shepherd and Javel 1997, 1999; Miller et al. 1999a, 2001). It is likely that these differences limit the nerve's ability to encode the envelope of modulated trains.
A proposed method for overcoming stimulus-coding limitations is the use of high-rate pulse-train carriers. With a computational model, Rubinstein et al. (1999) showed that high-rate trains evoked spontaneous-like ANF responses that should improve the temporal representation of electric stimuli. Litvak et al. (2003a and b) stimulated cat ANFs with 5,000 pulse/s pulse trains and showed that the temporal representation of sinusoidal modulation can indeed be improved. However, those studies focused on “steady-state” responses; ANF responses to electric pulse trains are not constant over time, nor are speech stimuli. Zhang et al. (2007) and Miller et al. (2008a) showed that spike rate and temporal response properties (vector strength, interval statistics) changed over the duration of 300 ms constant-amplitude pulse trains. Rate adaptation was clearly evident over the first 100 ms relative to train onset and greater with high-rate trains than with low-rate trains. We hypothesize that these response changes affect how amplitude-modulated pulse trains are represented in ANF responses and, consequently, how speech information is transmitted to the auditory system. Based on the Zhang et al. (2007) data, we expect that the influence of the carrier will be greater for higher rate trains. As most short-term adaptation takes place over a 100–200 ms epoch, their effects on speech segments with similar durations are thus of significant interest.
To test our hypothesis, we examined ANF responses to sinusoidally amplitude-modulated (SAM) trains of 400 ms duration using an acutely deafened cat model. A 5,000 pulses/s carrier was chosen to produce strong rate adaptation as well as for its putative advantage in neural coding of the stimulus fine structure. We examined changes in spike rate and compared two methods of assessing the coding of modulation, specifically, vector strength (VS) and the amplitude of the fast Fourier transform (FFT) component at the modulation frequency (i.e. F0 amplitude). We expected these comparisons would reveal different ways for assessing adaptation-related changes in modulation representation and show their relative strengths. To capture time-related effects, 50-ms epochs were used to analyze each measure across the 400-ms stimulus duration. While these epochs are too wide to capture response variability due to rapid changes in the carrier, it is adequate to show time-dependent trends along a scale of interest relative to the coding of speech tokens across a 400-ms interval. We also collected the electrically evoked compound action potential (ECAP) thresholds in order to relate the ANF data to a gross potential measure that has clinical relevance.
Methods
Animal preparation
Experimental subjects were six adult cats free of middle ear infection. Animal anesthesia and maintenance, acute deafening, and surgical preparations were conducted as described in Zhang et al. (2007) and Miller et al. (2008a). Briefly, cats were sedated with intramuscular ketamine (22 mg/kg) and xylazine (1.1 mg/kg) and kept at surgical anesthesia level with Nembutal (8–13 mg/kg, i.v.). Atropine sulfate (0.04 mg/kg/8 h) was subcutaneously injected to reduce respiratory secretions and dexamethasone (1.0 mg/kg/12 h) was administrated to reduce brain edema. A Harvard Apparatus ventilator provided artificial respiration through a tracheal catheter. Vital signs (heart rate, non-invasive blood oxygen, core temperature, and expired partial pressure of CO2) were monitored throughout the experiment. The auditory nerve was accessed through the posterior fossa approach (Kiang et al. 1965). Acoustically evoked compound action potentials (ACAPs) were evoked using a symmetric biphasic electric pulse driving a Beyerdynamics DT48 earphone coupled to the external canal via a speculum. ACAPs were obtained using clicks with a maximum sound pressure level of 100 dB SPL (peak equivalent) to assess the effectiveness of deafening with intracochlear infusion of neomycin (10% w/v, 50 μl) administered prior to data collection. Elimination of measurable hair-cell mediated responses provided a means assessing responses due to electrical depolarization of ANF membranes. All procedures were approved by the University of Iowa Animal Care and Use Committee and complied with NIH standards.
Stimulus presentation
An eight-band nucleus-type electrode array (Cochlear Corp.) was inserted through the round window into the basal turn of scala tympani to a depth of about 5.5 mm and fixed in place. The most apical band was used to deliver electric current in a monopolar configuration, with a needle electrode in muscle providing the return path. Stimuli were generated by a battery-powered, optically isolated, current source with capacitive coupling. The current source was driven by an Instrutech Corporation ITC-18 data acquisition board with 16-bit digital-to-analog converter (100,000 samples/s) and controlled by custom-made programs based on LabVIEW software. Stimulus currents were monitored on an oscilloscope through an optically isolated path and are reported as baseline-to-peak amplitudes.
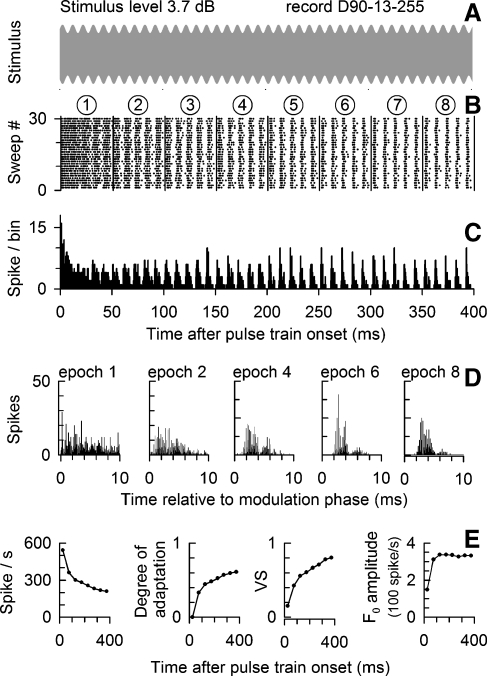
Experimental stimuli were biphasic electric pulse trains (cathodic-first, 40 μs/phase pulses, 5,000 pulse/s rate, 400 ms duration train) modulated by sinusoids at a frequency of 100 Hz and a starting phase of 0°. Our broad experimental plan calls for studies of the effects of modulation depth and frequency. This study focused on analyses of three measures of ANF responses (spike rate, VS, and F0 amplitude) and how they varied as functions of time (using the 50 ms epochs) and changes in stimulus level. As noted before, initial spike rate was chosen as a means of assessing stimulus-level effects across a group of ANFs, as fibers will exhibit a range of electric thresholds, presumably due to the across-nerve gradient in stimulus strength and ANF fiber diameter (van den Honert and Stypulkowski 1987a; Miller et al. 1999b). Pulse trains were presented repeatedly (typically 30 times) to obtain ANF firing statistics, with a 900-ms silent period between trains. Contact time permitting, ANF responses were examined at several levels to explore dynamic range effects. Figure 1A illustrates an example of a SAM electric pulse train with a 400-ms duration. The envelope of the SAM pulse train was defined as:
 |
where A is the amplitude of the unmodulated pulse train (the carrier), md is the modulation depth, fm is the modulation frequency and t is time after stimulus onset.
FIG. 1.
Exemplar data from a cat ANF showing basic outcome measures of this study. The modulated stimulus, the ANF dot-raster plot, and PSTH are shown in A, B, and C, respectively, for a 5,000 pulses/s, SAM electric pulse train at 10% modulation depth and 100 Hz modulation frequency. Stimulus level is 3.7 dB above the ANF threshold (defined in the text). Vertical lines in B denote 50-ms epoch boundaries. The plots in D show PHs (based on the modulator period) for five selected 50-ms epochs. Summary data, shown in E, plot spike rate, the degree of adaptation, VS, and F0 amplitude for each 50-ms epoch.
ECAPs were recorded using a bipolar electrode combination (described in Zhang et al. 2007) that was bathed in Ringers solution. A forward-masking technique was used to reduce the stimulus artifact (Brown and Abbas 1990). Prior to collection of ANF data, an ECAP amplitude-level function was obtained. Search stimuli for single-fiber recordings were then set at levels that evoked ECAP amplitudes between 75% and 100% of the maximal (saturation) ECAP amplitude to presumably activate a majority of ANFs during the search procedure. The search stimuli were single 40 μs/phase biphasic pulses presented at 30 pulses/s, which was the same stimulus used for ECAP recordings.
Data acquisition
Action potentials were recorded using standard micropipette techniques. Glass micropipettes (FHC #30-31-0, 1.2 mm O.D., 0.9 mm I.D.) were made using a Sutter P-97 puller and filled with 0.15 M KCl solution with 0.05 M tris buffer. Impedances ranged from 50 to 80 MΩ. Pipettes were advanced through the nerve trunk using a Narishige microdrive in 1 μm steps. A needle electrode within occipital muscle served as the return electrode for the monopolar micropipette. Potentials were amplified (10×) and filtered (first-order 10 kHz low pass) by an Axon Instruments Axoprobe amplifier. Additional filtering was provided by a 2-pole Butterworth high-pass filter (100 Hz cut-off) and a 6-pole Butterworth low-pass filter (30 kHz cut-off). A Hum Bug 50/60 Hz Noise Eliminator (Quest Scientific Instruments Inc.) was used to reduce power-line noise prior to sampling and storage with 16-bit resolution at 100,000 samples/s. Stimulus and recording clocks were synchronized. All data within a 4-ms epoch (from the onset of each stimulus) for ECAPs and a 1,000 ms window for ANF pulse train responses were stored digitally for later analysis. The longer (1,000 ms) window used to record ANF responses provided additional time to check for spontaneous activity with low or no stimulus present. Those rare occurrences were not included in subsequent data analyses.
Data analysis
Spike analyses were conducted after each experiment using software programs written in-house using MATLAB routines. Prior to spike picking, a moving boxcar filter was used for stimulus artifact reduction (Litvak et al. 2003a and b). In most cases, stimulus artifact was effectively eliminated to facilitate peak-picking and our software provided for visual inspection of all recordings to better assure accurate picks. Dot-raster plots, post-stimulus time histograms (PSTHs) and period histograms (PHs) were created for each record with a 0.1-ms bin resolution.
VS relative to the modulator period is calculated for each 50-ms epoch according to the following equation (Goldberg and Brown 1969):  , where n is the number of spikes per analysis epoch, θ is 2π (spike latency/stimulus period). A minimum of eight spikes were required for the computation of all VS measures reported here. The FFT for each 50-ms epoch of a PSTH was computed using the MATLAB FFT function, with Hanning windowing applied prior to the FFT. A sinusoidal waveform with an amplitude of one spike/s was used to calibrate the FFT analysis against constants used by the FFT routine. FFT analyses revealed that the spectral component at the frequency of the modulator dominated the spectrum, while higher harmonics were typically below the noise floor. In this report, we used the F0 amplitude to characterize the temporal representation of the modulation waveform.
We present both exemplar and group data to show how nerve fiber responses (i.e., degree of adaptation, etc.) vary with stimulus level or spike activity. As noted above, across-fiber variations in threshold are likely due to the stimulus field and fiber diameter. In our group analyses, we treat fibers using the assumption that they have similar response characteristics for electric stimulation (Kiang and Moxon 1972). Some of our group analyses examine independent variables as functions of spike output rather than electric threshold in order to reduce the degree of across-fiber data variability due to the aforementioned factors. To characterize across-fiber trends as a function of level, we express stimulus level in decibels relative to each cat's ECAP threshold, with the latter defined by the lowest stimulus level at which a response could be identified using more than 100 averages. In some analyses, we alternatively define ANF threshold as the level required to elicit a spike rate of 100 spike/s within the first 50 ms epoch. This sometimes required linear regression to provide interpolation or extrapolation to the 100 spike/s point.
Statistical analyses were conducted to determine significant differences of ANF responses observed between modulated and unmodulated stimulus conditions. To simplify the characterization of adaptation-related changes in ANF responses, comparisons were made using spike-rate measures obtained from final 50-ms epochs. Significance values were adjusted with Bonferroni correction to account for multiple t tests applied to a single outcome measure.
Results
General description of the data
This report is based upon data from 72 ANFs of six cats. Of that set, 64 ANFs contributed 174 PSTHs for modulated stimuli and 105 for unmodulated stimuli. Due to fiber contact-time limitations, it was often not possible to collect within-fiber data for both modulated and unmodulated stimuli. Thus, 48 ANFs contributed “modulated” data and 31 fibers contributed “unmodulated” data and group analyses were used to assess modulation effects. As we used the high-level search stimuli and sought to study level effects, ANF response rates (assessed for the first 50 ms epoch) varied from 5.3 to 972 spikes/s. Across cats, the mean ECAP threshold was 0.43 mA with a 0.05 mA standard deviation. In order to examine ANF responses across response rates, we defined four data sub-groups based upon the firing rate within the first epoch: R1 (5–150 spikes/s), R2 (150.1–270 spikes/s), R3 (270.1–400 spikes/s), and R4 (400.1–972 spikes/s). The ranges were chosen such that each “R” category had approximately equal number of records in each. Thus, data from group R1 reflect fibers in the lowest part of their dynamic range, while the R4 group covers responses at rates closest to saturation. Exemplar results are presented in the first three figures, while an effort to relate the ANF data to levels used in clinical devices is presented in Figure 4. Across-fiber group trends are presented in Figures 5, 6, and 7, while the remaining figures examine inter-relationships among the ANF measures.
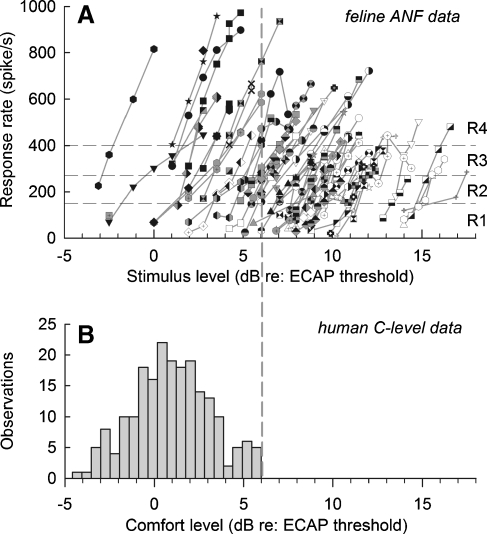
FIG. 4.
A comparison of cat ANF rate-level functions (A) and stimulus levels used for human prosthetic stimulation (B) is made by the use of ECAP data obtained from both species. The top graph shows rate-level functions for all ANFs based on spike rates obtained in the first 50-ms epoch and levels referenced to each cat's ECAP threshold (see text). The boundaries of the four “R” rate categories used in this paper are indicated by the horizontal dashed lines. The bottom histogram shows the distribution of maximum comfort (or “C”) levels for 43 human ears implanted with the Nucleus 24 M device, with each ear providing an average of 4.9 data from different stimulus electrodes of each implanted array. The histogram indicates that, in most cases, C levels exceed ECAP threshold, while the vertical dashed lines indicate that the upper limit for C levels (6 dB re: ECAP threshold) encompasses the lower range of ANF rate-level functions. However, it is important to note that ANFs within that lower range of levels can achieve high spike rates. This comparison leads to the conclusion that it is likely that human prosthetic stimulation typically evokes activity from low-threshold fibers that, in some cases, can achieve high spike rates that cover all four “R” groups of this study.
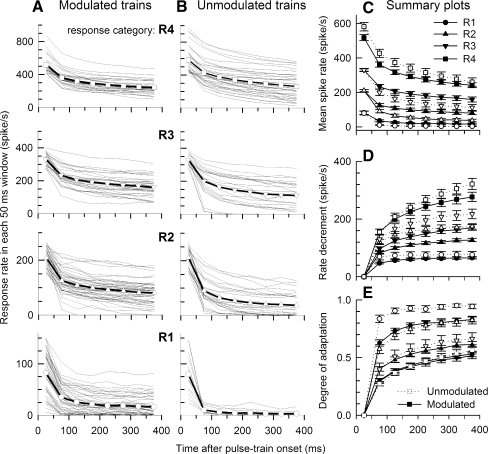
FIG. 5.
Group and individual spike rate data of modulated (column A) and unmodulated (column B) stimulus pulse trains for four response rate groups over time. The four response rate groups (R1–R4) were determined using rates computed over the initial 50 ms (onset) analysis window. Individual ANF data (thin lines) and group trends (open symbols with solid lines) are plotted as a function of time after stimulus onset. Mean (across-fiber) rate-vs-time functions for both modulated and unmodulated trains are shown in C for the four onset-rate categories indicated by different symbols. Error bars on the symbols indicate standard errors of the means. Mean absolute rate decrements and mean “degree of adaptation”, or normalized rate decrements for the two stimuli and the four rate groups are plotted in D and E, respectively.
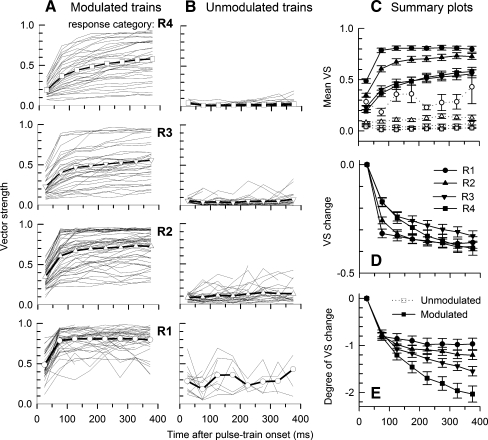
FIG. 6.
Group and individual-fiber VS data between modulated (A) and unmodulated (B) stimulation for four rate groups over time. The mean plots shown in columns A and B are also shown in C to afford more direct comparisons. Error bars on the symbols indicate standard errors of the means. The plots for unmodulated trains (B) are essentially indicators of measurement noise. D plots absolute VS change over time and E plots mean “degree of VS change” over time for modulated stimuli.
FIG. 7.
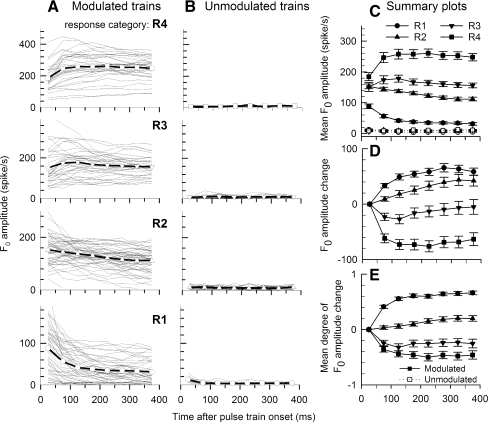
Group and individual F0 amplitudes plotted versus time for modulated (A) and unmodulated (B) stimulation for four rate groups over time. The data are presented in the same manner as those presented in Figure 5.
Examples of changes in response over stimulus duration
Across-train changes in ANF responses to modulated trains are evident in the plots of Figure 1 for an exemplar fiber stimulated at 1.5 mA (3.7 dB above the ANF threshold). The dot-raster plot (Fig. 1B) clearly shows modulated spike activity matching the modulation rate, accompanied by spike-rate reductions that, while large within the first 50 ms, continue throughout the 400-ms response, consistent with responses to constant-amplitude trains (Zhang et al. 2007). Modulated activity is also seen in the PSTH (Fig. 1C). Responses within the first 50-ms epoch are strongly shaped by refractory effects, resulting in spike timing unrelated to the modulator and, hence, relatively poor synchronization. This influence of refractoriness on stimulus coding is likely influenced by stimulus level (Miller et al. 2008a). PHs relative to the modulator period are shown in Figure 1D for five selected 50-ms epochs. Note the narrowing of their phase distributions across time (Fig. 1D), consistent with more dominant synchronization to the modulator. However, double spiking, presumably a result of the refractory property, is evident in some intervals, (i.e., the fourth and sixth 50-ms epochs) and contribute to broader temporal distributions.
These changes across the stimulus duration are quantified by measures of spike rate, degree of adaptation, VS, and F0 amplitude in Figure 1E. This example illustrates a general trend of successive reductions in spike rate, and hence, increases in the degree-of-adaptation measure. Furthermore, VS generally increases over time, consistent with the narrowing temporal distribution of spike activity. The trend in F0 amplitude is typical of what we observe at relatively high stimulus levels where there is an initial increase in F0 amplitude that is maintained throughout the stimulus duration. We note here, as in subsequent figures, that VS and F0 amplitude have different temporal trends or different relationships to rate adaptation.
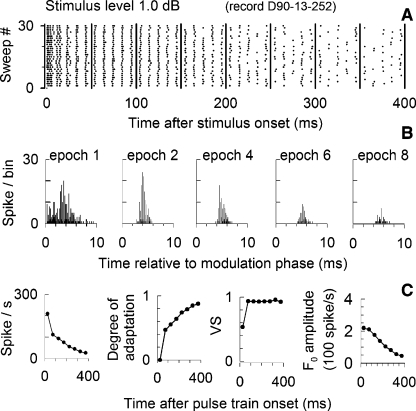
Figure 2 illustrates data from the same fiber as in Figure 1, but obtained at a lower stimulus level (1.0 dB re threshold). The format of Figure 2 is similar to that of Figure 1 showing the dot-raster plot (Fig. 2A), selected PHs (Fig. 2B) and plots of four outcome measures over the stimulus duration (Fig. 2C). Spike rate is clearly lower at the lower stimulus level and the degree of rate adaption across time is greater than that shown in Figure 1, consistent with data obtained using unmodulated trains (Zhang et al. 2007). The dot-raster plot shows rate reductions across time such that the modulation frequency is represented by multiple spikes over the first 50 ms and by single spikes over later periods, and again, is consistent with increasing VS values (Fig. 2C). Across time, VS approaches its maximum value of 1 and saturates. This pattern contrasts with the increasing pattern observed in Figure 1. Another difference relative to the high-level responses of Figure 1 is that F0 amplitude decreases over time. This contrast is consistent with general across-fiber trends in which F0 amplitude increases over time at high effective stimulus levels but decreases over time at lower stimulus levels.
FIG. 2.
Analysis of responses from the same fiber as in Figure 1, only using a lower stimulus level of 1.1 mA (1.0 dB re: ANF threshold). Dot raster, period histograms, and PSTHs are shown, using the same format as in Figure 1.
Examples of level effects on outcome measures
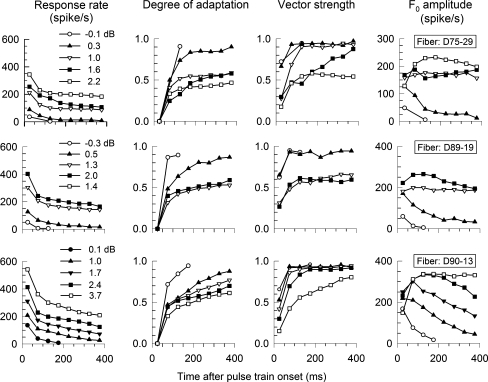
Figure 3 presents across-time changes in spike rate, adaptation, VS, and F0 amplitude for three fibers of 3 animals, but now includs a family of curves for different stimulus levels. Across ANFs, spike rate decreases across time and increases with stimulus level. Consequently, the degree-of-adaptation measure shows greater adaptation at lower levels. VS consistently increases over the stimulus duration and also increases with decreasing level. At low levels (and with stronger the degree of adaptation) VS tends to saturate, consistent with the VS trends shown in Figures 1 and 2. In contrast, F0 amplitude shows different trends as level is changed. Generally, as level was increased, F0 also increased. At lower levels, F0 amplitude tends to monotonically decrease over time. With increases in level, the F0 amplitudes assumed a more complex shape, with some (at the higher stimulus levels) demonstrating an early period of amplitude increase and, in most cases, a subsequent period of amplitude decrease.
FIG. 3.
Example ANF data sets obtained from three fibers of three animals. Stimuli are same as Figure 1 with different levels. Stimulus levels and fiber's code are indicated in the graph. The thresholds of fiber D75-f29, D89-f19, and D90-f13 are 1.17, 1.04, and 0.98 mA, respectively. Plot format is same as Figure 1E. Graphs in each column indicated by A, B, C, and D, have same parameters. Each row of plots presents data from one fiber.
Relationship between ECAP thresholds and dynamic ranges of ANFs
As ECAP thresholds can be obtained from human implant users and animal subjects, we sought to exploit this measure to investigate the relationship between the range of levels that excited our population of ANFs and the minimum level needed to evoke an ECAP in humans. This information will also help in the interpretation of the clinical relevance of each of the four response-rate (“R”) categories and stimulus level. Figure 4A plots rate-level data for all 72 ANFs, with levels expressed relative to each cat's ECAP threshold. Spike rates were computed over the first epoch. Dashed horizontal lines indicate the boundaries of the four “R” (response rate) categories. Most ANF responses were evoked at levels at or above ECAP threshold, which is not surprising as high search levels were used to evoke responses from a wide range of ANFs within each nerve. Note that, for a range of levels from about 0 to 12 dB, each of the four “R” categories are well represented. Overall, the feline functions suggest a general trend for greater spike-rate limitation for higher threshold ANFs, a trend consistent threshold-related adaptation reported by Zhang et al. (2007). The broad distribution of ANF rate-level functions is consistent with estimated 12–20 dB ranges of ANF thresholds within the feline auditory nerve (van den Honert and Stypulkowski 1987a; Miller et al. 1999b).
An important question concerns the degree to which the ANF data of our study may relate to ANF activity in human cochlear-implant users. Figure 4B plots a histogram of “maximum comfort” (or “C”) levels obtained from 44 ears of 42 human users of the Nucleus 24M device using previously published clinical data (Miller et al. 2008b). That data, collected using 250 pulse/s trains, has been converted to mA units and expressed relative to each subject's ECAP threshold. Note that the C levels ranges from −5 to 6 dB relative to each user's ECAP threshold. Comparison of this C-level histogram and the ANF functions suggests that each of the four “R” groups may be represented by ANF activity evoked by prosthetic stimulation of the human nerve, e.g., some fibers respond at low rates while others are rate saturated. Thus, the four R groups of this study are pertinent to response conditions possible in human implant users. Of course, it is also likely that a majority of ANFs are unstimulated for any given prosthetic stimulus or stimulus channel, consistent with the observation that human ECAP thresholds are near the programmed C levels. That observation is consistent, however, with our supposition that prosthetic stimulation of human ANFs may result in a wide range of response rates.
Rate adaptation trends across time and response-rate categories
The rate-vs-time functions of Figure 5 illustrate ANF response trends across the four response-rate groups. Spike rate vs time for individual ANFs (line segments) and mean data (open symbols) for each response rate group are plotted in Figure 5 for modulated trains (Fig. 5A, first column) and unmodulated trains (Fig. 5B, second column). Figure 5C summarizes the functions of Figure 5A, B by plotting mean spike rates with standard errors of the means for both modulated and unmodulated trains. Figure 5D, E summarize the absolute rate decrement and normalized degree-of-adaptation measure for modulated and unmodulated trains. In all cases, mean spike rates decrease across the 400-ms stimulus durations. Similar to the exemplar data of Figures 1, 2, and 3, the summary plots indicate that the greatest adaptation occurs within the first two 50-ms epochs, with smaller decrements in later intervals. These trends are consistent with the double-exponential decay models reported for constant-amplitude electric trains (Zhang et al. 2007).
While spike rates decrease across time in all cases, Figure 5C shows that mean spike rates are, for all but the highest response category (R4), greater for modulated stimuli (open symbols) than for unmodulated stimuli (filled symbols). Related indices of rate decrement and degree of adaptation (Fig. 5D, E) also indicate that rate adaptation to SAM trains is generally less than that to unmodulated trains. Statistical significance of the difference between rate adaptations to SAM trains and to unmodulated trains was examined with two-tailed Student's t test based on spike-rate measures of the final 50-ms epoch. Adjusted P values were obtained by multiplying by 4 according to the Bonferroni correction due to four rate groups being tested. It is evident that the differences between modulated and unmodulated stimuli are significant in the low and moderate rate groups (R1 and R2, the adjusted P value =0.000078 and 0.000083, respectively), but not in higher groups (R3 and R4, both adjusted P values > 0.05).
Changes in VS over time and across rate categories
Group and individual VS data are plotted in Figure 6 following the approach of Figure 5. With modulation (column A), for each rate group (and in particular groups R3 and R4), the VS functions are widely distributed across possible values. For rate groups R1 and R2, there is still across-fiber variability, but the data show ceiling effects and the mean-value plots assume higher values. In all cases, there are trends toward higher values over time, with the largest change occurring between the first and second intervals, reflecting progressive loss of firing based on refractory periods. That is, initially, the inter-spike intervals are strongly influenced by intervals related to refractoriness and subsequent recovery, rather than by the intervals associated with modulation or pulse rate (Zhang et al. 2007). As expected, VS for unmodulated trains (Fig. 6B) was typically low, reflecting the noise floor of our VS measures. Some VS plots for unmodulated stimuli show relatively higher VS ‘noise’, particularly for rate groups R1 and R2. They reflect the relatively low spike rates and rate adaptation associated with these lower rate groups. Also, VS shows correlation with spike rates for the low-rate responses. For example, VSs higher than 0.2 occur in most cases for intervals with rates less than 20 spikes/s. Due to high spike rates and less rate adaptation, the VS noise floors for rate groups R3 and R4 are close to zero.
Figure 6C plots mean VS for both modulated and unmodulated stimuli. For the lowest spike-rate group (R1), VS approaches a saturation value of 0.8, reflecting the influence of across-ANF variability in VS (i.e., Fig. 6A, bottom plot). Mean VS for the higher rate groups also increase with time, but approach “saturation” levels less than 0.8, reflecting the greater across-ANF variability in VS for the higher R groups. Upon examining the saturating functions among the individual plots of Figure 6C, it was found that the saturating VS functions corresponded to responses that had relatively high degrees of rate saturation. Finally, note that the mean functions for groups R3 and R4 are similar, suggesting that modulation ‘saturation’ effect occurs for higher spike rates. This effect and the relationship between VS and spike rate are addressed below.
Figure 6D plots the absolute VS change over time for the four rate groups for modulated stimuli. The largest VS changes occur during the “early” stage, between epochs 1 and 2. For the low-rate (R1) group, while the amount of “early” VS change is the greatest among the four R groups, VS for this group undergoes relatively smaller decrements across the later epochs. While VS changes tend to decrease for higher rate groups, VS changes over the whole train duration do not show clear trends across the rate groups. For consistency with the Figure 5 plots, Figure 6E plots the “degree of VS change” which is the VS change normalized to the initial VS value. In these measures, the “early” changes are nearly identical across the four rate groups. The trends for asymptotic (or final) changes are clearly related to the onset spike rates, with the degree of final VS change increasing as a function of the spike rate (or rate category).
Changes in F0 amplitude
Group and individual F0 amplitude data are shown in Figure 7, following our format for data presentation. As expected, F0 amplitudes for unmodulated trains (Fig. 7B) are nearly zero across the stimulus duration. With modulation, the F0 amplitudes for individual ANFs of each of the rate groups (Fig. 7A) demonstrate a wide degree of across-record variability. However, some trends can be seen in the mean plots. Mean F0 amplitudes increased across the four rate groups, as expected (Fig. 7C). However, in contrast to VS, F0 amplitudes for the modulated trains (Fig. 7A, C) show different temporal trends across the four rate groups. For lower initial rates (R1 and R2), F0 amplitudes decrease over time, while for the two higher rate groups (R3 and R4), increasing trends with time are similar to the VS trends.
For individual ANF data in Figure 7A, we noted some records, especially those within moderate rate groups (R2 and R3), with flat F0 amplitudes functions over time. Similar examples can also be seen in Figure 3, for fiber D75-f29 at a 1.3 mA (1.0 dB re threshold) stimulus level and fiber D89-f19 at a 1.2 mA (1.3 dB re threshold) stimulus level. We propose that the flat functions occur when a fiber is stimulated at levels near the middle of its dynamic range or have relatively wide dynamic ranges. The notion is that, at such stimulus levels, the stimulus modulations fall within the fiber's dynamic range, producing good representation of F0. If rate adaptation is not strong, this favorable encoding may persist across the pulse-train duration. We will introduce a simple adaptation model in the “Discussion” section to illustrate this change.
Following the approach used in Figures 5 and 6, absolute “F0 amplitude change” and “degree of F0 amplitude change” over time for modulated stimuli are plotted in Figure 7D, E, respectively. These two measures undergo similar changes across time in that large changes are observed across the “early” time interval, while smaller changes are observed across the later analysis epochs. F0 amplitude over stimulus duration either increases (higher onset spike rate) or decreases (lower onset rate). The largest changes occur at the higher or lower onset rate (R1 and R4).
Correlation of rate adaptation, VS, and F0 amplitude with initial spike rate
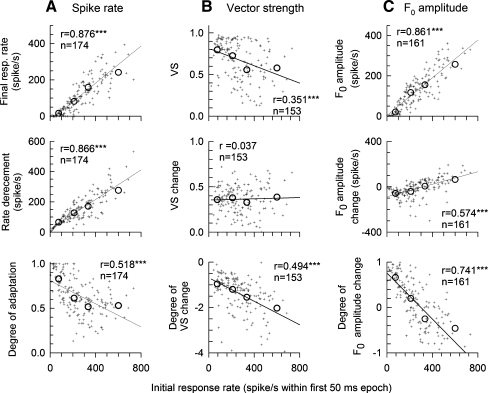
In the previous presentation of data (Figs. 5, 6 and 7), several trends across time and the four rate categories were noted. As the use of categories mask the degrees of across-observation variance, we present both raw ANF data and the categorical data to see how each are influenced by initial spike rate, As noted above, initial spike rate can be used as a proxy for stimulus level and provide a means of factoring out across-fiber variations in threshold and combining ANF data. In Figure 8, the nine dependent variables (plotted in panels C, D, and E of Figs. 5, 6, and 7) are plotted versus initial spike rate for the raw data and categorical “R” data. The data are based upon the responses to the modulated trains. Each dependent variable is based either on a measure obtained from the eight 50 ms epoch (top plots), differences in measures from the 8th and 1st epochs (middle row of plots) and normalized differences (bottom plots). These plots not only provide summaries of how the outcome measures for individual ANFs are correlated with initial rate, but also provide a check on the degree to which the rate categories reflect general trends. For each of the nine plots, linear regression was computed over the set of individual-ANF data and the number of ANFs contributing to each set is indicated.
FIG. 8.
Summary of the effects of onset spike rate on rate adaptation (A), VS (B), and F0 amplitude (C). Three outcome variables of each measure are plotted in each row. While all the measures were computed for the asymptotic (final) analysis window, the data are plotted versus onset spike rates. Individual data are plotted using small symbols. The large circle symbols within each graph represent mean values obtained over the four rate groups (R1, R2, R3, and R4). Line segments indicate linear regression solutions. The correlation coefficient (r value) of each regression analysis is indicted in each plot. Except for “VS changes”, all outcome measures are significantly correlated to the initial spike rates.
Figure 8 makes it clear that the four R categories provide reasonably representative depictions of overall ANF data trends as functions of initial rate. In some cases (e.g., degree of adaptation vs. initial spike rate), the four values reveal nonlinear trends not captured by linear regression. In cases of data having ceiling effects (e.g., VS vs initial spike rate), variance is clearly not constant across rates and that measure shows relatively poor linear correlation with initial spike rate. Tests of the statistical significance of the linear correlations, using Bonferroni correction for the use of nine tests, indicate that all outcome variables with the exception of “VS change” are correlated with initial spike rate, with error probabilities all less than 0.000001). Only “VS change” does not indicate dependence on initial spike rate, perhaps because VS itself is already normalized against spike counts and the second normalization increases the noise of the scatter plot.
Correlation of VS, and F0 amplitude with rate adaptation
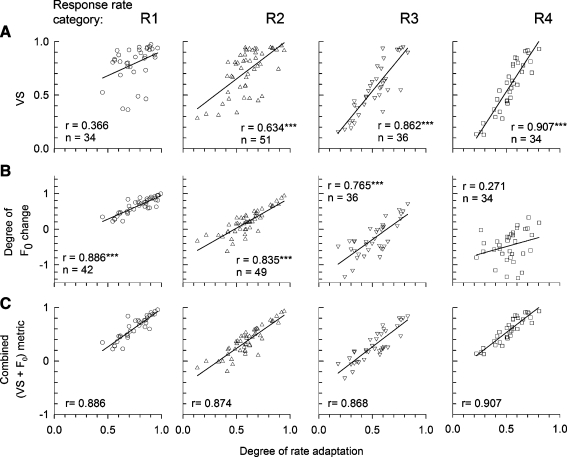
Another basic goal of this paper is to demonstrate how the temporal response measures of VS and F0 amplitude vary as a function of the degree of rate adaptation. This is examined in Figure 9, where VS and the normalized “degree of F0 change” are plotted versus “degree of rate adaptation” in rows A and B respectively for each of the four rate categories (R1–R4). Note that, as is the independent variable, both outcome variables are unitless as they are normalized against spike rate or spike count. Linear regression is applied to all eight scatter plots. Generally, both VS and the normalized F0 measure show strong correlations with the degree-of-adaptation measure, although in complementary ways. For the F0 measure, the linear correlations become weaker as the rate category is incremented from R1 to R4, whereas VS shows the weakest correlation for R1 and the strongest correlation for R4. Using Bonferroni corrections for the eight different correlations, we found that six of the eight plots are strongly correlated (with error probabilities <0.00001), while the weakest correlations (row A, R1 and row B, R4) have error probabilities greater than 0.1. These plots suggest a way to improve the prediction of the effect of adaptation on temporal measures: use a two-component predictor based on VS and normalized F0. Figure 9C shows the results of the combined metric, made simply by adding VS and normalized F0, where high correlation coefficients are obtained across the four response-rate categories.
FIG. 9.
Scatter plots of VS (A), the degree of F0 amplitude change (C) and combined metric (i.e., sum of VS and degree of F0 amplitude change) (D) versus the degree of adaptation are shown for each of the four onset response rate groups (R1 to R4 column). Line segments indicate linear regression solutions. Plots that achieved statistically significant correlations are noted by the double asterisks.
Discussion
Spike-rate adaptation pattern to SAM pulse trains and level effects
Our previous work demonstrated that the rate adaptation pattern of ANFs responding to constant-amplitude pulse trains can be modeled by a two time-constant exponential decaying function (Zhang et al. 2007). Even with the relatively limited (i.e., 50 ms) temporal resolution of our study, the data suggest a similar, two-part, adaptation pattern for modulated stimuli, with rapid adaptation occurring within the first two 50-ms epochs and a short-term effect following the second epoch. Considering that the typical duration of speech tokens is on the order of several hundred milliseconds, the encoding of speech stimuli at the level of the auditory nerve is likely to be affected by the rate adaptation effects reported here.
We demonstrated that the effects of stimulus level on rate adaptation are similar for both modulated and unmodulated pulse trains. As is evident in individual (Fig. 3) and group (Fig. 5) data, increases in stimulus level or increases in onset spike rate tend to reduce the degree of adaptation. However, the degree of adaptation to modulated stimuli tends to be less than that to unmodulated stimuli when the two trains are matched for onset spike rate. This trend, shown in Figure 5, is significant for the two low-to-moderate response rate categories. For initial spike rates higher than 270 spikes/s (i.e., rate groups R3), we observed no significant difference in the degree of adaptation between the two stimuli, presumably due to decreased adaptation typically evident when fibers are driven to higher rates (Zhang et al. 2007).
We propose that the differences in adaptation observed between modulated and unmodulated trains can be explained by considering the limited dynamic ranges of fibers. At lower stimulus levels, only part of the cycle of a modulated pulse train may excite a given ANF. Relative to unmodulated trains, modulated stimuli would drive the fiber at lower overall response rates that would likely result in less adaptation. In contrast, at higher stimulus levels, the ANF would respond over the whole range of the modulation period. However, if the fiber responded at least partly in the saturated region of its rate-level function, there would be less variation in the response across the train duration than that predicted by the modulated train, resulting in degrees of adaptation similar to those observed with unmodulated trains. This notion is confirmed in Figure 8A, where the degree of adaptation was shown to decrease with increasing initial spike rate. At the highest spike rates, there is little further change in the degree of adaptation. It can be expected that a potential advantage of less adaptation at the lower effective stimulus levels is to increase dynamic range of an ANF, thereby improving the modulation coding over a stimulus duration.
Modulation coding by ANFs: effects of level and stimulus duration
Modulation coding by an ANF was measured by VS and F0 amplitude. VS generally decreased with increasing initial spike rate (increasing stimulus level) and tended to increase across stimulus duration for all stimulus levels (Figs. 3 and 6). In contrast, F0 amplitude increased with increasing initial rate and shows different trends across stimulus duration (Figs. 3 and 7) depending upon response rate. VS tends to approach saturation values at lower spike rates, while F0 amplitude tends to approach the saturation level at high spike rates.
These response patterns can be interpreted in light of a simple adaptation model in which ANF response threshold increases across an adapting stimulus. For example, the period histograms of Figures 1 and 2 show that spikes occur over narrower ranges within the modulation period as the fiber adapts across time. This contrasts with the observations using electric sinusoidal stimuli in which the spike distribution with the sinusoidal period widened as stimulus level was decreased (van den Honert and Stypulkowski 1987b). One likely reason for this difference is our use of partial (10%) amplitude modulation of the carrier. For amplitude-modulated trains at 10% modulation depth, the whole range of a sinusoidal waveform can be above a fiber's threshold, but as threshold increases (due to rate adaptation), the ANF could begin to response within the range of modulation coding.
Modeled responses to SAM trains
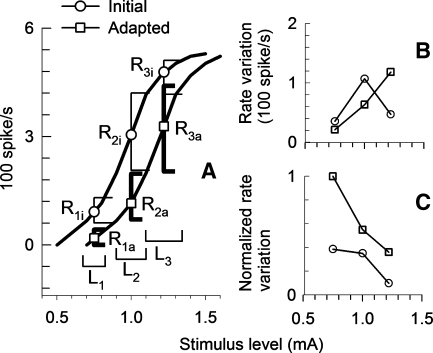
We present a simple adaptation model for a quantified description of how ANFs with adaptation may code SAM pulses. The model assumes nonlinear growth of ANF responses that have sigmoidal shapes. The model of Figure 10 assumes that the rate-level function of a fiber shifts from “initial” to “adapted” functions over the course of rate adaptation. The model output will be discussed by considering the current ranges of three stimuli, indicated by the three horizontal bars in Figure 10A. For the lowest stimulus level, the stimulus waveform varies with modulation across the lower part of the ANF's rate-level curve during the “initial” (unadapted) period, indicated by horizontal bar L1. The initial range of response rates would be over the lower part of the “initial” curve, indicated by vertical bar R1i. With rate adaptation, the rate-level curve shifts to the “adapted” curve and only part of the stimulus excursion remains above threshold, resulting in a diminished range of response rates, indicated by the shorter vertical bar R1a. In this case, adaptation results in partial coding of the cycle of modulation, resulting in a decrease in F0 amplitude across the train duration.
FIG. 10.
An adaptation model for interpreting the changes in modulation coding is illustrated. A The left curve within A is a modeled spike-rate growth function for the initial 50-ms epoch of a fiber in response to unmodulated trains, adapted from cat data. The right curve simulates an adapted growth function, which is shifted in sensitivity relative to the unadapted curve. Three different stimulus levels and corresponding 10% modulation ranges are indicated by horizontal bars L1, L2, and L3, respectively. Spike-rate variation ranges are indicated by perpendicular bars. The ranges R1i, R2i, and R3i represent predicted modulated spike rates in the initial period (the 50-ms epoch) for stimulus levels L1, L2, and L3, respectively. The ranges R1a, R2a, and R3a represent predicted modulated spike rates in for the same levels in the adapted case. B The range of spike-rate variation as a function of stimulus level. C The spike-rate variation normalized to average rate as a function of stimulus level. Unadapted and adapted data are indicated by circle and square symbols, respectively.
At a moderate stimulus level (L2), modulated stimulus waveforms are completely within the dynamic ranges for both initial and adapted conditions; however, adaptation can modify the rate-level slope as indicated in Figure 10A. At the highest of the three depicted stimulus levels (L3), saturation or refractory effects limit rate variation during the initial part of the stimulus, as the modulated stimulus waveform exceeds the initial dynamic range and results in a smaller range of rate variation (R3i). In this case, with rate adaptation, the stimulus level variations now fall within the fiber's dynamic range due to the shift in growth function sensitivity, which results in a higher rate variation (R3a).
Figure 10B plots spike rate variation and Figure 10C plots the spike rate variation normalized to average spike rate for the three stimulus levels presented in the model. It can be assumed that absolute spike rate variations (Fig. 10B) and normalized spike rate variations (Fig. 10C) would be analogous to F0 amplitude and VS, respectively (Goldberg and Brown 1969; Young and Sachs 1979; Sachs and Young 1979; Sinex et al. 2003). In fact, the trends with modeled level are consistent with the trends observed in the plots of Figures 3, 6, and 7. Specifically, rate variation increases with stimulus level. Rate adaptation results in a decrease of rate variation at low stimulus levels and an increase at high stimulus levels. Normalized spike rate variations decrease with stimulus level and increase with rate adaptation across all stimulus ranges.
We recognize that, although this model is useful in understanding data trends obtained under the stated modulation conditions, it clearly does not account for dynamic properties of amplitude modulation responses. For instance, responses are likely to be highly dependent on modulation frequency and carrier rate due to varying effects of adaptation and refractoriness. Further studies are needed to characterize responses to these variables as well as to different modulation depths.
Efficacy of VS and F0 amplitude for assessing ANF responses to SAM pulse trains
VS is a measure normalized to average discharge rate which has been widely used for assessing stimulus-synchronized temporal discharge patterns throughout the auditory system (Goldberg and Brown 1969; Young and Sachs 1979; Sachs and Young 1979; Sinex et al. 2003; Middlebrooks 2008). The measure of F0 amplitude reflects the degree to which absolute spike rate variations follow the amplitude of the modulated stimulus. Which aspect of the neural response—and hence, which of the two measures—is more relevant to perception is debatable. Furthermore, as is shown in this report, the effects of adaptation on VS and F0 amplitude differ. Thus, not only do VS and F0 amplitude provide different means of assessing modulation coding, they may relate differently to the transmission of speech information in ANF responses.
If modulation information is transmitted to the central auditory system primarily based on VS, one would expect the modulation information encoded in ANFs will improve with adaptation, because VS was shown to be positively correlated with degree of adaptation (Fig. 9A). However, according to the level effects shown in Figures 3, 6, and 8, one would predict that the modulation coding will not be improved with increasing stimulus level. This is inconsistent with psychophysical findings in cochlear-implant users that show that higher carrier levels can improve modulation amplitude detection (Shannon 1992). This contradiction is likely related to the proposition that the distribution of spike activity across a nerve-fiber population is the main determinant of information transmission to higher levels of the auditory system. Classic work in the encoding of acoustic speech sounds has indicated that a population response is needed to transmit speech information (Young and Sachs 1979; Sachs and Young 1979). With electric stimulation, the limited of single fibers makes this issue particularly important in that across-fiber dynamic range is likely to be much greater than the within-fiber range.
However, if modulation information is transmitted to the central auditory system in a way that more closely follows F0 amplitude coding, one would predict improved modulation coding with increasing stimulus level, consistent with psychophysical trends of modulation detection. Also, according to the level effects indicated Figure 8C, one might expect a more complex time-changing pattern of modulation coding that depends upon the stimulus levels.
Thus, it is not possible to draw firm conclusions relative to the optimal characterization of ANF spike data in response to modulation. A broader study of modulation pulse trains may help address this issue. Nevertheless, a combination of the two measures, VS and F0 amplitude, may have some advantage in characterizing the responses across a wider range of stimulus conditions. As the scatter plots and regressions of Figure 9 indicate, VS may be more suitable than F0 amplitude for assessing the effect of rate modulation on the temporal representation of the modulator, particularly for high spike rates, where VS maintained a strong correlation with rate adaptation and F0 amplitude did not. In contrast, possibly due to a distortion effect on F0 amplitude at the higher spike rates, F0 amplitude may be a more suitable measure of the effects of adaptation on modulation response at low and moderate spike rates. The potential value of this “combined” approach was reflected in our combined metric of Figure 9 that used both VS and F0 amplitude information. Such a combined metric has the potential to capture the modulation response properties over a broad response range.
Relevance of ANF data to conditions within the electrically stimulated human ear
As noted above, we suggest that ensemble ANF coding may be particularly important in the case of electric stimulation of ANFs, which have much smaller dynamic ranges than what is typical with acoustic stimulation of the normal ear. Our comparison between cat ANF rate-level functions and human ECAP growth functions (Fig. 4) underscores this point. That comparison suggests that it is likely that only a minority of ANFs are stimulated by the current levels used in human auditory prostheses. However, implant stimulation can encompass a range of several decibels so that, among the excited fiber subpopulation, a range of spike rates will be represented. Thus, while the lowest threshold fibers may be saturated and fail to transmit stimulus modulations, ANFs with higher thresholds will transmit that information. Also, as indicated in Figure 4, even for a limited range of fiber recruitment, all 4 categories of response rates used in this study may be relevant to nerve stimulation through a clinical device.
There is another important difference between the state of nerve fibers in an acutely deafened cat and the typical CI patient. One might expect that there is a significant neuron loss which consequently has an effect on the population response. We might also predict however that there are some physiological changes in ANFs that are related to a long term deafness and neural degeneration. These may include changes in response time constant, refractoriness, integration and adaptation. Data from chronically deafened animals would be required to more directly address this issue.
Summary and conclusion
Responses of ANFs to SAM high-rate electric pulse trains with a duration similar to speech token showed an adaptation pattern similar to that of unmodulated stimuli, but with less rate adaptation. VS tends to decrease with overall stimulus level and also increases across the duration of the stimulus. F0 amplitude tends to increase with stimulus level, but tends to decrease with adaptation. However, these changes depend on spike rate. For lower onset spike rates, F0 amplitude decreases with time, while for high onset rates, it increases with time. VS and the degree of F0 amplitude changes are correlated to the degree of adaptation, except for the lowest spike rates for VS and the highest spike rates for F0 amplitude. These results suggest that a high-rate electric pulse train used as a carrier modifies the ANF’s representation of the stimulus waveform over time. Extending these observations to complex stimuli such as speech, one may expect that sequencing of phonemes may be particularly important in both the spikes rate but also the temporal representation of the stimulus. For instance, in some contexts, short duration stimuli could effectively convey stimulus modulation information. In other contexts, adaptation may prove useful in effecting changes in the dynamic range and producing a clear phase-locked response. To the extent that F0 amplitude correlates with perceptual abilities, these data suggest that adaptation may significantly affect our ability to detect modulations in running speech.
Acknowledgments
Funding of this work was provided by the National Institutes of Health (NIDCD) through grant R01-DC006478.
Contributor Information
Ning Hu, Phone: +1-405-9171270, FAX: +1-405-9476226, Email: ninghu@houghear.org, Email: ning-hu@uiowa.edu.
Paul J. Abbas, Phone: +1-405-639-2882, FAX: +1-405-947-6226, Email: paul-abbas@uiowa.edu
References
- Brown CJ, Abbas PJ. Electrically evoked whole-nerve action potentials: parametric data from the cat. J Acoust Soc Am. 1990;88:2205–2210. doi: 10.1121/1.400117. [DOI] [PubMed] [Google Scholar]
- Goldberg JM, Brown PB. Response of binaural neurones of dog superior olivary complex to dichotic tonal stimulation; some physiological mechanisms of sound localization. J Neurophysiol. 1969;32:613–636. doi: 10.1152/jn.1969.32.4.613. [DOI] [PubMed] [Google Scholar]
- Hartmann R, Topp G, Klinke R. Discharge patterns of cat primary auditory fibers with electrical stimulation of the cochlea. Hear Res. 1984;13:47–62. doi: 10.1016/0378-5955(84)90094-7. [DOI] [PubMed] [Google Scholar]
- Javel E, Tong YC, Shepherd RK, Clark GM.Responses of cat auditory nerve fibers to biphasic electrical current pulses Ann Otol Rhinol Laryngol 19879626–30.3813382 [Google Scholar]
- Kiang NY, Moxon EC. Physiological considerations in artificial stimulation of the inner ear. Ann Otol Rhinol Laryngol. 1972;8:714–730. doi: 10.1177/000348947208100513. [DOI] [PubMed] [Google Scholar]
- Kiang NYS, Watanabe T, Thomas EC, Clark LF. Discharge patterns of single fibers in the cat's auditory nerve. Cambridge: MIT Press; 1965. [Google Scholar]
- Litvak LM, Smith ZM, Delgutte B, Eddington DK. Desynchronization of electrically evoked auditory-nerve activity by high-frequency pulse trains of long duration. J Acoust Soc Am. 2003;114:2066–2078. doi: 10.1121/1.1612492. [DOI] [PMC free article] [PubMed] [Google Scholar]
- Litvak LM, Delgutte B, Eddington DK. Improved temporal coding of sinusoids in electric stimulation of the auditory nerve using desynchronizing pulse trains. J Acoust Soc Am. 2003;114:2079–2098. doi: 10.1121/1.1612493. [DOI] [PMC free article] [PubMed] [Google Scholar]
- Middlebrooks JC. Auditory cortex phase locking to amplitude-modulated cochlear implant pulse trains. J Neurophysiol. 2008;100:76–91. doi: 10.1152/jn.01109.2007. [DOI] [PMC free article] [PubMed] [Google Scholar]
- Miller CA, Abbas PJ, Robinson BK, Rubinstein JT, Matsuoka AJ. Electrically evoked single-fiber action potentials from cat: Responses to monopolar, monophasic stimulation. Hear Res. 1999;130:197–218. doi: 10.1016/S0378-5955(99)00012-X. [DOI] [PubMed] [Google Scholar]
- Miller CA, Abbas PJ, Rubinstein JT. An empirically based model of the electrically evoked compound action potential. Hear Res. 1999;135:1–18. doi: 10.1016/S0378-5955(99)00081-7. [DOI] [PubMed] [Google Scholar]
- Miller CA, Abbas PJ, Robinson BK. Response properties of the refractory auditory nerve fiber. J Assoc Res Otolaryngol. 2001;2:216–232. doi: 10.1007/s101620010083. [DOI] [PMC free article] [PubMed] [Google Scholar]
- Miller CA, Hu N, Zhang F, Robinson BK, Abbas PJ. Changes across time in the temporal responses of auditory nerve fibers stimulated by electric pulse trains. J Assoc Res Otolaryngol. 2008;9:122–137. doi: 10.1007/s10162-007-0108-5. [DOI] [PMC free article] [PubMed] [Google Scholar]
- Miller CA, Brown CJ, Abbas PJ, Chi S. The clinical application of potentials evoked from the peripheral auditory system. Hear Res. 2008;242:184–197. doi: 10.1016/j.heares.2008.04.005. [DOI] [PubMed] [Google Scholar]
- Moxon EC (1971) Neural and mechanical responses to electric stimulation of the cat's inner ear. Doctoral thesis, Department of Electrical Engineering, MIT, Cambridge, MA
- Rubinstein JT, Wilson BS, Finley CC, Abbas PJ. Pseudospontaneous activity: stochastic independence of auditory nerve fibers with electrical stimulation. Hear Res. 1999;127:108–118. doi: 10.1016/S0378-5955(98)00185-3. [DOI] [PubMed] [Google Scholar]
- Sachs MB, Young ED. Effects of nonlinearities on speech encoding in the auditory nerve. J Acoust Soc Am. 1979;63:858–875. doi: 10.1121/1.384825. [DOI] [PubMed] [Google Scholar]
- Shannon Temporal modulation transfer functions in patients with cochlear implants. J Acoust Soc Am. 1992;91:2156–2164. doi: 10.1121/1.403807. [DOI] [PubMed] [Google Scholar]
- Shepherd RK, Javel E. Electrical stimulation of the auditory nerve. I. Correlation of physiological responses with cochlear status. Hear Res. 1997;108:112–144. doi: 10.1016/S0378-5955(97)00046-4. [DOI] [PubMed] [Google Scholar]
- Shepherd RK, Javel E. Electrical stimulation of the auditory nerve: II. Effect of stimulus waveshape on single fibre response properties. Hear Res. 1999;130:171–188. doi: 10.1016/S0378-5955(99)00011-8. [DOI] [PubMed] [Google Scholar]
- Sinex DG, Guzik H, Li H, Sabes JH. Responses of auditory nerve fibers to harmonic and mistuned complex tones. Hear Res. 2003;182:130–139. doi: 10.1016/S0378-5955(03)00189-8. [DOI] [PubMed] [Google Scholar]
- Honert C, Stypulkowski PH. Physiological properties of the electrically stimulated auditory nerve: II. Single fiber recordings. Hear Res. 1984;14:225–243. doi: 10.1016/0378-5955(84)90052-2. [DOI] [PubMed] [Google Scholar]
- Honert C, Stypulkowski PH. Single fiber mapping of spatial excitation patterns in the electrically stimulated auditory nerve. Hear Res. 1987;29:207–222. doi: 10.1016/0378-5955(87)90168-7. [DOI] [PubMed] [Google Scholar]
- van den Honert C, Stypulkowski PH (1987b) Temporal response patterns of single auditory nerve fibers elicited by periodic electrical stimuli. Hear Res 29:207–222 [DOI] [PubMed]
- Young ED, Sachs MB. Representation of steady-state vowels in the temporal aspects of the discharge patterns of populations of auditory-nerve fibers. J Acoust Soc Am. 1979;66:1381–1403. doi: 10.1121/1.383532. [DOI] [PubMed] [Google Scholar]
- Zhang F, Miller CA, Robinson BK, Abbas PJ, Hu N. Changes with time in spike rate and spike amplitude of auditory nerve fibers stimulated by electric pulse trains. J Assoc Res Otolaryngol. 2007;8:356–372. doi: 10.1007/s10162-007-0086-7. [DOI] [PMC free article] [PubMed] [Google Scholar]


