

Abstract
Background
Obesity and asthma prevalence have both risen among children over the last several decades, and research efforts increasingly suggest that obesity is associated with asthma. Some, but not all, studies have shown that the effect of obesity on asthma is stronger among non-atopic individuals than among those with atopy. Systemic inflammation may be a factor in this relationship.
Objective
To examine the association of obesity with atopic and non-atopic asthma among U.S. children and to assess the role of C-reactive protein.
Design
Nationally representative data from the National Health and Nutrition Examination Survey (NHANES) were used to examine the relationship of weight to current asthma using logistic regression. Overweight was defined as ≥ 85th percentile of BMI-for-age and obesity was defined as ≥ 95% percentile of BMI-for-age. The presence of at least one positive allergen-specific IgE was used to stratify the relationship by atopic status in 2005-2006 data (n=3,387).
Setting and Participants
Stratified, multi-stage probability sampling was used to identify survey participants. This analysis includes children age 2-19 (n=16,074) from the 1999-2006 NHANES who have information on BMI and current asthma.
Main Outcome Measure
Self-report of doctor-diagnosed current asthma.
Results
Obesity was significantly related to current asthma among children and adolescents (OR: 1.68, 95% CI: 1.33, 2.12). The association was stronger in non-atopic children (OR: 2.46, 95% CI: 1.21, 5.02) than in atopic children (OR: 1.34, 95% CI: 0.70, 2.57)(interaction p-value=0.09). C-reactive protein levels were associated with current asthma in non-atopic children, but not after adjusting for BMI.
Conclusion
Excess weight in children is associated with higher rates of asthma, especially asthma that is not accompanied by allergic disease.
Keywords: Atopy, Obesity, Asthma, BMI
Introduction
Obesity and asthma prevalence have increased over the last several decades,(1, 2) and studies over the last fifteen years have suggested that obesity is related to asthma.(3-5) Some of these included children, but the majority were conducted in adults.
Evidence for an obesity effect in children has been less consistent than that in adults, hampered in part by different age ranges examined, different definitions of overweight and obesity, and different morbidity endpoints.(6) A recent meta-analysis found that the strength of the relationship between obesity and asthma in children appeared to be increasing over time with an overall effect of high body weight in childhood being associated with a relative risk of 1.5 for subsequent asthma and a 6.6% population attributable risk for asthma due to overweight.(7)
Several studies have found that obesity was more strongly related to non-atopic than to atopic asthma in adults.(8, 9) In the National Health and Nutrition Examination Survey (NHANES) III dataset (1988-1994), obesity was related to childhood asthma, but no difference was observed in the relationship between obesity and asthma by atopic status, as assessed by skin prick tests.(10)
Butland et al. found that C-reactive protein (CRP), a marker for systemic inflammation, was related to asthma (but only among non-atopics), and that the association became non-significant when controlling for BMI, which suggests that CRP may be on the causal pathway between obesity and asthma.(11) In a similar analysis, Olafsdottir et al. showed CRP levels to confound the relationship between BMI and non-atopic (but not atopic) asthma.(12) We recently showed that childhood obesity was related to atopy in the NHANES 2005-2006 dataset and that inflammation, as measured by CRP, was also involved in this relationship.(13) This suggests that that obesity could be related to asthma through an allergic inflammation pathway as well.
This study examines the association between obesity and asthma in a representative sample of U.S. children and young adults. We used allergen-specific serum IgE results to distinguish atopic and non-atopic children. We investigated the possibility of an inflammatory pathway for the obesity-asthma relationship by examining confounding of the CRP-asthma relationship by BMI, following previous work in adults.(11)
Subjects and Methods
Study Population
The NHANES is a nationally representative survey conducted periodically to assess the health and nutritional status of adults and children in the U.S. The primary purpose of NHANES is to determine the prevalence of major diseases and risk factors for those diseases.(14) Details of the plan and operation of NHANES may be found online at http://www.cdc.gov/nchs/nhanes.htm.
The NHANES used a stratified, multi-stage probability sampling design. Eligible persons age 16 or older were interviewed directly, while interviews for those under age 16 were done with a proxy. All persons who completed the household interview were invited to participate in the Medical Examination component of NHANES. The study protocols were IRB-approved and all participants (or their parent/guardian) gave written informed consent.
The target population of NHANES is the civilian, non-institutionalized population of the U.S. Each survey round oversampled low-income persons, adolescents age 12-19, persons age 60+, African Americans, and Mexican Americans. Weights are supplied with the public use dataset so that estimates can be produced that are representative of the U.S. population. In the combined 1999-2006 NHANES, 17,140 children age 2-19 completed both the interview portion of the survey and the medical examination, and 16,717 children had their height and weight measured.
Asthma Outcomes
All participants age 1 year and older were asked (by proxy if under age 16) whether a doctor or other health professional had ever said they had asthma. Those who answered ‘yes’ were asked a series of additional questions, including whether they still had asthma, whether they had experienced an asthma attack in the past year, and whether they had been to the emergency department for asthma in the past year. The primary outcome for these analyses is a report of current asthma (those with an asthma diagnosis who report still having asthma).
A separate set of questions were asked about wheezing. Wheeze outcomes used in these analyses include a report of wheeze in the past year (yes/no), medical visit for wheeze in the past year (yes/no) and missing school or work due to wheeze in the past year (yes/no).
Atopy
Participants in the 2005-2006 survey age 1 year and older were tested for total and allergen-specific serum IgE using the Pharmacia Diagnostics ImmunoCAP 1000 System (Kalamazoo, Michigan). A detailed description of the laboratory method can be found at NHANES 2005-2006 web page (http://www.cdc.gov/nchs/data/nhanes/nhanes_05_06/al_ige_d.pdf). Children age 1 to 5 years were tested for total IgE as well as specific IgE to dust mite (D. farinae and D. pteronyssinus), cat, dog, cockroach, Alternaria, peanut, egg, and milk. Children and young adults age 6 and above also have specific IgE measurements for ragweed, ryegrass, bermuda, white oak, birch, shrimp, Aspergillus, thistle, mouse, and rat.
Atopy was defined in these analyses as a positive specific IgE response (≥ 0.35 kU/L) to at least one of the allergens tested. In order to be included in the analyses that stratify by atopic status, the individual had to have information for the full panel of allergens (9 allergens for those under age 6, and 19 for those age 6-19).(13)
Weight Measurements
Participants had their weight and height measured following a standard protocol. Body Mass Index (BMI) was calculated as weight in kilograms divided by height in meters squared. Sex-specific BMI percentile-for-age was calculated using the Centers for Disease Control and Prevention 2000 reference standards.(15) Children between the 5th and 85th percentile of BMI-for-age are considered to be normal weight, those between the 85th and 95th percentile are considered overweight, and those at or above the 95th percentile are considered obese, as recommended by the American Medical Association.(16)
Other Measures
The age, sex, and race/ethnicity of the child were examined as potential confounders and effect modifiers. As a measure of SES, quartiles of the poverty income ratio (PIR) were also examined for their relationship to overweight and asthma. The PIR is the relationship of family income to the family’s appropriate poverty threshold based on family size and composition.(17) Ratios below 1 are below the poverty threshold.
Other potential confounders considered were current household smoking (yes/no), maternal smoking during pregnancy (yes/no), birthweight (low birthweight vs. not), the average number of hours per day the child spent either watching television or using a computer, and how many times per week the child played or exercised enough to sweat or breathe hard.
Statistical Analyses
Because underweight has been associated with increased risk for asthma,(18, 19) this analysis excluded 581 children (3.5%) that were less than the 5th percentile for their age and sex. Of the remaining 16,136 children, 16,074 had information for asthma and 3,387 for atopy. Younger children are more likely to be missing this information, due to missing blood samples, but missing atopy data is not related to asthma or obesity status. Across all years, 13,496 children have a CRP measurement; 3,313 of these also have atopy information.
The effect of overweight and obesity on current asthma and the other outcomes, as defined above, was examined using a logistic regression model. Results are presented for 16,074 children for whom current asthma status is available in the complete 1999-2006 dataset, and stratified by atopy for the 2005-2006 dataset (3,387 children with atopy information).
The association of continuous BMI percentile-for-age with current asthma was also examined using logistic regression, with a 1-standard-deviation increase in the BMI z-score as the exposure. Results were plotted using a scatterplot smoothing technique.(20)
Potential modification of the effect of overweight on asthma was examined for sex and for age and race/ethnicity, separately for boys and girls. A p-value for the interaction term < 0.10 was considered evidence of interaction. No effect measure modification was observed for these factors (Table E1 in the online supplement). Survey year, age, race/ethnicity, poverty income ratio, household smoking, and level of physical activity were related to both the exposure and the outcome and were retained as confounders in the adjusted models. Results for both simple age-adjusted and fully adjusted models are shown.
All analyses were performed using the survey sampling weights and SAS survey sampling procedures to adjust for the NHANES complex sampling design (Version 9.1.3, Cary, NC). Figures were generated using the R system for statistical computing (version 2.7.0), which also can account for the sampling design.(20)
Results
Nearly 10% of children and young adults age 2-19 reported current asthma in the four rounds of NHANES from 1999-2006 (Table 1). Seven percent reported a medical visit for wheeze. Age was not strongly related to asthma, but medical visits for wheeze were more common in the 2-5 year old children. More boys than girls reported current asthma. Compared to non-Hispanic whites, non-Hispanic blacks reported more asthma and visits for wheezing, whereas Mexican Americans reported less asthma and fewer visits for wheezing. In-utero exposure to tobacco smoke was associated with wheezing requiring a medical visit, and low birthweight and elevated CRP were associated with a higher prevalence of asthma. Neither asthma nor medical visits for wheeze were strongly associated with the physical activity variables. Both outcomes were more common among children with at least one positive specific IgE result. Among atopic children, 15.8% reported current asthma, whereas only 6.4% of non-atopic children had asthma (OR= 2.71; 95% CI: 1.98-3.72). Looked at the other way around, 68% of children with asthma also have atopy compared to 44% of non-asthmatic children.
Table 1.
Current asthma and medical visits for wheezing by population characteristics, NHANES 1999-2006, children and young adults age 2-19.
| Subject Characteristics | N | % | Current asthma (%, SE) | OR (95% CI) | Any medical visits for wheezing (%, SE) | OR (95% CI) |
|---|---|---|---|---|---|---|
| Overall | 16074 | 9.6 (0.4) | 7.0 (0.3) | |||
| Survey Round | ||||||
| 1999-2000 | 3924 | 22.4 | 9.6 (1.1) | 1.00 | 5.9 (0.6) | 1.00 |
| 2001-2002 | 4124 | 26.3 | 9.1 (0.6) | 0.94 (0.71-1.25) | 6.3 (0.4) | 1.07 (0.82-1.40) |
| 2003-2004 | 3884 | 25.4 | 9.0 (0.7) | 0.94 (0.70-1.26) | 7.6 (0.4) | 1.31 (1.01-1.69) |
| 2005-2006 | 4112 | 25.5 | 10.7 (0.5) | 1.13 (0.86-1.47) | 7.8 (0.7) | 1.34 (1.00-1.81) |
| Age | ||||||
| 2-5 | 3166 | 20.5 | 8.9 (0.7) | 0.92 (0.74-1.15) | 11.3 (0.8) | 1.67 (1.26-2.21) |
| 6-10 | 3467 | 28.6 | 9.6 (0.8) | 1.00 | 7.1 (0.7) | 1.00 |
| 11-14 | 4064 | 22.9 | 10.6 (0.6) | 1.12 (0.88-1.43) | 5.7 (0.5) | 0.80 (0.60-1.07) |
| 15-19 | 5377 | 28.0 | 9.3 (0.5) | 0.92 (0.74-1.15) | 4.7 (0.5) | 0.65 (0.47-0.90) |
| Sex | ||||||
| Male | 7978 | 50.6 | 10.3 (0.6) | 1.18 (1.02-1.38) | 7.5 (0.4) | 1.20 (1.02-1.42) |
| Female | 8096 | 49.4 | 8.8 (0.4) | 1.00 | 6.4 (0.4) | 1.00 |
| Race-ethnicity | ||||||
| Non-Hispanic white | 4244 | 59.9 | 9.3 (0.5) | 1.00 | 7.3 (0.4) | 1.00 |
| Non-Hispanic black | 5032 | 14.7 | 13.5 (0.7) | 1.52 (1.28-1.80) | 8.0 (0.5) | 1.11 (0.93-1.31) |
| Mexican American | 5396 | 12.5 | 6.4 (0.4) | 0.67 (0.56-0.80) | 4.3 (0.3) | 0.57 (0.46-0.70) |
| Other | 1402 | 12.9 | 9.5 (1.0) | 1.03 (0.78-1.34) | 6.6 (1.0) | 0.89 (0.64-1.25) |
| Poverty Index (quartiles) | ||||||
| 1st | 5332 | 23.6 | 9.7 (0.7) | 0.98 (0.80-1.21) | 7.2 (0.5) | 1.07 (0.83-1.37) |
| 2nd | 4098 | 23.4 | 10.9 (0.9) | 1.13 (0.94-1.36) | 7.6 (0.7) | 1.14 (0.86-1.51) |
| 3rd | 3007 | 23.7 | 8.3 (0.8) | 0.83 (0.64-1.08) | 6.7 (0.7) | 0.99 (0.73-1.35) |
| 4th | 2443 | 23.6 | 9.8 (0.7) | 1.00 | 6.7 (0.6) | 1.00 |
| Missing/unknown | 1194 | 5.7 | 8.0 (1.0) | 5.3 (0.9) | ||
| Any smokers in household | ||||||
| Yes | 3273 | 21.9 | 8.8 (0.6) | 0.88 (0.75-1.03) | 7.6 (0.7) | 1.13 (0.90-1.40) |
| No | 12609 | 78.1 | 9.9 (0.4) | 1.00 | 6.8 (0.3) | 1.00 |
| Mother smoked during pregnancy1 | ||||||
| Yes | 1721 | 18.9 | 10.0 (0.9) | 1.07 (0.86-1.32) | 9.9 (0.7) | 1.43 (1.16-1.78) |
| No | 9887 | 81.1 | 9.5 (0.5) | 1.00 | 7.1 (0.4) | 1.00 |
| Birthweight1 | ||||||
| <2500 g | 1004 | 7.4 | 12.5 (1.3) | 1.38 (1.08-1.75) | 9.1 (1.4) | 1.24 (0.87-1.75) |
| ≥2500 g | 10410 | 92.6 | 9.4 (0.4) | 1.00 | 7.5 (0.4) | 1.00 |
| Physical Activity | ||||||
| 0-3 times/wk | 6109 | 34.4 | 9.1 (0.5) | 0.83 (0.68-1.02) | 5.4 (0.4) | 0.74 (0.58-0.94) |
| 4-6 times/wk | 2768 | 18.1 | 9.7 (0.6) | 0.89 (0.72-1.11) | 7.5 (0.6) | 1.05 (0.76-1.45) |
| 7 times/wk | 4043 | 29.2 | 9.3 (0.7) | 0.85 (0.68-1.06) | 8.6 (0.5) | 1.22 (0.93-1.60) |
| 8+ times/wk | 2865 | 18.3 | 10.7 (0.9) | 1.00 | 7.1 (0.8) | 1.00 |
| Average hours of TV/videos2 | ||||||
| 0 hours/day | 1696 | 14.1 | 9.3 (1.0) | 1.00 | 7.3 (0.7) | 1.00 |
| 1-2 hours/day | 6364 | 50.1 | 9.4 (0.5) | 1.01 (0.80-1.28) | 6.6 (0.5) | 1.10 (0.86-1.41) |
| 3+ hours/day | 5583 | 35.8 | 10.1 (0.7) | 1.10 (0.87-1.40) | 5.9 (0.6) | 0.89 (0.68-1.17) |
| Average hours of computer2 | ||||||
| 0 hours/day | 4370 | 35.8 | 9.0 (0.5) | 1.00 | 7.8 (0.6) | 1.00 |
| 1-2 hours/day | 3859 | 28.9 | 10.8 (0.7) | 1.22 (1.04-1.45) | 6.4 (0.5) | 0.81 (0.66-1.00) |
| 3+ hours/day | 5409 | 35.3 | 9.4 (0.7) | 1.06 (0.86-1.30) | 7.6 (0.5) | 0.97 (0.77-1.21) |
| C-reactive protein3 | ||||||
| Not detectable | 3472 | 24.3 | 8.7 (0.7) | 1.00 | 5.9 (0.4) | 1.00 |
| 0.2 – 0.4 mg/L | 3294 | 20.1 | 9.9 (0.7) | 1.17 (0.91-1.50) | 6.4 (0.6) | 1.08 (0.83-1.41) |
| 0.4 – 1.4 mg/L | 3213 | 18.7 | 9.7 (0.8) | 1.13 (0.88-1.46) | 6.9 (0.7) | 1.18 (0.89-1.57) |
| >1.4 – 13.6 mg/L | 3466 | 18.7 | 11.1 (0.6) | 1.32 (1.09-1.58) | 7.3 (0.7) | 1.25 (0.97-1.60) |
| Missing/unknown | 2629 | 9.6 | 8.8 (0.9) | 8.7 (0.9) | ||
| At least 1 positive specific IgE4 | ||||||
| Yes | 1743 | 46.4 | 15.8 (0.9) | 2.71 (1.98-3.72) | 10.0 (1.2) | 2.28 (1.58-3.27) |
| No | 1642 | 53.6 | 6.4 (0.8) | 1.00 | 4.6 (0.8) | 1.00 |
Only available for subjects up to age 15.
Only available for subjects up to age 15 in years 1999-2002.
Values represent tertiles above detection.
Only available in survey years 2005-2006.
The relationships of the same characteristics to overweight were also examined (see Table E2 in the online supplement). Fifteen percent of the population met the criteria for overweight, and 16.2% were obese. Higher weight was associated with being male, being non-Hispanic black or Mexican American, lower PIR (less income), smoking, low birthweight, and decreased physical activity levels, especially with the number of hours of television watching. There was a fairly strong relationship between obesity and CRP levels. The correlation between the continuous BMI z-score and the log 10 CRP level was 0.41 (95% CI: 0.39-0.44).
Obese children had 1.68 higher odds of having current asthma (95% CI: 1.33, 2.12) and 1.97 higher odds of having experienced an asthma attack in the previous year (95% CI: 1.66, 2.34) than normal weight children (Table 2). Odds for all of the asthma-related outcomes are elevated for both categories of overweight, although the confidence intervals are wider for the emergency department visit outcome. Stronger estimates were observed for obese than for overweight categories for every outcome. In general, adjustment for confounding did not have a large effect on the odds ratios.
Table 2.
Asthma and wheeze outcomes by weight category (BMI percentile for age), NHANES 1999-2006, children and young adults age 2-19, N=16,074.
| Allergy Outcome | Number with outcome/Total in weight category | Percent (SE) with Outcome | Odds Ratio (95% CI) Unadjusted Model1 | Odds Ratio (95% CI) Adjusted Model2 |
|---|---|---|---|---|
| Current asthma | ||||
| Normal weight | 922/10,529 | 8.4 (0.4) | 1.00 | 1.00 |
| Overweight | 293/2,520 | 11.1 (1.0) | 1.36 (1.13-1.65) | 1.32 (1.08-1.60) |
| Obese | 381/3,025 | 13.2 (1.1) | 1.65 (1.33-2.05) | 1.68 (1.33-2.12) |
| Asthma attack in past year | ||||
| Normal weight | 515/10,529 | 5.0 (0.3) | 1.00 | 1.00 |
| Overweight | 168/2,519 | 6.8 (0.8) | 1.44 (1.15-1.80) | 1.41 (1.11-1.78) |
| Obese | 225/3,025 | 8.7 (0.7) | 1.87 (1.57-2.22) | 1.97 (1.66-2.34) |
| ED visit for asthma in past year | ||||
| Normal weight | 203/10,529 | 1.5 (0.2) | 1.00 | 1.00 |
| Overweight | 57/2,519 | 2.0 (0.3) | 1.38 (0.84-2.27) | 1.38 (0.94-2.04) |
| Obese | 72/3,025 | 2.4 (0.4) | 1.46 (0.93-2.29) | 1.68 (1.17-2.40) |
| Wheeze in past year | ||||
| Normal weight | 1,174/10,516 | 11.7 (0.5) | 1.00 | 1.00 |
| Overweight | 321/2,518 | 14.2 (1.0) | 1.25 (1.05-1.49) | 1.25 (1.05-1.50) |
| Obese | 451/3,022 | 17.4 (1.4) | 1.60 (1.32-1.94) | 1.63 (1.33-2.00) |
| Medical visit for wheeze in past year | ||||
| Normal weight | 610/10,369 | 6.1 (0.3) | 1.00 | 1.00 |
| Overweight | 171/2,483 | 8.0 (0.7) | 1.43 (1.15-1.78) | 1.40 (1.11-1.75) |
| Obese | 226/2,962 | 8.9 (0.8) | 1.64 (1.29-2.07) | 1.64 (1.28-2.09) |
| Miss school/work due to wheezing | ||||
| Normal weight | 289/10,048 | 3.0 (0.2) | 1.00 | 1.00 |
| Overweight | 100/2,420 | 4.9 (0.7) | 1.65 (1.18-2.31) | 1.56 (1.10-2.22) |
| Obese | 151/2,903 | 6.1 (0.7) | 2.10 (1.53-2.88) | 2.10 (1.50-2.96) |
Model adjusted for age only.
Model adjusted for age, survey round, race/ethnicity, sex, poverty income ratio, household smoking, and level of physical activity.
Effect modification by sex was not observed for these outcomes, but data stratified by sex are provided in Table E3 in the online supplement.
The prevalence of all of the asthma-related outcomes was higher for the atopic children (Table 3). However, the obesity association was stronger among the non-atopic children, with interaction effects (p < 0.10) seen for all outcomes except asthma attack and medical visits for wheeze. Very few emergency department visits were reported in this smaller population, so the data are not shown. Among non-atopic subjects, those in the obese category were more than twice as likely to have current asthma (OR 2.46, 95% CI: 1.21, 5.02), an asthma attack (OR 2.45, 95% CI: 1.31, 4.58), or wheezing (OR 2.20, 95% CI: 1.15, 4.22) in the previous year than youth of normal weight. In contrast, there was no appreciable association between overweight or obesity and asthma among atopic subjects.
Table 3.
Asthma and wheeze outcomes by weight category (BMI percentile for age) and atopic status, NHANES 2005-06, children and young adults age 2-19, N=3,387.
| Non-Atopic (N=1,640) | Atopic (N=1,737) | ||||||||
|---|---|---|---|---|---|---|---|---|---|
| Asthma Outcome | Number with outcome/Total in weight category | Percent (SE) with Outcome | Odds Ratio (95% CI) Unadjusted Model1 | Odds Ratio (95% CI) Adjusted Model2 | Number with outcome/Total in weight category | Percent (SE) with Outcome | Odds Ratio (95% CI) Unadjusted Model1 | Odds Ratio (95% CI) Adjusted Model2 | Interaction p-value |
| Current asthma | |||||||||
| Normal weight | 61/1,092 | 5.3 (0.6) | 1.00 | 1.00 | 148/1,063 | 15.3 (1.5) | 1.00 | 1.00 | 0.09 |
| Overweight | 19/247 | 7.9 (2.1) | 1.51 (0.78-2.89) | 1.29 (0.65-2.53) | 39/276 | 15.6 (2.1) | 1.03 (0.71-1.51) | 1.05 (0.76-1.45) | |
| Obese | 23/301 | 10.9 (3.6) | 2.16 (1.10-4.22) | 2.46 (1.21-5.02) | 59/398 | 18.0 (3.5) | 1.23 (0.68-2.22) | 1.34 (0.70-2.57) | |
| Asthma attack in past year | |||||||||
| Normal weight | 29/1,063 | 3.3 (0.7) | 1.00 | 1.00 | 79/1,063 | 9.0 (1.3) | 1.00 | 1.00 | 0.42 |
| Overweight | 11/236 | 5.4 (2.1) | 1.68 (0.70-4.03) | 1.35 (0.53-3.42) | 30/276 | 13.0 (2.5) | 1.57 (0.98-2.52) | 1.64 (1.10-2.43) | |
| Obese | 13/301 | 6.6 (1.9) | 2.07 (1.24-3.44) | 2.45 (1.31-4.58) | 29/398 | 11.0 (2.5) | 1.29 (0.68-2.44) | 1.47 (0.74-2.92) | |
| Wheeze in past year | |||||||||
| Normal weight | 80/1,094 | 7.3 (1.0) | 1.00 | 1.00 | 165/1,065 | 18.2 (2.0) | 1.00 | 1.00 | 0.07 |
| Overweight | 16/247 | 10.3 (2.4) | 1.50 (0.80-2.81) | 1.52 (0.77-2.98) | 45/277 | 18.1 (2.0) | 0.98 (0.68-1.43) | 0.97 (0.69-1.38) | |
| Obese | 31/301 | 14.2 (3.6) | 2.16 (1.10-4.23) | 2.20 (1.15-4.22) | 61/401 | 16.6 (2.3) | 0.88 (0.57-1.37) | 0.85 (0.54-1.36) | |
| Medical visit for wheeze in past year | |||||||||
| Normal weight | 48/1,094 | 4.0 (0.8) | 1.00 | 1.00 | 90/1,065 | 10.3 (1.4) | 1.00 | 1.00 | 0.40 |
| Overweight | 10/247 | 5.3 (1.5) | 1.53 (0.74-3.16) | 1.68 (0.86-3.27) | 22/277 | 8.5 (2.3) | 0.86 (0.49-1.50) | 0.85 (0.49-1.48) | |
| Obese | 16/301 | 6.9 (2.5) | 2.04 (1.02-4.10) | 2.14 (0.95-4.78) | 28/401 | 10.2 (2.4) | 1.04 (0.60-1.81) | 1.10 (0.60-2.00) | |
| Miss school/work due to wheezing | |||||||||
| Normal weight | 22/1,065 | 2.4 (0.6) | 1.00 | 1.00 | 50/1,036 | 5.6 (1.2) | 1.00 | 1.00 | 0.04 |
| Overweight | 6/245 | 3.4 (1.7) | 1.46 (0.47-4.50) | 1.54 (0.57-4.18) | 15/269 | 7.5 (2.5) | 1.36 (0.56-3.31) | 1.41 (0.56-3.55) | |
| Obese | 11/299 | 4.8 (1.8) | 2.09 (0.86-5.08) | 2.17 (1.00-4.71) | 18/392 | 4.3 (1.3) | 0.76 (0.36-1.61) | 0.77 (0.35-1.69) | |
Model adjusted for age only.
Model adjusted for age, survey round, race/ethnicity, sex, poverty income ratio, household smoking, and level of physical activity.
Figure 1 shows the relationship between continuous BMI percentile-for-age and the probability of current asthma, stratified by atopic status. The relationship between continuous BMI and asthma was stronger among the non-atopic subjects. For each 1-standard deviation increase in the BMI z-score the odds for asthma were increased 1.52 times (95% CI: 1.14, 2.04) among the non-atopic youth, but only 1.13 times among atopic youth (95% CI: 0.91, 1.41)(interaction p-value=0.04).
Figure 1.
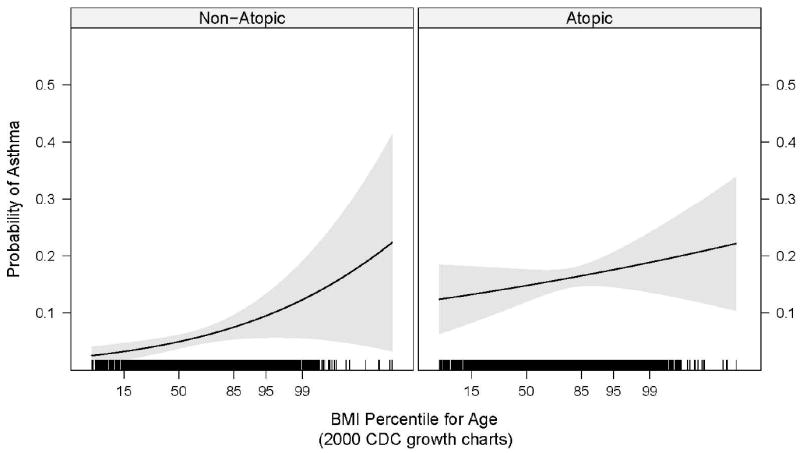
Probability of current asthma by BMI percentile-for-age and atopy, NHANES 2005-2006, children and young adults age 2-19. The shaded region represents the 95% confidence limits of the regression line. The black lines display where observations lie on the BMI distribution. The x axis is plotted as the z-score for BMI-for-age and labeled with the transformation of z-scores to percentiles.
In a logistic regression model examining the association between CRP and current asthma, separately for atopic and non-atopic children, increased CRP (a 1-log increase) was associated with an increased odds of having asthma among non-atopic children (OR 1.45; 95% CI: 1.16, 1.81), but not among atopic children (OR 0.97; 95% CI: 0.65, 1.44). Among the non-atopic children, adjustment for age, race, sex, household smoking, PIR, and physical activity did not affect the odds ratio; whereas further adjustment for BMI attenuated the OR to 1.17 (95% CI: 0.80, 1.72). This demonstrates that the relationship of CRP to current asthma among these non-atopic children is confounded by BMI.
Discussion
This analysis from a representative survey of U.S. children shows that being overweight or obese is associated with an increased likelihood of reporting current asthma. The association with BMI was uniformly stronger for the obese category than for the overweight category. We also demonstrated that the continuous BMI z-score was associated in a linear fashion with the odds of reporting asthma. In addition we were able to objectively classify subjects in NHANES 2005-2006 as atopic or non-atopic based on allergen-specific IgE tests. This analysis revealed that the association of overweight and obesity with asthma was stronger among the non-atopic children.
These findings differ from those in one study using NHANES III data, which did not find a difference in the association between obesity and asthma between atopic and non-atopic children.(10) That study differs from the present analysis in the definition of obesity (quartiles vs. the AMA-recommended ranges) and in the manner of assessing atopy (skin prick tests vs. specific IgE tests). The earlier study did find a strong relationship between obesity and asthma, especially for highest quartile of obesity, but reported that there was no effect modification by atopic status. Stratified data were not presented, however, and lack of effect modification was not defined. Another study of NHANES III data, using a slightly different age range and continuous percentiles of BMI, found that children with non-atopic asthma (but not atopic asthma) had higher BMIs than non-asthmatic children.(21)
Our findings are similar to studies in adults that found obesity to be more strongly related to non-atopic than to atopic asthma. In an Australian study of 4,060 men and women, an increased risk for asthma was found for those with central obesity (measured by waist circumference and waist/hip ratio) who were non-atopic.(8) In a cross-sectional survey of more than 86,000 Canadian adults, overweight was associated with asthma in both allergic and non-allergic women, but the odds ratio was stronger in non-allergic women, whereas in men only the relationship in non-allergic men was significant.(9)
Several previous studies have found the effect of obesity on asthma to differ by gender in children. Gilliland et al. found a significant relationship between overweight and asthma among boys, but not girls,(22) while Gold et al. found a relationship only among girls.(23) Castro-Rodriguez et al. reported from the Tucson Chidren’s Respiratory Study that obesity among girls at age 11 was associated with frequent wheeze at age 13.(24) The authors suggest that these gender differences may be due to female hormones. Indeed, the strongest effects of obesity on asthma were among girls that started puberty before age 11, compared to those with later pubertal development.(24) Varraso et al. also found that BMI was more strongly related to asthma severity among girls with early menarche.(25) The present analyses, with a large and representative sample of children and adolescents, did not find evidence of effect measure modification by gender.
Previous studies suggest that systemic inflammation is a potential mechanism behind the observed relationship between obesity and asthma.(26, 27) Our results demonstrated a relationship between CRP levels and asthma, and we therefore examined whether CRP could be on the pathway between obesity and asthma. It is inappropriate to control for such an intermediate variable as a confounder,(28) and mediation models and other models that attempt to partition effects into direct and indirect effects rely on assumptions that are unlikely to hold in our data (e.g. no unmeasured common causes of CRP levels and asthma).(29, 30) The relationship of CRP to asthma in non-atopic children, and the confounding of this relationship by BMI, suggests that overweight may indeed lead to systemic inflammation that in turn leads to an increased risk of asthma in non-atopic individuals. There was no evidence of a relationship between systemic inflammation and asthma among atopic youth. These findings suggest that allergic and systemic inflammation may operate independently on the pathway to asthma.
One potential limitation of these findings is that the measure of obesity used, BMI, is not a direct measure of adiposity and cannot differentiate between lean and fat mass. Nevertheless the AMA recommends the use of the CDC 2000 BMI-for-age percentiles as used in these analyses, considering them to have good sensitivity and specificity for identifying the children at greatest health risk.(16) Good age-specific reference data for other indices of adiposity in children, such as waist circumference, do not exist.
Because these NHANES data come from a cross-sectional survey the associations seen may not be causal. Confounding of the CRP-asthma relationship by BMI could represent systemic inflammation on the causal pathway to asthma, or could indicate that obesity is a proximate cause of both inflammation and asthma. Unmeasured confounding could affect these relationships. In order to understand the true causal pathways that may underlie the relationships between adiposity, atopy, and the development and manifestation of asthma, it will be necessary to look at these relationships prospectively.
We recently found childhood obesity to be associated with atopy,(13) which seems at odds with the current finding of no relationship with asthma among atopic children. However, there was at least some evidence of an elevation of risk of asthma in these children (OR=1.34). This may mean that obesity may indeed be a risk factor for atopy, but once atopy is established, it overshadows the effect of weight. Again, because these data come from a cross-sectional survey, it is not possible to test this time sequence in this dataset
The NHANES is a large national dataset that uses standardized data collection procedures, contains an abundance of information regarding every study subject, and is generalizable to the U.S. population. Using an objective measure of atopy, we found that excess weight in children appears to be associated with higher rates of asthma in children, especially asthma that is not accompanied by allergic disease. Current efforts to decrease overweight and obesity among U.S. children could potentially have the added benefit of decreasing asthma as well.
Supplementary Material
Acknowledgments
This research was supported in part by the Intramural Research Program of the National Institutes of Health, National Institute of Environmental Health Sciences (NIEHS) under grant number Z01 ES025041-10 and by the National Institute of Allergy and Infectious Diseases, National Institutes of Health (NIAID) under contract number NO1-AI-25482.
Footnotes
Conflict of Interest The authors declare that they have no competing financial interests related to this work
Supplementary information is available at the International Journal of Obesity’s website.
References
- 1.Ogden CL, Carroll MD, Curtin LR, McDowell MA, Tabak CJ, Flegal KM. Prevalence of overweight and obesity in the United States, 1999-2004. JAMA. 2006;295:1549–1555. doi: 10.1001/jama.295.13.1549. [DOI] [PubMed] [Google Scholar]
- 2.Akinbami L. The state of childhood asthma, United States, 1980-2005. MMWR. 2006:1–24. [PubMed] [Google Scholar]
- 3.Chinn S. Obesity and asthma: evidence for and against a causal relation. J Asthma. 2003;40:1–16. doi: 10.1081/jas-120017202. [DOI] [PubMed] [Google Scholar]
- 4.Ford ES. The epidemiology of obesity and asthma. J Allergy Clin Immunol. 2005;115:897–909. doi: 10.1016/j.jaci.2004.11.050. [DOI] [PubMed] [Google Scholar]
- 5.Shore SA, Johnston RA. Obesity and asthma. Pharmacol Ther. 2006;110:83–102. doi: 10.1016/j.pharmthera.2005.10.002. [DOI] [PubMed] [Google Scholar]
- 6.Story RE. Asthma and obesity in children. Curr Opin Pediatr. 2007;19:680–684. doi: 10.1097/MOP.0b013e3282f1ddfa. [DOI] [PubMed] [Google Scholar]
- 7.Flaherman V, Rutherford GW. A meta-analysis of the effect of high weight on asthma. Arch Dis Child. 2006;91:334–339. doi: 10.1136/adc.2005.080390. [DOI] [PMC free article] [PubMed] [Google Scholar]
- 8.Appleton SL, Adams RJ, Wilson DH, Taylor AW, Ruffin RE. Central obesity is associated with nonatopic but not atopic asthma in a representative population sample. J Allergy Clin Immunol. 2006;118:1284–1291. doi: 10.1016/j.jaci.2006.08.011. [DOI] [PubMed] [Google Scholar]
- 9.Chen Y, Dales R, Jiang Y. The association between obesity and asthma is stronger in nonallergic than allergic adults. Chest. 2006;130:890–895. doi: 10.1378/chest.130.3.890. [DOI] [PubMed] [Google Scholar]
- 10.von Mutius E, Schwartz J, Neas LM, Dockery D, Weiss ST. Relation of body mass index to asthma and atopy in children: the National Health and Nutrition Examination Study III. Thorax. 2001;56:835–838. doi: 10.1136/thorax.56.11.835. [DOI] [PMC free article] [PubMed] [Google Scholar]
- 11.Butland BK, Strachan DP, Rudnicka AR. C-reactive protein, obesity, atopy and asthma symptoms in middle-aged British adults. Eur Respir J. 2008;32:77–84. doi: 10.1183/09031936.00077207. [DOI] [PubMed] [Google Scholar]
- 12.Olafsdottir IS, Gislason T, Thjodleifsson B, Olafsson I, Gislason D, Jogi R, et al. C reactive protein levels are increased in non-allergic but not allergic asthma: a multicentre epidemiological study. Thorax. 2005;60:451–454. doi: 10.1136/thx.2004.035774. [DOI] [PMC free article] [PubMed] [Google Scholar]
- 13.Visness CM, London SJ, Daniels JL, Kaufman JS, Yeatts KB, Siega-Riz AM, et al. Association of obesity with IgE levels and allergy symptoms in children and adolescents: results from the National Health and Nutrition Examination Survey 2005-2006. J Allergy Clin Immunol. 2009;123:1163–1169. 1169 e1161–1164. doi: 10.1016/j.jaci.2008.12.1126. [DOI] [PMC free article] [PubMed] [Google Scholar]
- 14.National Center for Health Statistics. Let’s Improve Our Health: National Health and Nutrition Examination Survey, 2007-2008, Overview. Centers for Disease Control and Prevention; Hyattsville, MD: 2007. [Google Scholar]
- 15.Centers for Disease Control. Clinical Growth Charts. National Center for Health Statistics; Hyattsville, MD: 2007. [Google Scholar]
- 16.Krebs NF, Himes JH, Jacobson D, Nicklas TA, Guilday P, Styne D. Assessment of child and adolescent overweight and obesity. Pediatrics. 2007;120(Suppl 4):S193–228. doi: 10.1542/peds.2007-2329D. [DOI] [PubMed] [Google Scholar]
- 17.U.S. Census Bureau. How the Census Bureau Measures Poverty. 2007 [Google Scholar]
- 18.Braback L, Hjern A, Rasmussen F. Body mass index, asthma and allergic rhinoconjunctivitis in Swedish conscripts-a national cohort study over three decades. Respir Med. 2005;99:1010–1014. doi: 10.1016/j.rmed.2005.02.004. [DOI] [PubMed] [Google Scholar]
- 19.Kwon HL, Ortiz B, Swaner R, Shoemaker K, Jean-Louis B, Northridge ME, et al. Childhood asthma and extreme values of body mass index: the Harlem Children’s Zone Asthma Initiative. J Urban Health. 2006;83:421–433. doi: 10.1007/s11524-006-9050-9. [DOI] [PMC free article] [PubMed] [Google Scholar]
- 20.R Development Core Team. R: A language and environment for statistical computing. Foundation for Statistical Computing; Vienna, Austria: 2008. [Google Scholar]
- 21.Kelley CF, Mannino DM, Homa DM, Savage-Brown A, Holguin F. Asthma phenotypes, risk factors, and measures of severity in a national sample of US children. Pediatrics. 2005;115:726–731. doi: 10.1542/peds.2004-0529. [DOI] [PubMed] [Google Scholar]
- 22.Gilliland FD, Berhane K, Islam T, McConnell R, Gauderman WJ, Gilliland SS, et al. Obesity and the risk of newly diagnosed asthma in school-age children. Am J Epidemiol. 2003;158:406–415. doi: 10.1093/aje/kwg175. [DOI] [PubMed] [Google Scholar]
- 23.Gold DR, Damokosh AI, Dockery DW, Berkey CS. Body-mass index as a predictor of incident asthma in a prospective cohort of children. Pediatr Pulmonol. 2003;36:514–521. doi: 10.1002/ppul.10376. [DOI] [PubMed] [Google Scholar]
- 24.Castro-Rodriguez JA, Holberg CJ, Morgan WJ, Wright AL, Martinez FD. Increased incidence of asthmalike symptoms in girls who become overweight or obese during the school years. Am J Respir Crit Care Med. 2001;163:1344–1349. doi: 10.1164/ajrccm.163.6.2006140. [DOI] [PubMed] [Google Scholar]
- 25.Varraso R, Siroux V, Maccario J, Pin I, Kauffmann F. Asthma severity is associated with body mass index and early menarche in women. Am J Respir Crit Care Med. 2005;171:334–339. doi: 10.1164/rccm.200405-674OC. [DOI] [PubMed] [Google Scholar]
- 26.Ford ES, Galuska DA, Gillespie C, Will JC, Giles WH, Dietz WH. C-reactive protein and body mass index in children: findings from the Third National Health and Nutrition Examination Survey, 1988-1994. J Pediatr. 2001;138:486–492. doi: 10.1067/mpd.2001.112898. [DOI] [PubMed] [Google Scholar]
- 27.Retnakaran R, Hanley AJ, Connelly PW, Harris SB, Zinman B. Elevated C-reactive protein in Native Canadian children: an ominous early complication of childhood obesity. Diabetes Obes Metab. 2006;8:483–491. doi: 10.1111/j.1463-1326.2005.00533.x. [DOI] [PubMed] [Google Scholar]
- 28.Rothman KJ, Greenland S. Modern Epidemiology. Second. Lippincott, Williams and Wilkins; Philadelphia: 1998. [Google Scholar]
- 29.Kaufman JS, Maclehose RF, Kaufman S. A further critique of the analytic strategy of adjusting for covariates to identify biologic mediation. Epidemiol Perspect Innov. 2004;1:4. doi: 10.1186/1742-5573-1-4. [DOI] [PMC free article] [PubMed] [Google Scholar]
- 30.Robins JM, Greenland S. Identifiability and exchangeability for direct and indirect effects. Epidemiology. 1992;3:143–155. doi: 10.1097/00001648-199203000-00013. [DOI] [PubMed] [Google Scholar]
Associated Data
This section collects any data citations, data availability statements, or supplementary materials included in this article.