

Abstract
Cone vision is less sensitive than rod vision. Much of this difference can be attributed to the photoreceptors themselves, but the reason why the cones are less sensitive is still unknown. Recent recordings indicate that one important factor may be a difference in the rate of activation of cone transduction; that is, the rising phase of the cone response per bleached rhodopsin molecule (Rh*) has a smaller slope than the rising phase of the rod response per Rh*, perhaps because some step between Rh* and activation of the phosphodiesterase 6 (PDE6) effector molecule occurs with less gain. Since rods and cones have different G-protein α subunits, and since this subunit (Tα) plays a key role both in the interaction of G-protein with Rh* and the activation of PDE6, we investigated the mechanism of the amplification difference by expressing cone Tα in rod Tα-knockout rods to produce so-called GNAT2C mice. We show that rods in GNAT2C mice have decreased sensitivity and a rate of activation half that of wild-type (WT) mouse rods. Furthermore, GNAT2C responses recover more rapidly than WT responses with kinetic parameters resembling those of native mouse cones. Our results show for the first time that part of the difference in sensitivity and response kinetics between rods and cones may be the result of a difference in the G-protein α subunit. They also indicate more generally that the molecular nature of G-protein α may play an important role in the kinetics of G-protein cascades for metabotropic receptors throughout the body.
Introduction
One fundamental feature of the visual system of vertebrates is its duplex nature: perception in dim light is mediated by rods, but in brighter light the less sensitive cones largely replace the rods as the transmitters of visual signals to the CNS. We have known for almost 40 years that much of the difference in sensitivity of rod and cone vision can be attributed to the photoreceptors themselves (Fain & Dowling, 1973), but it is still unclear why single cones are less sensitive than single rods. Cone photopigments are known to be noisier than rod pigments (Rieke & Baylor, 2000; Kefalov et al. 2005), and this extra noise was initially postulated to adapt the cone and decrease its sensitivity (Kefalov et al. 2003). Newer results show, however, that the sensitivity difference of mammalian photoreceptors does not arise from the noise of the cone pigments but must come from other differences in the transduction cascade (Shi et al. 2007; Fu et al. 2008). Cones in carp retina have a higher expression level of rhodopsin kinase and phosphorylate cone pigment more rapidly (Tachibanaki et al. 2001, 2005), and cones in other species have a higher concentration of the GTPase accelerating protein complex (GAP) that contains RGS9-1 (Cowan et al. 1998; Zhang et al. 2003). Thus both of the principal reactions responsible for turning off the receptor response may be more rapid in cones than in rods, and cone responses are known to decay more rapidly (see for example Nikonov et al. 2006). Furthermore, cone cyclic nucleotide-gated channels have been reported to be more permeable to Ca2+ than rod channels (Perry & McNaughton, 1991; Picones & Korenbrot, 1995), and the buffering of Ca2+ is different in the two kinds of photoreceptors (Sampath et al. 1999). These differences would produce a different rate of activation and deactivation of any Ca2+-dependent activity in the outer segment, such as that of the guanylyl cyclase (Korenbrot, 1995).
In addition to these differences, there is biochemical (Tachibanaki et al. 2001) and physiological (Pugh & Lamb, 1993; Zhang et al. 2003; Nikonov et al. 2006) evidence that the transduction cascade in cones activates more slowly. Although there are many possible explanations for this difference, one candidate must certainly be the α subunit of transducin (Tα), which plays a key role in both the interaction of the G-protein with Rh* and the activation of PDE6. The molecular structure of Tα may in addition influence the rate of decay of activated PDE6. Because the α subunit of transducin is GNAT1 in rods but GNAT2 in cones (see Ebrey & Koutalos, 2001), we decided to investigate whether the replacement of rod Tα with cone Tα would have any effect on the sensitivity and kinetics of the light response of rod photoreceptors. We created a stable mouse line of so-called GNAT2C mice, in which cone GNAT2 is expressed in the GNAT1 knockout background, and in which the level of expression of GNAT2 in GNAT2C mice is virtually indistinguishable from that of GNAT1 in WT mice. We show that the rate of activation of transduction is slowed and response recovery is accelerated in GNAT2C rods, much as in native mouse cones. These experiments indicate that the identity of the transducin α subunit may play an important and previously unrecognized role in determining the different physiological properties of rods and cones.
Methods
Generation of mouse lines
Experiments were performed in accordance with the policy of The Journal of Physiology (Drummond, 2009) as well as with the rules and regulations of the NIH guidelines for research animals, as approved by the institutional animal care and use committees (IACUCs) of the Virginia Commonwealth University and the University of California, Los Angeles. Animals were kept in cyclic 12 h on/12 h off lighting in approved cages and supplied with ample food and water. Animals in all experiments were killed before tissue extraction by an approved procedure, usually decerebration. The numbers of animals of each kind used in the experiments are given in the Results section.
WT mice were C57BL/6 from Jackson Laboratory (Bar Harbor, ME, USA). Three transgenic founders were generated by pronuclear injections of the construct shown in Fig. 1A into embryos of C57BL/6 and Balb/c parents. They were backcrossed with C57BL/6 mice and their offspring were screened by Western blotting for cone transducin over-expression. Two founders had a patchy expression pattern, and their breeding was discontinued. Another founder had a homogeneous expression pattern and was mated into the GNAT1−/− background to generate the so-called GNAT2C line, which was subsequently mated with R9AP95 or RGS9−/− to generate the GNAT2C/R9AP95 and GNAT2C/RGS9−/− lines, respectively. Genotyping of the GNAT2C line was performed by PCR amplification of a 450 base-pair product from tail-snip DNA at 60°C annealing temperature. The primers used were: RH1.1: 5′-TCA GTG CCT GGA GTT GCG CTG TGG and cTa-2R: 5′-GGC ATG GTC CCC TCC TCG GT. Genotyping procedures for R9AP95 and RGS9−/− were previously described (Chen et al. 2000; Krispel et al. 2006). All animals used in the study were pigmented.
Figure 1. Generation and characterization of GNAT2C mice.
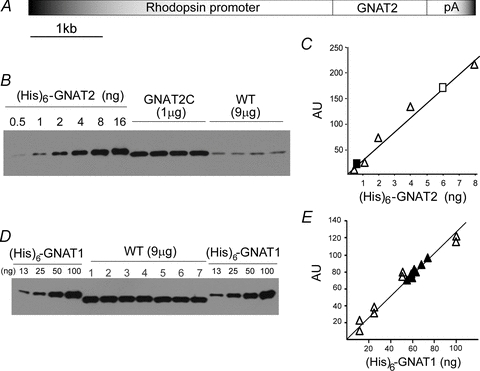
A, transgenic construct. B, a representative Western blot showing relative levels of cone transducin α subunit (GNAT2) signal from 1 μg of GNAT2C and 9 μg of WT retinal extracts derived individually from four retinas of each genotype. (His)6-tagged recombinant GNAT2 protein (in ng) was used as standards for measurement of absolute amount in each retina. C, the pixel value of each recombinant protein band shown in B in arbitrary units (AU) was plotted against the amount of recombinant protein (open triangles) loaded to construct a standard curve. The 16 ng data point was excluded due to apparent signal saturation. The averaged levels of native GNAT2 per retina from four different GNAT2C (open square) and WT (filled square) retinal samples were determined by extrapolation to be 2220 ± 140 ng and 31 ± 4 ng (measurements of 16 samples from 4 mice). D, a representative Western blot showing the level of rod transducin α subunit (GNAT1) from seven WT mouse retinal samples (9 μg) against known amounts of (His)6-tagged recombinant GNAT1 protein. E, the pixel value of each native GNAT1 signal (filled triangles) in arbitrary units (AU) was plotted against signals from duplicate recombinant GNAT1 proteins (open triangles). The averaged level of GNAT1 per retina was determined by extrapolation to be 2190 ± 60 ng (measurements of 35 samples from 5 mice).
Antibody
Polyclonal antibody UUTA2 was raised in rabbit against synthetic mouse cone transducin N-terminal peptide: CEDKELARRSKELEK, which prior to immunization was coupled to keyhole limpet haemocyanin. The antibody was affinity purified with a corresponding peptide column (GenScript, Piscataway, NJ, USA) and stored at −20°C in 1x phosphate-buffered saline (PBS) with 0.02% sodium azide.
Anatomy and immunohistochemistry
Measurements of outer segment length and width were taken from electron micrographs of retinal quadrants prepared as described previously (Tsang et al. 2007; Woodruff et al. 2007). For immunohistochemistry, mouse eyeballs were immersion fixed in 4% paraformaldehyde in 1x PBS at 4°C for 120 min. After removal of cornea and lens, the resulting eye cups were cryoprotected in cold 30% sucrose in 1x PBS, embedded in a freezing medium (Triangle Biomedical Sciences, Durham, NC, USA), and sectioned at –20°C at 30 μm thickness. Sections were blocked for 1 h at room temperature with 10% goat serum and 0.3% Triton X-100 in 1x PBS and incubated with the UUTA2 antibody at 1:1000 dilution overnight at room temperature. Alexa 563-conjugated goat anti-rabbit antibody (1:2000 dilution; Invitrogen, Carlsbad, CA, USA) was used as the secondary antibody. Fluorescence images were acquired with a confocal microscope at the shared EM and microscopy facility of the Department of Anatomy and Neurobiology, Virginia Commonwealth University (LSM510Meta; Carl Zeiss Microimaging, Thornwood, NY, USA). Unmodified *.lsm files were archived and viewed in a separate computer with the LSM Image Browser program (Carl Zeiss Microimaging). Images were then exported as *.tif files and opened in image-analysis software (Photoshop; Adobe, San Jose, CA, USA) for cropping. No ad hoc image processing, such as contrast and brightness adjustment, was performed during image acquisition.
Recombinant (His)6-cone transducin and (His)6-rod transducin
Full-length mouse GNAT2 cDNA was amplified by RT-PCR from WT mouse retinal RNA with the following two primers: mGNAT2-N: 5′-AAT ACT CGA GTT CAT ATG GGG AGT GGC ATC AGT and mGNAT2-C: 5′-AAT ACT CGA GTT AAA AGA GCC CAC AGTC. The cDNA was subcloned into the pET15b vector (EMD Bioscience, San Diego, CA, USA) with NdeI and XhoI sites. The resulting plasmid, pET15b-mGNAT2, was sequence verified and transformed into BL21(DE3) cells to produce recombinant cone transducin with an N-terminal (His)6 tag. The full-length mouse GNAT1 cDNA was similarly amplified with the following two primers: gnat1-Bcl-F: 5′-CGC TGA TCA AGG GGC TGG GGC CAG C and gnat1-Avr-R: 5′-TTA CCT AGG TTC AGA AGA GCC CGC AGT CT. It was subcloned into the pRSFDuet-1 vector (EMD Bioscience) with AvrII and BamHI sites. The resulting plasmid pRSFDuet1-mGNAT1 was transformed into BL21(DE3) to produce an N-terminally (His)6-tagged rod transducin. The production of (His)6-transducins in bacterial culture was induced by 1 mm isopropyl β-d-1-thiogalactopyranoside at OD600= 0.4 for 6 h at 37°C. We used the Talon beads (Clontech, Palo Alto, CA, USA) to purify the (His)6-tagged proteins to homogeneity under denaturing conditions with 8 m urea by following the manufacturer's instructions. The concentrations of the purified (His)6-tagged transducins were then determined in solution against bovine serum albumin (BSA) by biuret reactions with a bicinchoninic protein assay kit (Pierce Biotechnology, Rockford, IL, USA) and further verified by their band intensities relative to BSA standards in Coomassie Blue-stained SDS-PAGE gels (data not shown).
Immunoblot analysis
Purified recombinant (His)6-tagged rod or cone transducin and known amounts of mouse retinal extracts were resolved by 12% SDS-PAGE and transferred onto nitrocellulose membranes. The membranes were blocked with 10% dry milk in Tris-buffered saline containing 25 mm Tris (pH 7.5), 137 mm NaCl and 0.05% Tween-20. For the detection of cone transducin, the UUTA2 antibody was used at 1:3000 dilution. For the detection of rod transducin, the UUTA1 antibody was used at 1:5000 dilution. For other phototransduction proteins, a cocktail of primary antibodies was used simultaneously as described in the legend to Fig. 2. To determine the amount of rod and cone transducin in the retina, horseradish peroxidase-conjugated goat anti-rabbit and/or anti-mouse antibodies (1:25,000, Santa Cruz Biotechnology) were used in conjunction with enhanced chemiluminescence with an extended-duration substrate kit (SuperSignal West Dura; Thermo Fisher Scientific, Rockford, IL, USA). Gel images were captured and the pixel value of each protein band was obtained in a Kodak IS440 imaging system with accompanying 1-D image-analysis software (Eastman Kodak, Rochester, NY, USA). The pixel value in arbitrary units (AU) was plotted against the level of recombinant protein to construct a standard curve, which was then used to extrapolate the level of native transducin in retinal samples. For the determination of cone transducin level shown in Fig. 1B and C, the 16 ng data point was excluded due to apparent signal saturation.
Figure 2. Expression levels of proteins and retinal structure.
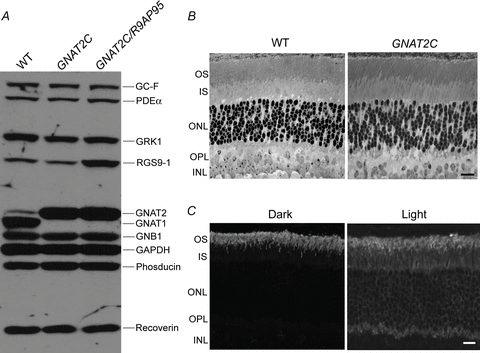
A, a representative Western blot of 10 μg each of WT, GNAT2C and GNAT2C/R9AP95 retinal extracts, probed with a cocktail of primary antibodies consisting of A670 (1:2000, anti-GC-F, from David Garbers, UT Southwestern), PA1-720 (1:1000, anti-PDE6α, Affinity Bioreagents), MA1-720 (G8, 1:5000, anti-GRK1, Affinity Bioreagents), CT318 (1:2500, anti-RGS9-1, from Melvin Simon, Caltech), UUTA2 (1:3000, anti-GNAT2), UUTA1 (1:5000, anti-GNAT1), BN-1 (1:10,000, anti-GNB1, from Melvin Simon, Caltech), 14C10 (1:20,000, anti-GAPDH, Cell Signaling Technology), Gerti (1:5000, anti-phosducin, from Rehwa Lee, UCLA) and DSC-Rv (1:10,000, anti-recoverin) to simultaneously detect proteins involved in phototransduction. Shown here is an autoradiogram exposed for 30 s immediately following enhanced chemiluminescence. Note the increased expression of RGS9-1 in GNAT2C/R9AP95 retinas and different mobilities of GNAT1 and GNAT2 under our experimental conditions. B, semi-thin sections of WT (left) and GNAT2C (right) mouse retinas. OS, outer segment; IS, inner segment; ONL, outer nuclear layer; INL, inner nuclear layer, OPL, outer plexiform layer. Scale bar, 20 μm. C, confocal images of GNAT2C retinas under dark-adapted conditions (left) and after exposure to room light for 30 min after pupil dilatation (right). Redistribution of cone transducin outside of the outer segment layer is evident after light exposure. OS, outer segments; IS, inner segments; ONL, outer nuclear layer; OPL, outer plexiform layer; INL, inner nuclear layer. Scale bar, 20 μm.
Suction-electrode recording
Methods for recording responses of mouse rods have been given previously (Woodruff et al. 2008; Chen et al. 2010). Animals between 2 and 6 months of age were dark-adapted typically for 5 h but for at least 3 h in a light-tight box. Rods were perfused at 37–39°C with Dulbecco's modified Eagle's medium (D-2902, Sigma Chemical Co., St Louis, MO, USA), supplemented with 15 mm NaHCO3, 2 mm sodium succinate, 0.5 mm sodium glutamate, 2 mm sodium gluconate, and 5 mm NaCl, bubbled with 5% CO2 (pH 7.4). Data were filtered at 35 Hz (8 pole, Bessel) and sampled at 100 Hz, or in some experiments (see Fig. 5) at 70 Hz and sampled at 200 Hz. Flashes of 500 nm light, 20 ms in duration (or 10 ms for the experiments of Fig. 5) were attenuated to different light levels by absorptive neutral density filters. At dim intensities (less than 20 photons μm−2), 10–20 individual responses presented at 5 s intervals were averaged to obtain mean flash responses. At medium intensities (between about 20 and 500 photons μm−2), 5–10 responses were averaged, and the inter-flash interval was increased to 7 s. At bright intensities above saturation for the rods, only 3–5 responses were averaged, and the inter-flash interval was increased to 10 s. A 500 nm light was also used for steps of light and backgrounds. Other information about the details of response presentation are given in the figure legends. The values of the limiting time constant τD were measured as in Woodruff et al. (2008) by giving a series of five flashes at each of between 4 and 7 intensities chosen to fall within one-and-a-half log units above the flash intensity that just produced saturation of response amplitude. Flash intensities were in the range of 159–3250 photons μm−2. The time in saturation (Tsat) was measured as the time from the beginning of the flash to the time at which the mean circulating current recovered to 25% of its dark-adapted value. The value of τD was then calculated as the best-fitting slope of Tsatversus the natural logarithm of the flash intensity. Amplification constants were estimated as in Nikonov et al. (2006). Unless otherwise stated, errors are given as standard errors of the mean (s.e.m.). Curve fitting and plotting of data were done with the program Origin (OriginLab Inc., Northampton, MA, USA).
Figure 5. Differences in rate of activation and decay of WT and GNAT2C rods.
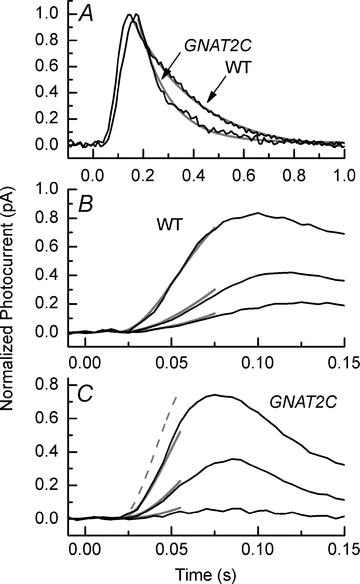
A, mean small-amplitude responses of 21 WT rods and 9 GNAT2C rods to flashes of intensities 17 (WT) and 79 (GNAT2C) photons μm−2. Same responses as in Fig. 3. Responses have been normalized rod by rod to peak amplitude of response to compare waveform of response decay. Responses have been fitted with single exponentials (grey traces) of 258 ms (WT) and 122 ms (GNAT2C). B, black traces are mean initial time courses of responses of 16 WT rods to 10 ms flashes at intensities of 8.6, 21 and 79 photons μm−2, after filtering with an 8-pole Bessel filter with bandwidth set to 70 Hz and sampled at 200 s−1. Responses have been normalized rod by rod to the peak amplitude of the photocurrent (rmax). Grey traces are fits to data with the same mean values of A of 20.5 s−2 and teff of 18 ms at all three intensities. C, black traces are mean initial time courses of responses recorded and normalized as in B of 14 GNAT2C rods to 10 ms flashes at intensities of 21, 79 and 227 photons μm−2. Grey traces are fits to data with A of 10.2 s−2 and teff of 19.3 ms. Single dashed grey curve gives prediction for brightest intensity with rod value of A (20.5 s−2).
Results
GNAT2C and GNAT2C/R9AP95 mice
We generated a transgenic mouse line in which the expression of a full-length mouse cone transducin α subunit (GNAT2) was driven by a 4 kb rhodopsin promoter (Fig. 1A). By breeding these mice into a rod transducin knockout (GNAT1−/−) background (Calvert et al. 2000), we made the so-called GNAT2C mouse line, replacing rod transducin with cone transducin in rods. The absolute levels of cone Tα (GNAT2) were measured by Western blotting against (His)6-tagged recombinant cone Tα (Fig. 1B) to be 2220 ± 140 ng in GNAT2C mice and 31 ± 4 ng in WT mice (both from measurements of 16 samples from 4 mice, Fig. 1C). Similar measurements from WT mouse retinas (Fig. 1D) gave the concentration of rod Tα (GNAT1) as 2190 ± 60 ng (measurements of 35 samples from 5 mice, Fig. 1E). Thus the concentrations of rod or cone transducin α subunit in WT or GNAT2C mice were similar.
The data in Fig. 1 also show that the sum of the concentrations of rod GNAT1 and cone GNAT2 in WT animals is statistically indistinguishable from the value we obtained for cone GNAT2 in our GNAT2C animals (Student's t test), which includes the GNAT2 in both rods and cones. We conclude that GNAT2C rods express cone Tα at a level nearly identical to the level of expression of rod Tα in WT rods. Furthermore, our measurements show that there is approximately a 72-fold difference in the amount of cone transducin in GNAT2C and WT mice. This is close to the expected value of 83-fold if cone transducin in native mouse cones is present at the same concentration as cone transducin in GNAT2C rods, since in WT mice, cones represent approximately 3% of the total population of photoreceptors (Carter-Dawson & Lavail, 1979) and have an outer segment volume about 40% that of rods (Nikonov et al. 2006). The use of a mouse line such as the GNAT2C mice, as opposed to virally mediated gene transfer previously described by Deng et al. (2009), allows the properties of phototransduction to be determined in a stable line having a known level of cone Tα.
We also measured expression levels of other phototransduction proteins in GNAT2C rods, including those of PDE6, rhodopsin kinase (GRK1), the GAP protein RGS9-1, and recoverin. The expression levels of these proteins are compared to those of WT rods in the first two columns of Fig. 2A. There were no apparent differences except for GNAT1 and GNAT2. The gross retinal morphology and outer segment structure appeared normal in GNAT2C mice (Fig. 2B). Measurements of outer segment length from electron micrographs gave a mean value of 25.4 ± 0.4 μm (n= 45) for GNAT2C rods, nearly identical to previously published values for WT rods (25.7 ± 0.5 μm; Tsang et al. 2007). Measurements of outer segment width gave values of 1.09 ± 0.02 (n= 44) for GNAT2C rods and 1.13 ± 0.01 (n= 55) for WT rods, which were not significantly different (Student's t test). We also saw no change in rhodopsin levels: total rhodopsin was 606 ± 55 pmol per GNAT2C retina (n= 8), and 586 ± 80 pmol per WT retina (n= 8), which were again not significantly different (Student's t test). Light-dependent redistribution of cone Tα occurs in GNAT2C rods (Fig. 2C) but not in WT cones (Rosenzweig et al. 2007). Redistribution only occurs at very bright light levels (Lobanova et al. 2007) and would not have affected any of the results we describe below from suction-electrode recording.
To gain further insight into the deactivation phase of cone transducin-mediated phototransduction, we mated the GNAT2C mice with a line of mice (R9AP95) in which the proteins of the GAP complex are over-expressed by about 6-fold (Chen et al. 2010), generating the so-called GNAT2C/R9AP95 mouse line with cone transducin and over-expressed GAP in rods. Rods in these animals have cone GNAT2 in place of rod GNAT1 and show an increased expression of RGS9-1, but expression levels of other phototransduction proteins are normal (third column of Fig. 2A). We also mated GNAT2C mice into a line of mice in which the RGS9-1 protein had been deleted, which previous experiments have shown to have no expression of RGS9-1 (Chen et al. 2000).
Suction-electrode recordings from GNAT2C rods
In Fig. 3A and B we compare mean response waveforms to brief flashes for a range of flash intensities from 21 WT and 9 GNAT2C rods recorded with suction electrodes, using methods described previously (Chen et al. 2010). There were two striking differences between WT and GNAT2C rods. First, the GNAT2C rods were less sensitive and required brighter light to produce responses of the same amplitude. This difference is clearer in Fig. 4A, where we have plotted the peak amplitude of response as a function of flash intensity for WT (filled squares) and GNAT2C (open squares) rods. In Table 1, we compare dark-adapted sensitivity ( ) and the intensity required to produce a half-maximal response (I1/2) for WT rods and from a larger sample of 27 GNAT2C rods from five mice, including those used for Fig. 4A. The GNAT2C rods are on average about 3 times less sensitive than WT rods.
Figure 3. Suction-electrode recordings of rod light responses to graded series of flashes showing acceleration of response decay after expression of cone transducin.
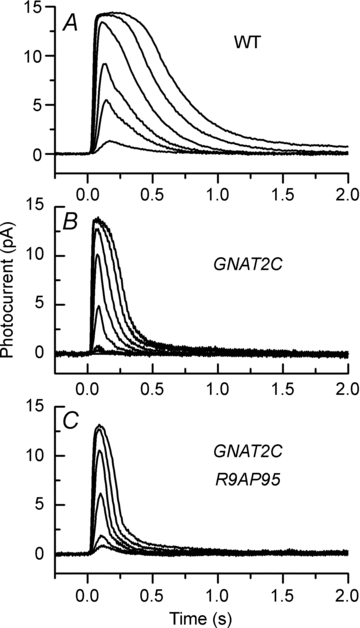
A, mean response waveforms averaged from 21 WT rods to 20 ms flashes at intensities of 4, 17, 43, 159, 453 and 863 photons μm−2. B, mean response waveforms averaged from 9 GNAT2C rods to 10 ms flashes at intensities of 8.6, 21, 79, 227, 561, 1220 and 2110 photons μm−2. C, mean response waveforms averaged from 12 GNAT2C/R9AP95 rods to 10 ms flashes at intensities of 8.6, 21, 79, 227, 561 and 1220 photons μm−2.
Figure 4. Sensitivity to flashes and backgrounds.
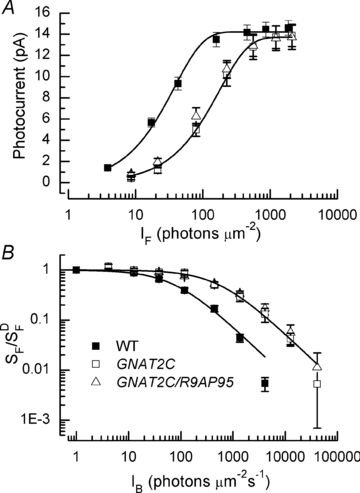
A, mean peak amplitude of responses averaged from same rods as in Fig. 3 and plotted as function of flash intensity for WT (filled squares), GNAT2C (open squares), and GNAT2C/R9AP95 (open triangles) mice. Data have been fitted with  , where r is the peak amplitude of the response to the flash, rmax is the maximum amplitude of r, I is the flash intensity, and k is a constant. Best-fitting values of k were 0.026 for WT, 0.0057 for GCAT2C and 0.0073 for GNAT2C/R9AP95. Only curves for WT and GNAT2C are shown in figure. Note that fewer rods were used for calculating the response–intensity functions than for Table 1, accounting for small differences in sensitivity and peak response amplitude. B, increment sensitivity of response to 20 ms flash in the presence of a steady background light. Sensitivity in pA photon−1μm2 was calculated in darkness (
 ) and in the presence of background light (SF) as the peak amplitude of the response in the linear range divided by the flash intensity. Ordinate gives mean sensitivity in background light divided by sensitivity in the absence of a background as a function of background intensity, averaged from 10 WT rods (filled squares), 11 GNAT2C rods (open squares), and 10 GNAT2C/R9AP95 (open triangles) rods. Continuous lines are best-fitting Weber–Fechner functions given by eqn (1) for WT rods with I0= 77 photons μm−2 s−1 and for GNAT2C rods with I0= 546 photons μm−2 s−1. A fit of the data for GNAT2C/R9AP95 rods to eqn (1) gave a best-fitting value of I0= 585 photons μm−2 s−1 (not shown).
Table 1.
Kinetic and sensitivity parameters of rods
| Animal line | rmax (pA) |
 (pA photon−1μm2) (pA photon−1μm2) |
I1/2 (photons μm−2) | ti (ms) | τREC (ms) | τD (ms) | A (s−2) |
|---|---|---|---|---|---|---|---|
| WT (16–21) | 14.2 ± 0.7 | 0.34 ± 0.03 | 28 ± 2 | 270 ± 17 | 253 ± 31 | 197 ± 16 | 20.5 ± 1.6 |
| GNAT2C (14–27) | 11.4 ± 0.5* | 0.12 ± 0.01* | 82 ± 13* | 177 ± 12* | 137 ± 15* | 118 ± 7* | 10.2 ± 0.9* |
| GNAT2C/R9AP95 (14) | 13.9 ± 1.1# | 0.084 ± 0.014 | 104 ± 15 | 151 ± 14 | 83 ± 11# | 50 ± 4# | 8.0 ± 1.0 |
All values are means ±s.e.m. Values of rmax (maximum response amplitude) were determined cell by cell from responses to saturating flashes;  (dark-adapted flash sensitivity), by dividing the peak amplitude of the mean dim-flash response for each cell by the flash intensity; I1/2 (the intensity required to produce a half-maximal response), from the fit of response–intensity data for each cell to a Boltzmann function in the program Origin; ti (the integration time), from the time integral of the mean dim-flash response for each cell divided by the peak amplitude of the response; τREC from the best-fitting exponential to the declining phase of the small-amplitude response; τD (the Pepperberg constant) for dark-adapted rods as previously described (Woodruff et al. 2008; Chen et al. 2010); and A (the amplification constant) as in Nikonov et al. (2006).
Values of GNAT2C statistically significantly different from WT at P < 0.05 (Student's t test).
Values of GNAT2C/R9AP95 statistically significantly different from GNAT2C at P < 0.05 (Student's t test).
The difference in sensitivity is also reflected in the behaviour of the GNAT2C rods in background light. In Fig. 4B, sensitivity in the presence of a background (SF) normalized cell by cell to the sensitivity in darkness ( ) is plotted as a function of background intensity for WT (filled squares) and GNAT2C (open squares) rods. The data have been fitted with the Weber–Fechner relation,
| (1) |
where IB is the intensity of the background and I0 is a constant. Best-fitting values of I0 were 77 photons μm−2 s−1 for WT rods and 546 photons μm−2 s−1 for GNAT2C rods; the GNAT2C rods were about a factor of 7 less sensitive to background light. This is greater than the sensitivity difference to flashes, probably as a result of the shorter integration time of the GNAT2C rods (Table 1).
The other striking difference between the WT and GNAT2C waveforms in Fig. 3A and B is the more rapid decay of the response of GNAT2C rods. In Fig. 5A, we compare mean responses of WT and GNAT2C rods normalized cell by cell to the maximum amplitude of each response, for flashes that closed no more than 40–50% of the channels at peak amplitude so that the response waveform was largely within the linear range of the intensity–response relation. We have fitted these mean traces with single exponential decay functions (grey traces), which gave values for the recovery constants τREC of 258 ms for WT and 122 ms for GNAT2C rods. These values are similar to averaged values from the small-amplitude τREC determined rod by rod, which were 253 ± 31 ms for WT and 137 ± 15 ms for GNAT2C rods (Table 1). Integration times also differed by a similar factor, as did the limiting time constants τD (Table 1), measured as described (see Methods and Woodruff et al. 2008; Chen et al. 2010).
Comparison of amplification constants of GNAT2C and WT rods
One possible explanation for the lower sensitivity of GNAT2C rods is a lower gain of transduction. Previous recordings from rods and cones indicate that the gain or amplification of transduction is smaller in cones than in rods (Pugh & Lamb, 1993; Zhang et al. 2003; Nikonov et al. 2006), as indicated by the slower rate of rise of the photoreceptor response per bleached pigment molecule (Rh*). The responses of GNAT2C rods also rise more slowly; the small-amplitude response of GNAT2C rods in Fig. 5A increases less rapidly than the WT response and reaches its peak amplitude later, even though the light intensity for the GNAT2C response was more than four times brighter.
We have quantified the difference in rate of rise by fitting the initial time course of the flash response with a function of the form
| (2) |
were r/rmax is the normalized flash response, I is the flash intensity in photoisomerizations from an assumed value of collecting area of 0.5 μm2 (Field & Rieke, 2002), A is the amplification constant, t is time, and teff is the effective delay time of transduction (Pugh & Lamb, 1993). We used the same collecting area for both WT and GNAT2C rods, since their outer segment dimensions and concentrations of pigment were nearly identical (see above). The time window used in fitting the data was approximately 40–50 ms but was somewhat variable, since at brighter intensities responses reach peak amplitude more rapidly. We used this equation because previous work had shown it to give a reasonable fit to the rising phase of both mouse rod and cone responses (Nikonov et al. 2006). This equation therefore provided an appropriate tool to investigate rates of activation of the GNAT2C and WT rods.
We show fits to eqn (2) for WT rods in Fig. 5B at three flash intensities (grey traces), using the same mean values from 16 rods of 20.5 s−2 for A and 18 ms for teff. The value for A is larger than previously reported (8.3 ± 1.4; Nikonov et al. 2006), probably as a result of the difference in the bandwidth of the recording. Nikonov et al. used a low-pass Bessel filter set to 20 Hz, whereas the Bessel filter in our experiments was set to 75 Hz. In a separate series of experiments, we measured A with our Bessel filter set to 35 Hz and obtained a value of 11.6 ± 0.5 from 16 rods, much closer to the value of Nikonov et al. (2006).
Similar fits are given as the grey traces in Fig. 5C for 14 GNAT2C rods with 10.2 s−2 for A and 19.3 ms for teff. For comparison, we give as the dashed grey trace in Fig. 5C the expected rise of the GNAT2C response at the brightest intensity if the amplification constant were 20.5 s−2 as for WT rods. Amplification constants were a factor of two smaller in GNAT2C rods than in WT rods. This was also true when we reduced the filter setting to 35 Hz: A for GNAT2C rods was then determined to be 5.3 ± 0.3 from nine rods.
Role of GAP proteins in accelerating response decay
The time constants of decay τREC and τD were smaller for GNAT2C rods than for WT rods (Table 1) and were nearly the same as those previously reported for native mouse cones (70–110 ms, see Nikonov et al. 2006). Both τREC and τD are known to reflect the rate of decay of activated PDE6 (Krispel et al. 2006; Tsang et al. 2006; Chen et al. 2010; Gross & Burns, 2010) via hydrolysis of transducin α GTP (TαGTP), and our results seem to indicate that the substitution of rod transducin with cone transducin is by itself sufficient to mimic much of the acceleration of the decay of activated PDE6 and faster recovery kinetics of mouse cone photoreceptors. Since, however, response recovery can occur considerably faster in the cones of other species (Baylor et al. 1987; Zhang et al. 2003), some other mechanism must also act to accelerate cone response decay. Cones in human (Zhang et al. 1999), bovine (Cowan et al. 1998) and chipmunk (Zhang et al. 2003) retinas have been reported to contain a higher concentration of the GAP protein RGS9-1, which could also act to accelerate the rate of extinction of activated PDE6 (Krispel et al. 2006; Chen et al. 2010). We therefore mated our GNAT2C mice with R9AP95 mice containing six times the normal amount of RGS9-1 (Chen et al. 2010).
Suction-electrode recordings from these GNAT2C/R9AP95 rods show that over-expression of RGS9-1 further accelerated the decline of the photoreceptor response (Fig. 3C) with little change in sensitivity to flashes (Fig. 4A, open triangles) or to backgrounds (Fig. 4B, open triangles). Mean values of τREC and τD were smaller in GNAT2C/R9AP95 rods than in GNAT2C rods (Table 1). We conclude that an increased concentration of RGS9-1 and the other members of the GAP complex can accelerate response recovery even beyond that produced by substitution of cone for rod transducin. The structure of cone transducin may facilitate hydrolysis of TαGTP, whereas a higher concentration of RGS9-1 may increase the rate of formation of the GAP complex. Both mechanisms would ultimately produce the same result: a speeding of TαGTP hydrolysis. It is of some interest that τREC and τD are similar in GNAT2C/R9AP95 rods and R9AP95 rods (Chen et al. 2010), which have over-expressed RGS9-1 but rod transducin. This shows that if the amount of RGS9-1 is sufficiently high, the rate of response recovery is no longer determined by the species of transducin in the outer segment, probably because the extinction of activated PDE6 has become so rapid that it is no longer rate-limiting for the decay of the rod response (Krispel et al. 2006; Chen et al. 2010; Gross & Burns, 2010).
We also compared the values of τREC for just-saturating responses in RGS9−/− rods having GNAT1, and in a line of mice that were RGS9−/− and GNAT2C. In RGS9−/− rods this time constant was 8.4 ± 1 s, similar to a previously published value (Chen et al. 2000); and in GNAT2C/RGS9−/− rods, τREC was 4.5 ± 0.8 s. These experiments suggest that in the absence of RGS9-1, rods with cone Tα can turn off about a factor of two more rapidly than rods with rod transducin, much as in animals containing the normal complement of this GAP complex (see Table 1). The very slow response decay in both RGS9−/− and GNAT2C/RGS9−/− rods demonstrates that the requirement of the RGS9-1 GAP complex for rapid GTP hydrolysis in rods is unchanged regardless of the presence of rod or cone transducin.
Discussion
Our results suggest that in mouse the species of the transducin α subunit may play an important and underappreciated role in determining differences in response properties of rods and cones. Rods with cone Tα are about a factor of 3 less sensitive per Rh* than WT rods; most of this difference is apparently the result of a 2-fold smaller rate of activation. The ratio of the amplification constants that we have measured from WT and GNAT2C rods is similar to the one Nikonov et al. (2006) determined from native mouse rods and cones, though, as they point out, the difference in the rates of activation of transduction would be expected to be even larger than this because of the smaller outer segment volume of the cones (see also Sakurai et al. 2007). Our experiments show that part of the difference in the rod and cone rates of activation is likely to result from less efficient coupling of cone Tα to Rh* or to PDE6, and this difference is likely to be responsible for at least part of the difference in sensitivity between WT and GNAT2C rods. We also show that GNAT2C rods turn off faster than WT rods, probably as the result of accelerated hydrolysis of TαGTP and reinhibition of PDE6. Thus the species of Tα may also influence the rate of decay of activated PDE6.
Our conclusions must remain tentative, because in addition to different species of Tα, the rods and cones have different photopigments, Tβ and Tγ subunits, and PDE6 subunits. Substitution of cone for rod photopigment has so far failed to reveal a clear role of Rh* in determining the differences of kinetics of the rod and cone responses (Kefalov et al. 2003; Shi et al. 2007; Fu et al. 2008), but no attempts have been reported to express cone transducin β and γ subunits or the cone PDE6 subunits in rods, or to express rod subunits in cones. We view our experiments as a first step, but more work will be required to provide a complete determination of the roles of the various proteins underlying the difference between rods and cones, a difference essential to the duplex nature of vertebrate vision.
Our conclusions differ from two previous attempts to specify the role of the transducin α subunits in rod and cone response kinetics. Ma et al. (2001) recorded from short wavelength-sensitive (‘green’) rods and blue-sensitive cones in salamander, which both use an identical photopigment but express different rod and cone transducins including different α subunits. They detected little difference in sensitivity per Rh* and little or no difference in response kinetics: time-to-peak of the response and integration time were not significantly different. This is quite unlike the large differences in sensitivity and response kinetics of mammalian rod and cone responses, and the relevance of these experiments to rod and cone differences in mammals has yet to be firmly established.
More recently, Deng et al. (2009) injected viral vectors containing either the rod or cone Tα gene into rd17 mice carrying a deletion in GNAT1 gene and a homozygous cpfl3 mutation in the GNAT2 gene. They then made suction-electrode and electroretinographic recordings from the retinas. From the only 10% or so of the rods that showed any light responses, they obtained variable results, which undoubtedly resulted from uncontrolled transducin expression mediated by the viral vectors. Since the rate of onset and sensitivity of the light response is likely to depend critically on the concentration of Tα, it is unclear how the kinetics of responses can be compared when the concentration of the G-protein is unknown. Although they found no significant difference in sensitivity and amplification constant in retinas after injection of rod or cone Tα vectors, it is of some interest that the maximal value of the amplification constant they recorded after injection of the rod Tα vector was a factor of two greater than the maximal value after injection of the cone Tα vector. This is not inconsistent with the result we obtained from rods that express rod and cone Tα at an equivalent level (Fig. 5).
We have shown that GNAT2C rods expressing cone Tα decay almost twice as rapidly as WT rods (Fig. 5A and Table 1). Since values for time constants of decay were similar in GNAT2C rods and native mouse cones (Nikonov et al. 2006), it is possible that the species of Tα may play an important role in determining the kinetics of decay of the two kinds of photoreceptors. The accelerated rate of response decay of cones has previously been attributed to a difference in the expression of the GAP proteins in the two kinds of photoreceptors (Cowan et al. 1998; Zhang et al. 2003), but determinations of RGS9-1 levels in the retinas of WT mice, which have primarily rods, and Nrl−/− mice, which have exclusively cones (Mears et al. 2001), indicate that the RGS9-1-to-transducin molar ratios are comparable (V. Y. Arshavsky, personal communication). Thus in mouse, the amount of GAP in the cones may not be substantially greater than in the rods, and the different rates of response decay may rather be the result of the different forms of Tα. In other animal species, cone responses have been shown to decay more rapidly than in mouse (see for example Schnapf et al. 1990; Zhang et al. 2003), and other mechanisms may also accelerate response decay. In particular, we have shown that increasing the concentration of RGS9-1 in GNAT2C rods can produce a further speeding of decay, and other processes perhaps including more rapid extinction of Rh* may also contribute.
Our results show that the molecular nature of the G-protein α subunit can play an important role in the kinetics of the photoreceptor light response. G-protein cascades are also widely used by metabotropic receptors in the nervous system and by hormone receptors all throughout the body, where they employ 16 different kinds of G-protein α subunits (Birnbaumer, 2007), some of which exist in different splice variants. Our experiments indicate that these different α subunits, together with differences in the concentration of RGS and other GAP molecules, may make a significant contribution to the speed with which hormonal and synaptic responses turn on and off. Further research may determine how the interactions of specific α subunits with receptors, effector proteins and GAP molecules are able to produce the kinetic differences we have observed.
Acknowledgments
We thank Yen-Lin Chen for technical assistance and Desheng Chen for making the transgenic construct. Transgenic founders were generated in VCU transgenic and knockout mouse core facility. This work was supported by National Institutes of Health Grants EY013811 (to C.-K.C.) and EY01844 (to G.L.F.).
Glossary
Abbreviations
- GAP
GTPase accelerating protein
- PDE6
phosphodiesterase 6
- Rh*
active form of bleached rhodopsin (metarhodopsin II)
- T
transducin
- Tα
α subunit of transducin
- WT
wild-type
Author contributions
Experiments were performed in Richmond, Virginia, and in Los Angeles, California, USA. The conception and design of the experiments were done by C.-K.C., M.L.W., and G.L.F.; the collection, analysis and interpretation of data were done by C.-K.C., M.L.W., F.S.C., H.S., M.C.C., and G.L.F.; and the drafting of the article or revising it critically for important intellectual content was done by C.-K.C. and G.L.F.
References
- Baylor DA, Nunn BJ, Schnapf JL. Spectral sensitivity of cones of the monkey Macaca fascicularis. J Physiol. 1987;390:145–160. doi: 10.1113/jphysiol.1987.sp016691. [DOI] [PMC free article] [PubMed] [Google Scholar]
- Birnbaumer L. Expansion of signal transduction by G proteins. The second 15 years or so: from 3 to 16 α subunits plus βγ dimers. Biochim Biophys Acta. 2007;1768:772–793. doi: 10.1016/j.bbamem.2006.12.002. [DOI] [PMC free article] [PubMed] [Google Scholar]
- Calvert PD, Krasnoperova NV, Lyubarsky AL, Isayama T, Nicolo M, Kosaras B, Wong G, Gannon KS, Margolskee RF, Sidman RL, Pugh EN, Jr, Makino CL, Lem J. Phototransduction in transgenic mice after targeted deletion of the rod transducin α-subunit. Proc Natl Acad Sci U S A. 2000;97:13913–13918. doi: 10.1073/pnas.250478897. [DOI] [PMC free article] [PubMed] [Google Scholar]
- Carter-Dawson LD, Lavail MM. Rods and cones in the mouse retina. I. Structural analysis using light and electron microscopy. J Comp Neurol. 1979;188:245–262. doi: 10.1002/cne.901880204. [DOI] [PubMed] [Google Scholar]
- Chen CK, Burns ME, He W, Wensel TG, Baylor DA, Simon MI. Slowed recovery of rod photoresponse in mice lacking the GTPase accelerating protein RGS9-1. Nature. 2000;403:557–560. doi: 10.1038/35000601. [DOI] [PubMed] [Google Scholar]
- Chen C-K, Woodruff ML, Chen FS, Chen D, Fain GL. Background light produces a recoverin-dependent modulation of activated-rhodopsin lifetime in mouse rods. J Neurosci. 2010;30:1213–1220. doi: 10.1523/JNEUROSCI.4353-09.2010. [DOI] [PMC free article] [PubMed] [Google Scholar]
- Cowan CW, Fariss RN, Sokal I, Palczewski K, Wensel TG. High expression levels in cones of RGS9, the predominant GTPase accelerating protein of rods. Proc Natl Acad Sci U S A. 1998;95:5351–5356. doi: 10.1073/pnas.95.9.5351. [DOI] [PMC free article] [PubMed] [Google Scholar]
- Deng WT, Sakurai K, Liu J, Dinculescu A, Li J, Pang J, Min SH, Chiodo VA, Boye SL, Chang B, Kefalov VJ, Hauswirth WW. Functional interchangeability of rod and cone transducin α-subunits. Proc Natl Acad Sci U S A. 2009;106:17681–17686. doi: 10.1073/pnas.0901382106. [DOI] [PMC free article] [PubMed] [Google Scholar]
- Drummond GB. Reporting ethical matters in The Journal of Physiology: standards and advice. J Physiol. 2009;587:713–719. doi: 10.1113/jphysiol.2008.167387. [DOI] [PMC free article] [PubMed] [Google Scholar]
- Ebrey T, Koutalos Y. Vertebrate photoreceptors. Prog Retin Eye Res. 2001;20:49–94. doi: 10.1016/s1350-9462(00)00014-8. [DOI] [PubMed] [Google Scholar]
- Fain GL, Dowling JE. Intracellular recordings from single rods and cones in the mudpuppy retina. Science. 1973;180:1178–1181. doi: 10.1126/science.180.4091.1178. [DOI] [PubMed] [Google Scholar]
- Field GD, Rieke F. Nonlinear signal transfer from mouse rods to bipolar cells and implications for visual sensitivity. Neuron. 2002;34:773–785. doi: 10.1016/s0896-6273(02)00700-6. [DOI] [PubMed] [Google Scholar]
- Fu Y, Kefalov V, Luo DG, Xue T, Yau KW. Quantal noise from human red cone pigment. Nat Neurosci. 2008;11:565–571. doi: 10.1038/nn.2110. [DOI] [PMC free article] [PubMed] [Google Scholar]
- Gross OP, Burns ME. Control of rhodopsin's active lifetime by arrestin-1 expression in mammalian rods. J Neurosci. 2010;30:3450–3457. doi: 10.1523/JNEUROSCI.5391-09.2010. [DOI] [PMC free article] [PubMed] [Google Scholar]
- Kefalov V, Fu Y, Marsh-Armstrong N, Yau KW. Role of visual pigment properties in rod and cone phototransduction. Nature. 2003;425:526–531. doi: 10.1038/nature01992. [DOI] [PMC free article] [PubMed] [Google Scholar]
- Kefalov VJ, Estevez ME, Kono M, Goletz PW, Crouch RK, Cornwall MC, Yau KW. Breaking the covalent bond – a pigment property that contributes to desensitization in cones. Neuron. 2005;46:879–890. doi: 10.1016/j.neuron.2005.05.009. [DOI] [PMC free article] [PubMed] [Google Scholar]
- Korenbrot JI. Ca2+ flux in retinal rod and cone outer segments: differences in Ca2+ selectivity of the cGMP-gated ion channels and Ca2+ clearance rates. Cell Calcium. 1995;18:285–300. doi: 10.1016/0143-4160(95)90025-x. [DOI] [PubMed] [Google Scholar]
- Krispel CM, Chen D, Melling N, Chen YJ, Martemyanov KA, Quillinan N, Arshavsky VY, Wensel TG, Chen CK, Burns ME. RGS expression rate-limits recovery of rod photoresponses. Neuron. 2006;51:409–416. doi: 10.1016/j.neuron.2006.07.010. [DOI] [PubMed] [Google Scholar]
- Lobanova ES, Finkelstein S, Song H, Tsang SH, Chen CK, Sokolov M, Skiba NP, Arshavsky VY. Transducin translocation in rods is triggered by saturation of the GTPase-activating complex. J Neurosci. 2007;27:1151–1160. doi: 10.1523/JNEUROSCI.5010-06.2007. [DOI] [PMC free article] [PubMed] [Google Scholar]
- Ma J, Znoiko S, Othersen KL, Ryan JC, Das J, Isayama T, Kono M, Oprian DD, Corson DW, Cornwall MC, Cameron DA, Harosi FI, Makino CL, Crouch RK. A visual pigment expressed in both rod and cone photoreceptors. Neuron. 2001;32:451–461. doi: 10.1016/s0896-6273(01)00482-2. [DOI] [PubMed] [Google Scholar]
- Mears AJ, Kondo M, Swain PK, Takada Y, Bush RA, Saunders TL, Sieving PA, Swaroop A. Nrl is required for rod photoreceptor development. Nat Genet. 2001;29:447–452. doi: 10.1038/ng774. [DOI] [PubMed] [Google Scholar]
- Nikonov SS, Kholodenko R, Lem J, Pugh EN., Jr Physiological features of the S- and M-cone photoreceptors of wild-type mice from single-cell recordings. J Gen Physiol. 2006;127:359–374. doi: 10.1085/jgp.200609490. [DOI] [PMC free article] [PubMed] [Google Scholar]
- Perry RJ, McNaughton PA. Response properties of cones from the retina of the tiger salamander. J Physiol. 1991;433:561–587. doi: 10.1113/jphysiol.1991.sp018444. [DOI] [PMC free article] [PubMed] [Google Scholar]
- Picones A, Korenbrot JI. Permeability and interaction of Ca2+ with cGMP-gated ion channels differ in retinal rod and cone photoreceptors. Biophys J. 1995;69:120–127. doi: 10.1016/S0006-3495(95)79881-2. [DOI] [PMC free article] [PubMed] [Google Scholar]
- Pugh EN, Jr, Lamb TD. Amplification and kinetics of the activation steps in phototransduction. Biochim Biophys Acta. 1993;1141:111–149. doi: 10.1016/0005-2728(93)90038-h. [DOI] [PubMed] [Google Scholar]
- Rieke F, Baylor DA. Origin and functional impact of dark noise in retinal cones. Neuron. 2000;26:181–186. doi: 10.1016/s0896-6273(00)81148-4. [DOI] [PubMed] [Google Scholar]
- Rosenzweig DH, Nair KS, Wei J, Wang Q, Garwin G, Saari JC, Chen CK, Smrcka AV, Swaroop A, Lem J, Hurley JB, Slepak VZ. Subunit dissociation and diffusion determine the subcellular localization of rod and cone transducins. J Neurosci. 2007;27:5484–5494. doi: 10.1523/JNEUROSCI.1421-07.2007. [DOI] [PMC free article] [PubMed] [Google Scholar]
- Sakurai K, Onishi A, Imai H, Chisaka O, Ueda Y, Usukura J, Nakatani K, Shichida Y. Physiological properties of rod photoreceptor cells in green-sensitive cone pigment knock-in mice. J Gen Physiol. 2007;130:21–40. doi: 10.1085/jgp.200609729. [DOI] [PMC free article] [PubMed] [Google Scholar]
- Sampath AP, Matthews HR, Cornwall MC, Bandarchi J, Fain GL. Light-dependent changes in outer segment free Ca2+ concentration in salamander cone photoreceptors. J Gen Physiol. 1999;113:267–277. doi: 10.1085/jgp.113.2.267. [DOI] [PMC free article] [PubMed] [Google Scholar]
- Schnapf JL, Nunn BJ, Meister M, Baylor DA. Visual transduction in cones of the monkey Macaca fascicularis. J Physiol. 1990;427:681–713. doi: 10.1113/jphysiol.1990.sp018193. [DOI] [PMC free article] [PubMed] [Google Scholar]
- Shi G, Yau KW, Chen J, Kefalov VJ. Signaling properties of a short-wave cone visual pigment and its role in phototransduction. J Neurosci. 2007;27:10084–10093. doi: 10.1523/JNEUROSCI.2211-07.2007. [DOI] [PMC free article] [PubMed] [Google Scholar]
- Tachibanaki S, Arinobu D, Shimauchi-Matsukawa Y, Tsushima S, Kawamura S. Highly effective phosphorylation by G protein-coupled receptor kinase 7 of light-activated visual pigment in cones. Proc Natl Acad Sci U S A. 2005;102:9329–9334. doi: 10.1073/pnas.0501875102. [DOI] [PMC free article] [PubMed] [Google Scholar]
- Tachibanaki S, Tsushima S, Kawamura S. Low amplification and fast visual pigment phosphorylation as mechanisms characterizing cone photoresponses. Proc Natl Acad Sci U S A. 2001;98:14044–14049. doi: 10.1073/pnas.241396898. [DOI] [PMC free article] [PubMed] [Google Scholar]
- Tsang SH, Woodruff ML, Chen CK, Yamashita CY, Cilluffo MC, Rao AL, Farber DB, Fain GL. GAP-independent termination of photoreceptor light response by excess γ subunit of the c-GMP-phosphodiesterase. J Neurosci. 2006;26:4472–4480. doi: 10.1523/JNEUROSCI.4775-05.2006. [DOI] [PMC free article] [PubMed] [Google Scholar]
- Tsang SH, Woodruff ML, Janisch KM, Cilluffo MC, Farber DB, Fain GL. Removal of phosphorylation sites of γ subunit of phosphodiesterase 6 alters rod light response. J Physiol. 2007;579:303–312. doi: 10.1113/jphysiol.2006.121772. [DOI] [PMC free article] [PubMed] [Google Scholar]
- Woodruff ML, Janisch KM, Peshenko IV, Dizhoor AM, Tsang SH, Fain GL. Modulation of phosphodiesterase6 turnoff during background illumination in mouse rod photoreceptors. J Neurosci. 2008;28:2064–2074. doi: 10.1523/JNEUROSCI.2973-07.2008. [DOI] [PMC free article] [PubMed] [Google Scholar]
- Woodruff ML, Olshevskaya EV, Savchenko AB, Peshenko IV, Barrett R, Bush RA, Sieving PA, Fain GL, Dizhoor AM. Constitutive excitation by Gly90Asp rhodopsin rescues rods from degeneration caused by elevated production of cGMP in the dark. J Neurosci. 2007;27:8805–8815. doi: 10.1523/JNEUROSCI.2751-07.2007. [DOI] [PMC free article] [PubMed] [Google Scholar]
- Zhang K, Howes KA, He W, Bronson JD, Pettenati MJ, Chen C, Palczewski K, Wensel TG, Baehr W. Structure, alternative splicing, and expression of the human RGS9 gene. Gene. 1999;240:23–34. doi: 10.1016/s0378-1119(99)00393-5. [DOI] [PubMed] [Google Scholar]
- Zhang X, Wensel TG, Kraft TW. GTPase regulators and photoresponses in cones of the eastern chipmunk. J Neurosci. 2003;23:1287–1297. doi: 10.1523/JNEUROSCI.23-04-01287.2003. [DOI] [PMC free article] [PubMed] [Google Scholar]