Abstract
There are two types of direction-selective ganglion cells (DSGCs) identified in the rabbit retina, which can be readily distinguished both morphologically and physiologically. The well characterized ON–OFF DSGCs respond to a broad range of image velocities whereas the less common ON DSGCs are tuned to slower image velocities. This study examined how the synaptic inputs shape the velocity tuning of DSGCs in an isolated preparation of the rabbit retina. The receptive-field properties were mapped by extracellular spike recordings and compared with the light-evoked excitatory and inhibitory synaptic conductances that were measured under voltage-clamp. The synaptic mechanisms underlying the generation of direction selectivity appear to be similar in both cell types in that preferred-direction image motion elicits a greater excitatory input and null-direction image motion elicits a greater inhibitory input. To examine the temporal tuning of the DSGCs, the cells were stimulated with either a grating drifted over the receptive-field centre at a range of velocities or with a light spot flickered at different temporal frequencies. Whereas the excitatory and inhibitory inputs to the ON–OFF DSGCs are relatively constant over a wide range of temporal frequencies, the ON DSGCs receive less excitation and more inhibition at higher temporal frequencies. Moreover, transient inhibition precedes sustained excitation in the ON DSGCs, leading to slowly activating, sustained spike responses. Consequently, at higher temporal frequencies, weaker excitation combines with fast-rising inhibition resulting in lower spike output.
Introduction
Some types of retinal ganglion cells (RGCs) fire strongly when stimulated by image motion in a ‘preferrxed’ direction but are silent for movement in the opposite ‘null’ direction. There are two types of direction-selective ganglion cells (DSGCs) identified in the rabbit retina: the ON–OFF DSGCs respond to both light and dark contrast whereas the ON DSGCs respond only to light contrast (Barlow et al. 1964; reviewed by Vaney et al. 2001). The ON–OFF DSGCs respond to a broad range of image velocities and fire transiently in response to step illumination, whereas the ON DSGCs are tuned to slower image velocities and show sustained firing to standing contrast (Oyster, 1968; Wyatt & Daw, 1975).
The key mechanism underlying the direction selective (DS) responses of both types of DSGCs appears to be null-direction inhibition mediated by GABAergic amacrine cells (Barlow & Levick, 1965; Caldwell & Daw, 1978). It has been shown directly for the ON–OFF DSGCs that the starburst amacrine cells provide a spatially asymmetric inhibitory input that is already directional (Euler et al. 2002; Fried et al. 2002; Lee & Zhou, 2006). The ON–OFF DSGCs also receive a directional excitatory input that facilitates the responses to preferred-direction image motion and acts in a push-pull fashion with the directional inhibitory input (Borg-Graham, 2001; Fried et al. 2002; Taylor & Vaney, 2002). Postsynaptic mechanisms also seem to play an important role in shaping the receptive-field properties of the DSGCs (Oesch et al. 2005).
Biochemical ablation of the starburst cells abolishes not only the direction selectivity of RGCs but also the optokinetic eye reflex (Yoshida et al. 2001; Amthor et al. 2002), the visual input to which is mediated by ON DSGCs projecting to the accessory optic system and ON–OFF DSGCs projecting to the nucleus of the optic tract (Simpson, 1984). The dendrites of the monostratified ON DSGCs branch in the same stratum (S4) of the inner plexiform layer (IPL) as both the inner dendrites of the bistratified ON–OFF DSGCs and the unistratified dendrites of the ON starburst cells (Famiglietti, 1992). The co-stratified cells could receive excitatory glutamatergic input from only a few types of ON cone bipolar cells that branch in S4 (Famiglietti, 2002; MacNeil et al. 2004) but it is not known whether the two types of DSGCs share common inputs from individual bipolar cells.
In this study, we examined whether the synaptic inputs to the ON DSGCs in the rabbit retina are already directional and also studied the relative timing of excitation and inhibition. In order to probe the temporal tuning of the two types of DSGCs, we measured the synaptic inputs produced either by grating stimuli moving at different velocities or by a light spot flickered at different frequencies. In this way, we have shown how differences in the synaptic inputs account for the different receptive-field properties of the two types of DSGCs, including their responses to standing contrast and their velocity tuning.
Methods
Experiments were performed on adult pigmented rabbits of either sex. All reagents were obtained from Sigma (St Louis, MO, USA), unless otherwise indicated. Experiments conducted in Brisbane, Australia were in accordance with the Australian Code of Practice and the protocols were approved by the Animal Ethics Committee of the University of Queensland. Experiments conducted in Portland, Oregon, were in accordance with the National Institutes of Health Guidelines, and the protocols were approved by the Institutional Animal Care & Use Committee at Oregon Health & Science University. The experiments comply with the policies of The Journal of Physiology set out by Drummond (2009).
Retinal preparation and visualization
Dark-adapted rabbits were anaesthetized (12 mg kg−1 ketamine, 12 mg kg−1 xylazine, i.m.) before being overdosed with pentobarbitone sodium (150 mg kg−1, i.v.). Following overdose, the eyes were quickly enucleated, hemisected, and placed in carbogenated Ames medium at room temperature (pH 7.4). The retina was dissected from the sclera under infrared (IR) illumination, placed in a recording chamber (Warner, Hamden, CT, USA 26-GLP), held by a slice anchor (Warner, Hamden, CT, USA SHD 26GH/2) and perfused at 5 ml min−1 with Ames medium at 34°C. The recording chamber was placed on a fixed-stage Olympus BX-51 microscope with a dual-magnification port, which allowed simultaneous light stimulation of the retina at 20× (∼1 mm diameter) and visualization of the RGC somata at 80× using IR gradient-contrast (Dodt et al. 1999).
Electrophysiological recording
Recording electrodes were pulled from borosilicate glass to a resistance of ∼3–5 MΩ. Extracellular electrodes were filled with Ames medium and patch electrodes for voltage-clamp experiments were filled with the following: 130 mm caesium methanesulphonate, 5 mm Na-Hepes, 1 mm EGTA, 7.5 mm NaCl, 1 mm Na-ATP, 0.1 mm Na-GTP, 3 mm lidocaine N-ethyl chloride (QX-314), balanced to pH 7.2 with CsOH. Cs+ was used to block voltage-gated K+ channels and thereby improve the voltage clamp at more positive potentials while QX-314 blocked voltage-gated Na+ channels and abolished all spiking activity less than 1 min after establishing the whole-cell configuration. For the current-clamp recordings of spike activity, Cs+ was replaced with K+ and QX-314 was excluded. A liquid junction potential of 10 mV was subtracted from all traces and there was no compensation for the series resistance, which averaged 22 ± 5 MΩ in a representative sample of seven cells (± standard deviation).
The calculation of the excitatory and inhibitory components of the light-evoked synaptic inputs has been described in detail previously (Borg-Graham, 2001; Taylor & Vaney, 2002). Briefly, the visual stimulus was repeated while voltage clamping the RGCs at a range of potentials from −90 mV to −10 mV in 10 mV increments. The resting current–voltage (I–V) relation was measured 100–200 ms prior to the onset of the light stimulus. To obtain the net light-evoked conductance as a function of time, the leak I–V relation was subtracted from I–V relations measured every 10 ms for the duration of the light stimulation. The total light-evoked conductance change was estimated from the slope of the linear regression fit to each I–V relation. The total conductance was assumed to comprise a sum of linear excitatory and inhibitory conductance components with reversal potentials of 0 mV and −65 mV, respectively.
Visual stimulation
Visual stimuli were generated using custom software (Igor Pro; WaveMetrics, Inc., Lake Oswego, OR, USA) and presented on a Macintosh computer monitor with a refresh rate of 85 Hz, using only the green gun of the cathode ray tube. The stimuli were projected through the microscope and focused onto the photoreceptor outer segments with a 20× objective (0.95 NA). In most experiments, the background illumination was maintained above the level of rod saturation at ∼3.5 × 10¹¹ quanta cm−2 s−1 and the visual stimuli were set at ±80% of the background (1.75 × 10¹¹ quanta cm−2 s−1 for OFF stimuli; 5.25 × 10¹¹ quanta cm−2 s−1 for ON stimuli). Bright and dark test spots (300 μm diameter) were used to test the light responses of DSGCs: ON–OFF DSGCs typically responded with a brief burst of spikes at the onset and termination of a bright or dark spot whereas ON DSGCs responded with sustained firing for the duration of a bright spot.
Dye labelling
In some experiments, the dendritic morphology of physiologically characterised ON DSGCs was recovered either by including 200 μm Lucifer yellow in the patch electrode or by semi-loose seal electroporation of 2% Neurobiotin (Vector Laboratories, Burlingame, CA, USA) in an intracellular solution following cell-attached recording of the spike responses (Kanjhan & Vaney, 2008; Sivyer et al. 2010). The dendritic morphology of dye-injected RGCs was reconstructed by confocal microscopy (Zeiss LSM 510 Meta).
Results
Cell identification and dendritic morphology
It is known that the ON DSGCs have a medium–large soma of 15–20 μm diameter (Oyster et al. 1980; Buhl & Peichl, 1986) and this was the primary feature used to initially target the ON DSGCs for recording. Although both the ON DSGCs and the ON–OFF DSGCs have an offset crescent-shaped nucleus (Vaney, 1994), the soma of the ON DSGCs is slightly larger than that of the ON–OFF DSGCs, and appears more mitered, perhaps due to the larger primary dendrites protruding laterally from the soma (data not shown). The cell's physiological identity was established by mapping spike responses to moving bars of light, as described below. Dye filling of these physiologically characterized ON DSGCs confirmed that the dendritic morphology matched the appearance of the ON DSGCs and the accessory optic system (AOS) projecting RGCs described in earlier studies on the rabbit retina (Buhl & Peichl, 1986; Amthor et al. 1989; Pu & Amthor, 1990; He & Masland, 1998). To summarize: ON DSGCs located close to the visual streak had a large dendritic field of 400–500 μm diameter and the terminal dendrites were located throughout the field, often departing at right angles from the parent dendrite to produce a space-filling lattice. Moreover, ChAT-immunolabelling of preparations containing ON DSGCs that had been physiologically identified and then filled with dye showed similar stratification (Famiglietti, 1992), and strong co-fasciculation between the dendrites of the ON DSGCs and the starburst cells (not illustrated), as previously reported for the ON DSGCs (Dong et al. 2004) and the ON–OFF DSGCs (Vaney et al. 1989; Vaney & Pow, 2000; Dong et al. 2004). Fried et al. (2002) reported that starburst cells located on the null side of an ON–OFF DSGC co-fasciculate more strongly with the ganglion cell than starburst cells located on the preferred side, thus providing a possible anatomical substrate for directional inhibitory inputs. However, in this study of the ON DSGCs, in agreement with other studies on the ON–OFF DSGCs (Vaney et al. 1989; Vaney & Pow, 2000; Dong et al. 2004), we could see no evidence for such an asymmetry.
Directionality of ON DSGCs
Because the direction of image motion is encoded by only three subtypes of ON DSGCs compared with four subtypes of ON–OFF DSGCs, it might be expected that the directional tuning of the ON DSGCs would be broader than that of the ON–OFF DSGCs. We tested this notion directly by comparing the tuning curves for the spike responses of the two types of DSGCs. Figure 1B shows the responses of an ON DSGC to a bar of light swept across the receptive field in 12 directions, spaced at 30 deg intervals. In order to maximise the preferred-null differences, a narrow bar was used (200 × 300 μm); this reduced the standing contrast of the stimulus, thereby minimizing the non-directional sustained response.
Figure 1. Directional tuning of DSGCs.
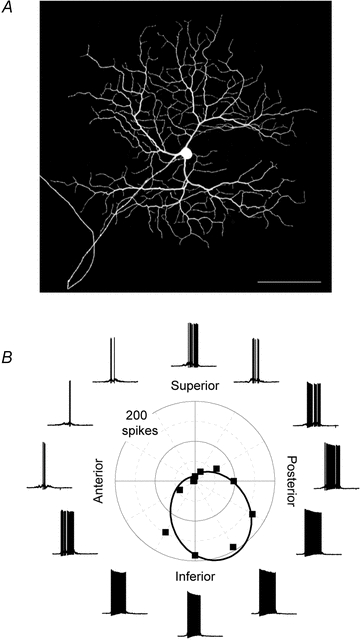
A, dendritic morphology of an ON DSGC revealed by dye filling with Neurobiotin; the terminal dendrites often branch at right angles from the parent dendrite, producing a space-filling lattice. Scale bar = 100 μm. B, current-clamp recordings from an ON DSGC in response to a light bar moved in 12 directions through the receptive field; the polar plot shows the mean number of spikes for each direction of image motion (squares), together with a von Mises fit of the data (continuous line).
For samples of both types of DSGCs, the preferred direction of each cell was determined for both the spike count and the maximum spike rate, the preferred direction was normalized to 0 deg, and the mean tuning curves calculated. The direction selectivity index (DSI, see Methods) calculated for total spike counts from the mean tuning curves was close to 0.5 for both the ON DSGCs (DSI = 0.45, n= 17) and the ON–OFF DSGCs (ON DSI = 0.50, OFF DSI = 0.57, n= 55; Fig. 2A and B, left panels). The DSI calculated for the maximum spike rate was slightly lower for both cell types because the preferred-null modulation of this measure was smaller than for the spike count (DSI for ON DSGC = 0.37, ON DSI for ON–OFF DSGC = 0.41, OFF DSI for ON–OFF DSGC = 0.44; Fig. 2A and B, right panels). Thus, contrary to our initial expectation, the tuning functions for the ON DSGCs and the ON- and OFF-components of the ON–OFF DSGCs were very similar.
Figure 2. Mean directional tuning functions for ON and ON–OFF DSGCs.
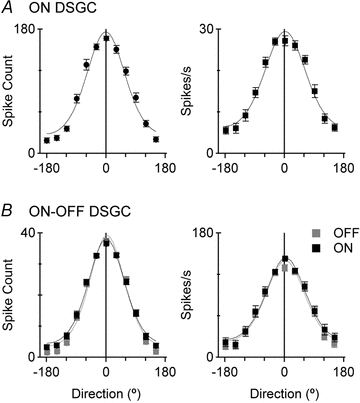
Mean directional tuning functions for 17 ON DSGCs (A) and 55 ON–OFF DSGCs (B), showing both the total spike counts to a light bar moved in 12 directions through the receptive field (left panels) and the maximum firing rate (right panels). The continuous line shows the von Mises fit for each data set.
The directional tuning curves of the DSGCs were fitted with a von Mises distribution, which is the circular analogue to the Gaussian distribution (Fig. 2A and B). The response R, as a function of stimulus direction, is given as:
where Rmax is the maximum response, μ becomes the preferred direction in degrees, and κ is the concentration parameter, which accounts for the tightness of the directional tuning. For the spike counts, the directional tuning of the ON DSGCs (κ= 0.91 ± 0.07) was almost as tight as that of the ON–OFF DSGCs (ON: κ= 1.06 ± 0.05, OFF: 1.09 ± 0.09). Similarly, for the maximum spike rate, the directional tuning of the ON DSGCs (κ= 0.75 ± 0.05) was only slightly broader than that of the ON–OFF DSGCs (ON: κ= 0.86 ± 0.04, OFF: 0.89 ± 0.07).
For both types of DSGCs, the von Mises distribution did not provide an ideal fit to the directional tuning curves as revealed by subtracting the fitted curves from the data. The resulting residuals displayed systematic deviations from zero because the best-fitting von Mises distribution was slightly narrower and more peaked than the data. Interestingly, for the best fitting sinusoids, the residuals appeared to be randomly distributed around zero, indicating a closer fit to the tuning curves for both types of DSGCs (data not shown).
The preferred directions of 25 ON DSGCs recorded near the central visual streak in the left retina formed three evenly spaced clusters, the first pointing anterior (mean = 349 ± 9 deg, n= 9), the second pointing superior (mean = 116 ± 11 deg, n= 11), and the third pointing inferior (mean = 247 ± 16 deg, n= 5). The three clusters matched very closely the preferred directions of the three subtypes of ON DSGCs originally mapped by Oyster & Barlow (1967), who reported preferred directions for the anterior, superior and inferior clusters of 343 ± 12 deg, 105 ± 11 deg and 244 ± 16 deg, respectively (Oyster, 1968). The three preferred directions appear to correspond to rotation about the best response axes of the three semicircular canals in the inner ear, which would allow signals of rotational head motion from two different sensory modalities to be combined in a common coordinate system (Simpson, 1984; Simpson et al. 1988).
Directional synaptic inputs
Previous studies of the ON–OFF DSGCs in the rabbit retina have shown that the excitatory and inhibitory inputs to the cells are already directional (Fried et al. 2002; Taylor & Vaney, 2002), and similar results have been obtained for homologous cells in the mouse retina (Weng et al. 2005). While ON-DSGCs have been examined in the mouse (Sun et al. 2006), they have not be studied in rabbit. In order to examine the synaptic mechanisms underlying the different velocity tuning of ON–OFF and ON-DSGCs, we first needed to quantify the synaptic mechanisms that generate direction selectivity in rabbit ON-DSGCs.
The preferred direction of the ON DSGCs was determined from extracellular spike recordings (Figs 1B and 3A and B) and the cell was then patch-clamped while the stimulus bar was moved along the preferred-null axis. The membrane potential was stepped to a range of values between −90 and −10 mV and, at each potential, the preferred and null stimuli were repeated; the resulting light-evoked currents represent a mix of excitatory and inhibitory inputs (Fig. 3C and D). The current–voltage relations near the peak of the synaptic responses were linear over most of the voltage range (Fig. 3E and F), suggesting that voltage-clamp errors did not introduce strong non-linearities. The directional synaptic inputs produced a depolarizing shift in the whole-cell zero-current potential (Fig. 3G and H) during preferred-direction stimuli, corresponding to the increased spiking response.
Figure 3. Conductance analysis of voltage-clamped currents in ON DSGCs.
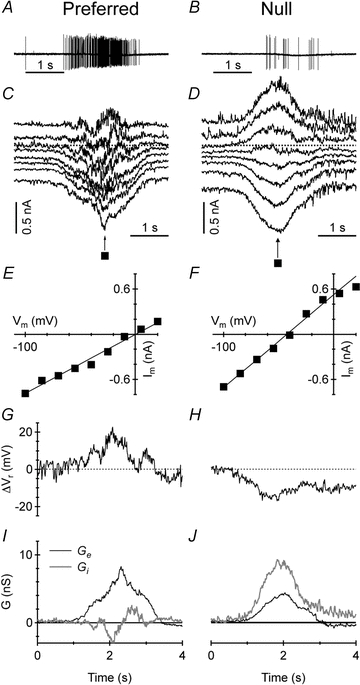
A and B, extracellular spike responses of an ON DSGC to a light bar moving in the preferred direction (A) and the opposite null direction (B). C and D, current recordings at holding potentials from −90 to −10 mV in response to a light bar moving in the preferred direction (C) and the null direction (D). E and F, sample I–V plots at the time points marked with a black square in C and D; the continuous line shows the linear fit to the I–V relation. G and H, change in the whole-cell zero-current potential (ΔVr), calculated by interpolation of the whole-cell I–V plots; ΔVr was depolarized during preferred-direction motion (G) and hyperpolarized during null-direction motion (H). I and J, excitatory (Ge, black) and inhibitory (Gi, grey) synaptic conductance calculated for the voltage-clamped responses to preferred-direction motion (I) and null-direction motion (J); Ge was greater in the preferred direction whereas Gi was greater in the null direction.
The analysis revealed that inhibition was generally larger during null-direction stimulation and, conversely, excitation was larger during preferred-direction stimulation (Fig. 3I and J). Moreover, in the null direction inhibition was coincident with excitation, whereas in the preferred direction the inhibition was delayed relative to the peak excitation. The integral inhibitory conductance in the null direction (denoted GI,N) was typically about 3 times that in the preferred direction (GI,N/GI,P= 3.4 ± 2.0, n= 18, Fig. 4), although two cells had a ratio of unity (GI,N/GI,P= 1.0, 1.0). The integral excitatory conductance showed less pronounced differences, with that in the preferred direction (denoted GE,P) usually being 1.6 times larger than that in the null direction (GE,P/GE,N= 1.6 ± 0.7), although 2 of the 18 cells had a ratio slightly below unity (GE,P/GE,N= 0.9, 0.9). The stronger directionality of the inhibition meant that the total conductance was slightly larger in the null direction (GT,N/GT,P= 1.6 ± 0.6).
Figure 4. Directionality of synaptic inputs to ON DSGCs.
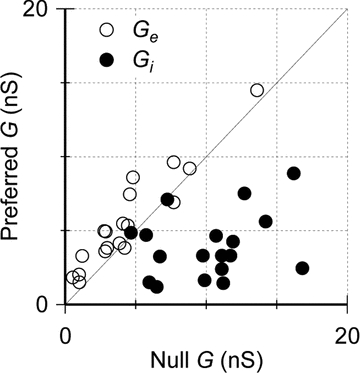
The integrated excitatory conductance (GE) and the integrated inhibitory conductance (GI) in the preferred direction plotted against those in the null direction; in most cells, GE was greater in the preferred direction while GI was greater in the null direction.
Responses to step illumination
The findings that the ON DSGCs and the ON–OFF DSGCs show similarities in both the directionality of their synaptic inputs and the directional tuning of their spike responses suggest that common synaptic mechanisms may underlie the generation of direction selectivity. However there are clear differences in the temporal properties of the two cell types, which are readily apparent from the spike responses to step illumination of the receptive-field centre. During a long step of light, ON–OFF DSGCs responded with transient bursts of spikes at both light-ON and light-OFF, whereas the ON DSGCs responded with sustained firing throughout the light step (Fig. 5A and B).
Figure 5. Step responses and intrinsic membrane properties of DSGCs.
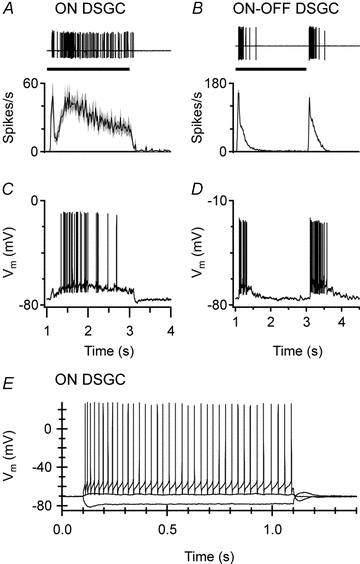
A and B, extracellular spike recordings of individual DSGCs (upper panels) and mean spike-frequency histograms (±s.e.m.) of 20 ON DSGCs and 11 ON–OFF DSGCs (lower panels) to a light spot flashed in the receptive-field centre for 2 s; the ON DSGCs show sustained firing throughout the flash whereas the ON–OFF DSGCs fire transiently at the onset and termination of the flash. C and D, current-clamp recordings from an ON DSGC (C) and an ON–OFF DSGC (D) in response to the same stimulus as A and B. E, steady current injection into an ON DSGC produces sustained firing that shows only mild accommodation.
Closer examination revealed a characteristic substructure to the step response of the ON DSGCs: an initial burst of spikes, which peaked 125 ± 26 ms (n= 20) after light onset, was followed by a short quiescent period, with the trough occurring 169 ± 28 ms (n= 14) after light onset. The firing then gradually increased to a secondary peak that was generally similar to the initial transient. Whole-cell recordings under current-clamp showed that the trough in spiking coincided with a brief hyperpolarization of the somatic membrane potential (Fig. 5C and D). Such a ‘pause’ in spiking was also reported by Roska et al. (2006) for the ON delta cells in the rabbit retina, which they proposed were ON DSGCs.
The transient/sustained dichotomy in the spike responses to step illumination suggests that the inputs to the two types of DSGCs have different temporal properties. A previous study (Oesch et al. 2005) has shown that the transient responsiveness of the ON–OFF DSGCs does not arise from intrinsic membrane properties because the spike discharge was sustained, showing little evidence of accommodation during steady depolarization. Similar to the ON–OFF DSGCs, the spike discharge of the ON DSGCs was sustained for the duration of steady depolarizing current injection and showed only mild accommodation (Fig. 5E). For small current steps close to rest, the voltage responses were linear; during larger depolarizing currents that reached or exceeded threshold, the spike rate increased linearly with the injection current (data not shown).
We next determined the magnitude and time-course of the excitatory and inhibitory inputs to the ON DSGCs that generated the spike responses to step illumination and compared these with the inputs to the ON–OFF DSGCs. The stimulus was identical to the one used for the experiments in Fig. 5. In the ON DSGCs, step illumination produced sustained excitatory input (Fig. 6A), which generated the sustained spiking evident in Fig. 5A. The hyperpolarization and spiking trough correlated with a transient inhibitory input, which decayed within ∼500 ms (Fig. 6C). In the ON–OFF DSGCs, the excitatory inputs were activated with a shorter delay than inhibition and were transient (Fig. 6B and D), in contrast to the ON DSGCs, thus accounting for the transient spike discharge of the ON–OFF DSGCs (Fig. 5B). Thus the analysis of the synaptic conductances indicates that the transient/sustained dichotomy in the spike responses of the two types of DSGCs results largely from the differences in the dynamics of the excitatory synaptic inputs.
Figure 6. Excitatory and inhibitory conductances evoked by step illumination in ON and ON–OFF DSGCs.
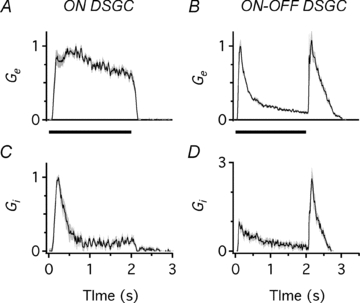
Excitatory conductance (Ge) and inhibitory conductance (Gi) evoked by step illumination in an ON DSGC (A and C) and an ON–OFF DSGC (B and D). Ge remains elevated throughout illumination in the ON DSGC but rises transiently at the onset and termination of the flash in the ON–OFF DSGC.
Temporal tuning of DSGCs
Previous studies have shown that ON–OFF DSGCs respond to a broader range of image velocities than ON DSGCs, which are more narrowly tuned to lower velocities (Oyster, 1968; Oyster et al. 1971), commensurate with a presumed role in signalling small image displacements arising from retinal slip (Simpson, 1984; Vaney et al. 2001). A series of experiments were designed to test whether the temporal differences apparent with step illumination could explain the differences in velocity tuning.
These experiments targeted the inputs to the receptive-field centre. Two types of stimuli were used: (1) drifting gratings, which would potentially engage directional mechanisms, and (2) a stationary flickering spot. Stimuli were presented within a 300 μm diameter window centred on the receptive field of the DSGC; the surrounding retina outside the window was maintained at the background illumination level. Square-wave gratings of 200 μm periodicity were drifted in the preferred direction at image velocities ranging from 50 to 1200 μm s−1 (corresponding to 0.3–7.2 deg s−1 in visual field terms; Hughes & Vaney, 1981). The luminance of the stationary spot was modulated sinusoidally at frequencies ranging from 0.25 to 8 Hz, which matched the range of temporal modulation produced by the drifting-grating stimuli.
Average spike-time histograms for the two stimuli were generated for a group of ON DSGCs (n= 11) and ON–OFF DSGCs (n= 15) for the range of temporal modulation (Fig. 7A and B). Responses in the ON–OFF DSGCs declined sharply within the first 2 s and more gradually thereafter, while the ON DSGCs were more sustained, and even showed a gradual increase in spike rate at the higher drift velocities. The magnitude of the responses was measured as the total number of spikes generated over the 8 s period of stimulation. The tuning functions for the flickering spot and the drifting grating stimuli superimposed very well, when vertically scaled to account for differences in the absolute number of spikes generated (Fig. 7C and D). The drifting grating stimuli produced about 3-fold more spikes than the stationary flicker for the ON DSGCs (Fig. 7C), and about 2-fold more spikes for the ON–OFF DSGCs (Fig. 7D).
Figure 7. Temporal response properties of DSGCs to moving gratings and stationary flickering spots.
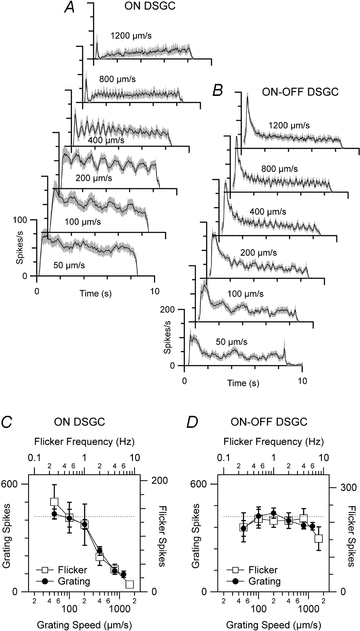
A and B, mean spike-frequency histograms (±s.e.m.) for ON DSGCs (n= 11) and ON–OFF DSGCs (n= 15) in response to gratings moved in the preferred direction at different velocities. C and D, spike counts in response to moving gratings (filled circles) and stationary flickering spots (open squares) matched for temporal frequency; the spike counts are vertically scaled to account for differences in the absolute number of spikes generated by moving and stationary temporal stimuli.
The responses of the ON DSGCs were greatest at grating velocities of 50–200 μm s−1 (0.25–1 Hz) and declined steeply at velocities greater than ∼200 μm s−1 (Fig. 7C). In contrast, the responses of the ON–OFF DSGCs were relatively flat across the velocity range (Fig. 7D). The relative spike responses of the two types of DSGCs were significantly different at each frequency above 0.25 Hz (two-tailed, unpaired t test: 0.5 Hz, P < 0.05; 1–8 Hz, P < 0.001). These experiments confirmed that the ON DSGCs respond poorly to fast image velocities, whereas the ON–OFF DSGCs respond well over the whole range.
The weak spike responses of the ON DSGCs at higher image velocities could result from either less excitatory input or greater inhibitory input, or both. To determine which was the case, the drifting-grating experiments were repeated while measuring synaptic conductances under voltage-clamp in six ON–OFF DSGCs and seven ON DSGCs (Fig. 8A and B). In the ON DSGCs, GE was largest at the lowest velocity (50 μm s−1) and became attenuated at velocities above 200 μm s−1 (Fig. 8C). GI was constant at low and moderate velocities (50–400 μm s−1) but increased sharply above 400 μm s−1. The cross-over point between GE and GI corresponded well with the velocity at which the spiking responses declined markedly (Fig. 7C) and, therefore, the velocity tuning of the spiking output of the ON DSGCs appears to arise from inverse velocity tuning of the excitatory and inhibitory inputs. By contrast, in the ON–OFF DSGCs, GE and GI were relatively flat throughout the velocity range (Fig. 8B and D), with the excitation exceeding the inhibition at all grating velocities, consistent with the spiking responses (Fig. 7D).
Figure 8. Temporal response properties of synaptic inputs to DSGCs.
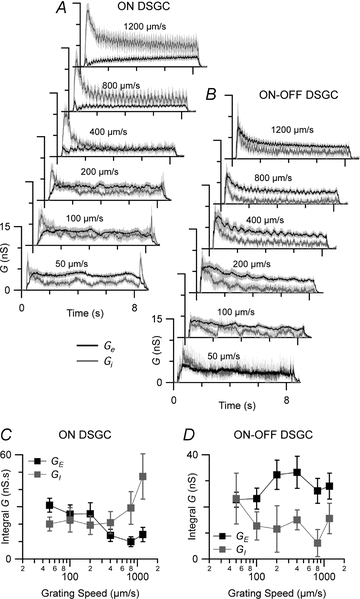
A and B, mean excitatory conductance (Ge, black, ±s.e.m.) and mean inhibitory conductance (Gi, grey, ±s.e.m.) in 7 ON DSGCs (A) and 6 ON–OFF DSGCs (B) in response to gratings moved at different velocities through the receptive field. C and D, integral excitatory conductance (GE, black, ±s.e.m.) and integral inhibitory conductance (GI, grey, ±s.e.m.) for the same data sets as A and B.
Discussion
Synaptic mechanisms of direction selectivity
This study shows that the synaptic mechanisms underlying the generation of DS spike responses are similar in the two types of DSGCs. Null-direction inhibition appears to be the key player, with preferred-direction facilitation playing a smaller role. For the ON DSGCs, the null:preferred ratio of the integral inhibitory conductances (GI) was 3.15 ± 1.65, while the preferred:null ratio of the integral excitatory conductances (GE) was 1.58 ± 0.65. A comparison with similar data for the ON–OFF DSGCs in the rabbit retina reveals marked similarities, with GI,N/GI,P= 3.31 ± 2.15 and GE,P/GE,N= 1.66 ± 0.48 for the ON component of the ON–OFF DSGCs (Taylor & Vaney, 2002). Similar findings were reported for the two types of DSGCs in the mouse retina by (Weng et al. 2005; Sun et al. 2006).
While the presynaptic generation of direction selectively in the excitatory and inhibitory inputs is of primary effect, postsynaptic mechanisms play key secondary roles (Oesch et al. 2005; M. Schachter et al. unpublished observations). In particular, the spatial offset of the excitatory and inhibitory fields means that preferred-direction motion elicits excitation before inhibition for both the ON DSGCs (Fig. 3I) and the ON–OFF DSGCs (Fried et al. 2002; Taylor & Vaney, 2002), whereas for null-direction motion the excitation is coincident with the inhibition.
However, there were pronounced differences in the temporal dynamics of the synaptic inputs to the two types of DSGCs, which accounted for the weak spike responses of ON DSGCs to fast image velocities and high flicker frequencies. The inhibitory inputs to the ON DSGCs were fairly constant from 50 to 400 μm s−1 and then increased sharply from 800 to 1200 μm s−1; conversely, the excitatory inputs to the ON DSGCs were reduced from 400 to 1200 μm s−1. At higher temporal frequencies, weakening excitatory inputs to ON DSGCs combine with strengthening and faster-rising inhibitory inputs to produce lower spike output. By contrast, the synaptic inputs to the ON–OFF DSGCs were not significantly different at the slowest and fastest velocities tested, for both excitation and inhibition.
The temporal properties of the ON DSGCs resemble those described previously for the local edge detector (LED) RGCs, whose spike responses are characterized by a slow onset, sustained firing, and low temporal bandwidth. Spot stimulation of LEDs elicits fast-rising inhibition followed by relatively sustained excitation and the cells are fairly unresponsive to temporal modulation exceeding 1 Hz (van Wyk et al. 2006), comparable to the ON DSGCs. These properties identify both the ON DSGCs and the LEDs as ‘sluggish’ RGCs, which also include the slowly conducting concentric RGCs (Cleland & Levick, 1974; Vaney et al. 1981). However, the inhibitory inputs to LEDs are largely glycinergic whereas the inhibitory inputs to ON DSGCs are largely GABAergic (Ackert et al. 2006; van Wyk et al. 2006).
DS circuitry: amacrine cells
The similarities between the two types of DSGCs suggest that they may receive synaptic inputs from the same complement of bipolar and amacrine cells. The dendrites of the ON starburst cells co-fasciculate with both the ON–OFF DSGCs (Vaney et al. 1989; Vaney & Pow, 2000) and the ON DSGCs (Sun et al. 2006). The starburst cells, which contain both ACh and GABA, appear to be the key players in the generation of direction selectivity in the ON–OFF DSGCs (reviewed by Taylor & Vaney, 2003; Demb, 2007; Zhou & Lee, 2008) but there is no direct evidence that they play the same role for ON DSGCs. The centrifugal separation of input and output synapses within the circularly symmetrical starburst cell appears well suited to providing asymmetric GABAergic inhibition to the four subtypes of ON–OFF DSGCs, and it is simple to propose that the same arrangement applies to the three subtypes of ON DSGCs.
However, the pronounced differences in the temporal dynamics of inhibition in the two types of DSGCs are most parsimoniously explained if the ON DSGCs receive inputs from different amacrine cells than the ON–OFF DSGCs. Moreover, the observation that higher temporal frequencies produce relatively greater inhibition in the ON DSGCs than the ON–OFF DSGCs seems to require differences in the presynaptic release of the transmitter. This does not rule out the hypothesis that starburst cells provide the asymmetric inhibition to both types of DSGCs, but it would require that the synapses to the two types of DSGCs are spatially separated on either different processes or different varicosities of a starburst cell (see below). Interestingly, Famiglietti (1992) reported that there is little co-fasciculation between the two types of DSGCs, although both types co-fasciculate with the starburst cells, and our own unpublished results support this observation. There is no evidence to support the idea that there is a separate population of ON starburst cells serving the ON DSGCs, because the ON and OFF starburst cells are matched fairly evenly in number and size across the rabbit retina (Vaney, 1984).
DS circuitry: bipolar cells
Many of the arguments for and against the hypothesis that the ON DSGCs receive inhibition from the same amacrine cells as the ON–OFF DSGCS can be applied to the question of whether both types of DSGCs receive excitation from the same bipolar cells. It is known that at least two types of ON cone bipolar cells partially co-stratify with the two types of DSGCs in S4 of the IPL (Famiglietti, 1981; Brown & Masland, 1999; Famiglietti, 2002; MacNeil et al. 2004), although the homologies between bipolar cell types identified in different studies are not always clear-cut.
Interpretation of our data is complicated because the DSGCs receive both glutamatergic excitation from bipolar cells and cholinergic excitation from starburst cells, with nicotinic antagonists decreasing the preferred-direction spiking response of both types of DSGCs by 50% (Kittila & Massey, 1997). We have not pharmacologically dissected the excitatory inputs to the two types of DSGCs in this study, so detailed speculation about differences in their bipolar cell circuitry would be premature. We note, however, that when the cholinergic input to ON–OFF DSGCs is blocked, the remaining excitatory input from bipolar cells remains directional (Fried et al. 2005). If each bipolar cell coded a single preferred direction, then four populations of bipolar cells would be required to serve the four subtypes of ON–OFF DSGCs and another three populations would be required to serve the three subtypes of ON DSGCs. Clearly there are not enough cone bipolar cells terminating in S4 of the IPL to provide seven arrays with complete coverage. It is possible that the bipolar cell itself does not display a directional signal but that the transmitter release from individual bipolar cell terminals is directional; thus each bipolar cell could provide output to several DSGCs with different preferred directions (Taylor & Vaney, 2003). It is probable that the starburst cells and the DSGCs receive input from the same bipolar cells (Famiglietti, 2002; Dacheux et al. 2003) raising the prospect that the excitatory inputs to the starburst cells are already direction selective. Clearly, there are many questions about the generation of direction selectivity in the retina that remain to be answered.
Acknowledgments
We thank Nick Nacsa for technical assistance and Refik Kanjhan for helpful input. This research was supported by Australian Research Council Centre of Excellence Grant CE0561903 (to D.I.V.) and National Health & Medical Research Council of Australia grants (to D.I.V.), a National Eye Institute grant EY014888 (to W.R.T.) and a University of Queensland scholarship (to B.S).
Glossary
Abbreviations
- DSGC
direction-selective ganglion cell
- S4
stratum 4 of the inner plexiform layer
- DSI
direction-selectivity index
- Ge
excitatory conductance
- GE
integral of the excitatory conductance
- Gi
inhibitory conductance
- GI
integral of the inhibitory conductance
- GT
integral of the total conductance
Author contributions
B.S., M.vW., D.I.V. and W.R.T. conceived the project and designed experiments; B.S. and M.vW. collected the data, B.S. and W.R.T. analysed the data; and B.S., D.I.V. and W.R.T. wrote the manuscript. All authors approved the final version of the manuscript. The experiments were performed in Portland, Oregon and in Brisbane, Australia.
References
- Ackert JM, Wu SH, Lee JC, Abrams J, Hu EH, Perlman I, Bloomfield SA. Light-induced changes in spike synchronization between coupled ON direction selective ganglion cells in the mammalian retina. J Neurosci. 2006;26:4206–4215. doi: 10.1523/JNEUROSCI.0496-06.2006. [DOI] [PMC free article] [PubMed] [Google Scholar]
- Amthor FR, Takahashi ES, Oyster CW. Morphologies of rabbit retinal ganglion cells with complex receptive fields. J Comp Neurol. 1989;280:97–121. doi: 10.1002/cne.902800108. [DOI] [PubMed] [Google Scholar]
- Amthor FR, Keyser KT, Dmitrieva NA. Effects of the destruction of starburst-cholinergic amacrine cells by the toxin AF64A on rabbit retinal directional selectivity. Vis Neurosci. 2002;19:495–509. doi: 10.1017/s0952523802194119. [DOI] [PubMed] [Google Scholar]
- Barlow HB, Hill RM, Levick WR. Retinal ganglion cells responding selectively to direction and speed of image motion in the rabbit. J Physiol. 1964;173:377–407. doi: 10.1113/jphysiol.1964.sp007463. [DOI] [PMC free article] [PubMed] [Google Scholar]
- Barlow HB, Levick WR. The mechanism of directionally selective units in rabbit's retina. J Physiol. 1965;178:477–504. doi: 10.1113/jphysiol.1965.sp007638. [DOI] [PMC free article] [PubMed] [Google Scholar]
- Borg-Graham LJ. The computation of directional selectivity in the retina occurs presynaptic to the ganglion cell. Nat Neurosci. 2001;4:176–183. doi: 10.1038/84007. [DOI] [PubMed] [Google Scholar]
- Brown SP, Masland RH. Costratification of a population of bipolar cells with the direction-selective circuitry of the rabbit retina. J Comp Neurol. 1999;408:97–106. [PubMed] [Google Scholar]
- Buhl EH, Peichl L. Morphology of rabbit retinal ganglion cells projecting to the medial terminal nucleus of the accessory optic system. J Comp Neurol. 1986;253:163–174. doi: 10.1002/cne.902530204. [DOI] [PubMed] [Google Scholar]
- Caldwell JH, Daw NW. Effects of picrotoxin and strychnine on rabbit retinal ganglion cells: changes in centre surround receptive fields. J Physiol. 1978;276:299–310. doi: 10.1113/jphysiol.1978.sp012234. [DOI] [PMC free article] [PubMed] [Google Scholar]
- Cleland BG, Levick WR. Brisk and sluggish concentrically organized ganglion cells in the cat's retina. J Physiol. 1974;240:421–456. doi: 10.1113/jphysiol.1974.sp010617. [DOI] [PMC free article] [PubMed] [Google Scholar]
- Dacheux RF, Chimento MF, Amthor FR. Synaptic input to the on-off directionally selective ganglion cell in the rabbit retina. J Comp Neurol. 2003;456:267–278. doi: 10.1002/cne.10521. [DOI] [PubMed] [Google Scholar]
- Demb JB. Cellular mechanisms for direction selectivity in the retina. Neuron. 2007;55:179–186. doi: 10.1016/j.neuron.2007.07.001. [DOI] [PubMed] [Google Scholar]
- Dodt H, Eder M, Frick A, Zieglgansberger W. Precisely localized LTD in the neocortex revealed by infrared-guided laser stimulation. Science. 1999;286:110–113. doi: 10.1126/science.286.5437.110. [DOI] [PubMed] [Google Scholar]
- Dong W, Sun W, Zhang Y, Chen X, He S. Dendritic relationship between starburst amacrine cells and direction-selective ganglion cells in the rabbit retina. J Physiol. 2004;556:11–17. doi: 10.1113/jphysiol.2004.060715. [DOI] [PMC free article] [PubMed] [Google Scholar]
- Drummond GB. Reporting ethical matters in The Journal of Physiology: standards and advice. J Physiol. 2009;587:713–719. doi: 10.1113/jphysiol.2008.167387. [DOI] [PMC free article] [PubMed] [Google Scholar]
- Euler T, Detwiler PB, Denk W. Directionally selective calcium signals in dendrites of starburst amacrine cells. Nature. 2002;418:845–852. doi: 10.1038/nature00931. [DOI] [PubMed] [Google Scholar]
- Famiglietti EV. Dendritic co-stratification of ON and ON-OFF directionally selective ganglion cells with starburst amacrine cells in rabbit retina. J Comp Neurol. 1992;324:322–335. doi: 10.1002/cne.903240303. [DOI] [PubMed] [Google Scholar]
- Famiglietti EV. A structural basis for omnidirectional connections between starburst amacrine cells and directionally selective ganglion cells in rabbit retina, with associated bipolar cells. Vis Neurosci. 2002;19:145–162. doi: 10.1017/s0952523802191139. [DOI] [PubMed] [Google Scholar]
- Famiglietti EV. Functional architecture of cone bipolar cells in mammalian retina. Vision Res. 1981;21:1559–1563. doi: 10.1016/0042-6989(81)90032-8. [DOI] [PubMed] [Google Scholar]
- Fried SI, Munch TA, Werblin FS. Directional selectivity is formed at multiple levels by laterally offset inhibition in the rabbit retina. Neuron. 2005;46:117–127. doi: 10.1016/j.neuron.2005.02.007. [DOI] [PubMed] [Google Scholar]
- Fried SI, Münch TA, Werblin FS. Mechanisms and circuitry underlying directional selectivity in the retina. Nature. 2002;420:411–414. doi: 10.1038/nature01179. [DOI] [PubMed] [Google Scholar]
- He S, Masland RH. ON direction-selective ganglion cells in the rabbit retina: dendritic morphology and pattern of fasciculation. Vis Neurosci. 1998;15:369–375. doi: 10.1017/s095252389815215x. [DOI] [PubMed] [Google Scholar]
- Hughes A, Vaney DI. Contact lenses change the projection of visual field onto rabbit peripheral retina. Vision Res. 1981;21:955–956. doi: 10.1016/0042-6989(81)90199-1. [DOI] [PubMed] [Google Scholar]
- Kanjhan R, Vaney DI. Semi-loose seal Neurobiotin electroporation for combined structural and functional analysis of neurons. Pflügers Arch. 2008;457:561–568. doi: 10.1007/s00424-008-0539-9. [DOI] [PubMed] [Google Scholar]
- Kittila CA, Massey SC. Pharmacology of directionally selective ganglion cells in the rabbit retina. J Neurophysiol. 1997;77:675–689. doi: 10.1152/jn.1997.77.2.675. [DOI] [PubMed] [Google Scholar]
- Lee S, Zhou ZJ. The synaptic mechanism of direction selectivity in distal processes of starburst amacrine cells. Neuron. 2006;51:787–799. doi: 10.1016/j.neuron.2006.08.007. [DOI] [PMC free article] [PubMed] [Google Scholar]
- MacNeil MA, Heussy JK, Dacheux RF, Raviola E, Masland RH. The population of bipolar cells in the rabbit retina. J Comp Neurol. 2004;472:73–86. doi: 10.1002/cne.20063. [DOI] [PubMed] [Google Scholar]
- Oesch N, Euler T, Taylor WR. Direction-selective dendritic action potentials in rabbit retina. Neuron. 2005;47:739–750. doi: 10.1016/j.neuron.2005.06.036. [DOI] [PubMed] [Google Scholar]
- Oyster CW. The analysis of image motion by the rabbit retina. J Physiol. 1968;199:613–635. doi: 10.1113/jphysiol.1968.sp008671. [DOI] [PMC free article] [PubMed] [Google Scholar]
- Oyster CW, Barlow HB. Direction-selective units in rabbit retina: distribution of preferred directions. Science. 1967;155:841–842. doi: 10.1126/science.155.3764.841. [DOI] [PubMed] [Google Scholar]
- Oyster CW, Simpson JI, Takahashi ES, Soodak RE. Retinal ganglion cells projecting to the rabbit accessory optic system. J Comp Neurol. 1980;190:49–61. doi: 10.1002/cne.901900105. [DOI] [PubMed] [Google Scholar]
- Oyster CW, Takahashi E, Levick WR. Information processing in the rabbit visual system. Doc Ophthalmol. 1971;30:161–204. doi: 10.1007/BF00142519. [DOI] [PubMed] [Google Scholar]
- Pu ML, Amthor FR. Dendritic morphologies of retinal ganglion cells projecting to the nucleus of the optic tract in the rabbit. J Comp Neurol. 1990;302:657–674. doi: 10.1002/cne.903020319. [DOI] [PubMed] [Google Scholar]
- Roska B, Molnar A, Werblin FS. Parallel processing in retinal ganglion cells: how integration of space-time patterns of excitation and inhibition form the spiking output. J Neurophysiol. 2006;95:3810–3822. doi: 10.1152/jn.00113.2006. [DOI] [PubMed] [Google Scholar]
- Simpson JI. The accessory optic system. Annu Rev Neurosci. 1984;7:13–41. doi: 10.1146/annurev.ne.07.030184.000305. [DOI] [PubMed] [Google Scholar]
- Simpson JI, Leonard CS, Soodak RE. The accessory optic system of rabbit. II. Spatial organization of direction selectivity. J Neurophysiol. 1988;60:2055–2072. doi: 10.1152/jn.1988.60.6.2055. [DOI] [PubMed] [Google Scholar]
- Sivyer B, Taylor WR, Vaney DI. Uniformity detector retinal ganglion cells fire complex spikes and receive only light-evoked inhibition. Proc Natl Acad Sci U S A. 2010;107:5628–5633. doi: 10.1073/pnas.0909621107. [DOI] [PMC free article] [PubMed] [Google Scholar]
- Sun W, Deng Q, Levick WR, He S. ON direction-selective ganglion cells in the mouse retina. J Physiol. 2006;576:197–202. doi: 10.1113/jphysiol.2006.115857. [DOI] [PMC free article] [PubMed] [Google Scholar]
- Taylor WR, Vaney DI. Diverse synaptic mechanisms generate direction selectivity in the rabbit retina. J Neurosci. 2002;22:7712–7720. doi: 10.1523/JNEUROSCI.22-17-07712.2002. [DOI] [PMC free article] [PubMed] [Google Scholar]
- Taylor WR, Vaney DI. New directions in retinal research. Trends Neurosci. 2003;26:379–385. doi: 10.1016/S0166-2236(03)00167-X. [DOI] [PubMed] [Google Scholar]
- van Wyk M, Taylor WR, Vaney DI. Local edge detectors: a substrate for fine spatial vision at low temporal frequencies in rabbit retina. J Neurosci. 2006;26:13250–13263. doi: 10.1523/JNEUROSCI.1991-06.2006. [DOI] [PMC free article] [PubMed] [Google Scholar]
- Vaney DI. ‘Coronate’ amacrine cells in the rabbit retina have the ‘starburst’ dendritic morphology. Proc R Soc Lond B Biol Sci. 1984;220:501–508. doi: 10.1098/rspb.1984.0016. [DOI] [PubMed] [Google Scholar]
- Vaney DI. Territorial organization of direction-selective ganglion cells in rabbit retina. J Neurosci. 1994;14:6301–6316. doi: 10.1523/JNEUROSCI.14-11-06301.1994. [DOI] [PMC free article] [PubMed] [Google Scholar]
- Vaney DI, Collin SP, Young HM. Dendritic relationships between cholinergic amacrine cells and direction-selective retinal ganglion cells. In: Weiler R, Osborne NN, editors. Neurobiology of the Inner Retina. Berlin: Springer; 1989. pp. 157–168. [Google Scholar]
- Vaney DI, He S, Taylor WR, Levick WR. Direction-selective ganglion cells in the retina. In: Zanker JM, Zeil J, editors. Motion Vision: Computational, Neural, and Ecological Constraints. Berlin: Springer; 2001. pp. 13–56. [Google Scholar]
- Vaney DI, Levick WR, Thibos LN. Rabbit retinal ganglion cells. Receptive field classification and axonal conduction properties. Exp Brain Res. 1981;44:27–33. doi: 10.1007/BF00238746. [DOI] [PubMed] [Google Scholar]
- Vaney DI, Pow DV. The dendritic architecture of the cholinergic plexus in the rabbit retina: selective labeling by glycine accumulation in the presence of sarcosine. J Comp Neurol. 2000;421:1–13. [PubMed] [Google Scholar]
- Weng S, Sun W, He S. Identification of ON-OFF direction-selective ganglion cells in the mouse retina. J Physiol. 2005;562:915–923. doi: 10.1113/jphysiol.2004.076695. [DOI] [PMC free article] [PubMed] [Google Scholar]
- Wyatt HJ, Daw NW. Directionally sensitive ganglion cells in the rabbit retina: specificity for stimulus direction, size, and speed. J Neurophysiol. 1975;38:613–626. doi: 10.1152/jn.1975.38.3.613. [DOI] [PubMed] [Google Scholar]
- Yoshida K, Watanabe D, Ishikane H, Tachibana M, Pastan I, Nakanishi S. A key role of starburst amacrine cells in originating retinal directional selectivity and optokinetic eye movement. Neuron. 2001;30:771–780. doi: 10.1016/s0896-6273(01)00316-6. [DOI] [PubMed] [Google Scholar]
- Zhou ZJ, Lee S. Synaptic physiology of direction selectivity in the retina. J Physiol. 2008;586:4371–4376. doi: 10.1113/jphysiol.2008.159020. [DOI] [PMC free article] [PubMed] [Google Scholar]


