

Abstract
In humans, muscle satellite cell (SC) enumeration is an important measurement used to determine the myogenic response to various stimuli. To date, the standard practice for enumeration is immunohistochemistry (IHC) using antibodies against common SC markers (Pax7, NCAM). Flow cytometry (FC) analysis may provide a more rapid and quantitative determination of changes in the SC pool with potential for additional analysis not easily achievable with standard IHC. In this study, FC analysis revealed that the number of Pax7+ cells per milligram isolated from ∼50 mg of fresh tissue increased 36% 24 h after exercise-induced muscle injury (300 unilateral maximal eccentric contractions). IHC analysis of Pax7 and neural cell adhesion molecule (NCAM) appeared to sufficiently and similarly represent the expansion of SCs after injury (28–36% increase). IHC and FC data illustrated that Pax7 was the most widely expressed SC marker in muscle cross-sections and represented the majority of positive cells, while NCAM was expressed to a lesser degree. Moreover, FC and IHC demonstrated a similar percentage change 24 h after injury (36% increase, Pax7; 28% increase, NCAM). FC analysis of isolated SCs revealed that the number of Pax7+ cells per milligram in G2/M phase of the cell cycle increased 202% 24 h after injury. Number of cells per milligram in G0/G1 and cells in S-phase increased 32% and 59% respectively. Here we illustrate the use of FC as a method for enumerating SC number on a per milligram tissue basis, providing a more easily understandable relation to muscle mass (vs. percentage of myonuclei or per myofibre). Although IHC is a powerful tool for SC analysis, FC is a fast, reliable and effective method for SC quantification as well as a more informative method for cell cycle kinetics of the SC population in humans.
Introduction
Post-natal skeletal muscle is a terminally differentiated tissue, yet it retains a remarkable regenerative capacity. Although skeletal muscle fibres are post-mitotic and unable to divide, a class of stem cells residing on the periphery of the fibre maintains the capacity for tissue remodelling and muscle regeneration. These stem cells, referred to as satellite cells (SCs) based on their anatomical location between the basal lamina and sarcolemma, are directly responsible for post-natal muscle development, homeostasis and regeneration (Maura, 1961; Seale & Rudnicki, 2000; Charge & Rudnicki, 2004; Zammit et al. 2006). Following muscle damage (or a hypertrophic stimulus), SCs activate and undergo rounds of proliferation before differentiating and fusing with existing myofibres (Holterman & Rudnicki, 2005; Le Grand & Rudnicki, 2007). Progression of SCs through the myogenic program is controlled by the coordinated up- and down-regulation of the myogenic regulatory factors (MRFs). The upregulation of Myf5 marks the earliest phase of myogenic commitment followed by the concomitant expression of MyoD, which together mark the majority of newly activated SCs (myoblasts) (Charge & Rudnicki, 2004; Dhawan & Rando, 2005). Following proliferation, these cells express markers of myoblast differentiation (MRF4 and myogenin) and ultimately fuse, contributing their nuclei to existing myofibres or giving rise to nascent myotubes, aiding in the repair process (Charge & Rudnicki, 2004; Dhawan & Rando, 2005).
Studies examining human muscle SC generally utilize immunohistochemistry (IHC) of muscle cross-sections to enumerate the SC response to a given stimuli such as acute myotrauma or resistance exercise training (Crameri et al. 2004; Kadi et al. 2004; Dreyer et al. 2006; O’Reilly et al. 2008; McKay et al. 2009). Although SC enumeration is an important measure, it provides limited data with regards to the regulatory events associated with SC function. In the majority of studies investigating human muscle SCs, neural cell adhesion molecule (NCAM; CD56) was used to mark SCs for enumeration (Kadi et al. 1999, 2004; Kadi & Thornell, 2000; Crameri et al. 2004; Eriksson et al. 2005; Dreyer et al. 2006; Mackey et al. 2007a,b,c, 2009; O’Reilly et al. 2008). More recently, the paired box transcription factor Pax7, which can activate transcription and control the expression of the MRF in quiescent and activated SCs (Zammit, 2008), has been used to identify SCs in human muscle cross-sections (McKay et al. 2009; Mikkelsen et al. 2009). Typical human SC analysis is more often than not limited to a satellite cell marker (NCAM or Pax7) co-stained with Ki67 or proliferating cell nuclear antigen (PCNA), which provides important, yet limited cell cycle information (Mackey et al. 2009; McKay et al. 2009). Understanding the kinetics of SCs entering and progressing through the cell cycle during the response to damage is imperative to understanding deficiencies in muscle repair and growth in conditions such as ageing or cachexia.
Flow cytometry is routinely used to analyse cells based on multiple-antigen labelling in vitro and used extensively in stem cell research to purify obscure cell populations from a larger cellular milieu. We propose FC analysis on human tissue as an alternate means to objectively enumerate SC number on a per milligram of tissue basis, while allowing for the determination of SC cell cycle kinetics (in vivo) with resolution virtually unobtainable by IHC techniques alone. Furthermore, we aim to validate the use of Pax7 as an accurate marker for human SC analysis through direct comparison with NCAM using both FC and IHC methods.
Methods
Subjects
Twelve healthy males (age 21 ± 2 years, height 185 ± 5 cm, weight 82 ± 11 kg) were recruited from the McMaster University community. Subjects underwent a routine screening, completed a health questionnaire, and were not involved in a lower-body resistance exercise training programme for at least six months prior to participating in the study. Subjects were told to refrain from exercising throughout the time course of the study. All subjects were informed of the procedures and potential risks associated with the study and gave their written informed consent to participate. This study was approved by the Hamilton Health Sciences Research Ethics Board and conforms to the Declaration of Helsinki concerning the use of human subjects as research participants.
Muscle damage protocol
To induce muscle damage we employed a protocol involving maximal isokinetic unilateral muscle-lengthening contractions of the quadriceps femoris performed on a Biodex dynamometer (Biodex-System 3, Biodex Medical Systems, Inc., Shirley, NY, USA) at 3.14 rad s−1 as previously described (McKay et al. 2009). Briefly, for each subject, the dominant leg was selected to complete the protocol. Subjects were required to perform 30 sets of 10 maximal muscle lengthening contractions with 1 min of rest between sets for a total of 300 lengthening contractions.
It has been well documented that this protocol induces some level of skeletal muscle damage with some cellular disruption evidenced by z-band streaming, discontinuous desmin staining, an increase in plasma creatine kinase, an infiltration of leukocytes, macrophage and neutrophils, and a significant myogenic regulatory factor (MRF) and muscle satellite cell response (Beaton et al. 2002b; O’Reilly et al. 2008; Mahoney et al. 2008; McKay et al. 2008, 2009; Lauritzen et al. 2009; Paulsen et al. 2010). Although overt damage is sometimes observed from this type of exercise, it may not induce a significant level of necrosis as evidenced by a lack of regenerating fibres expressing embryonic myosin heavy chain (indicative of a newly formed or regenerated fibre) 8 days following 200 maximal eccentric contractions of the quadriceps (Mikkelsen et al. 2009). Furthermore, it was shown that electrical stimulation of human quadriceps can induce far more necrosis and thus represents a model of tissue degeneration/regeneration compared to normal physiological damage observed with eccentrically biased exercise (Crameri et al. 2007).
Muscle biopsies
Two percutaneous needle biopsies were obtained from the mid-portion of the vastus lateralis under local anaesthetic (1% lidocaine) using manual suction (Bergstrom, 1975; Hennessey et al. 1997; Bourgeois & Tarnopolsky, 2004). One muscle biopsy was obtained from the non-working leg prior to the intervention. Baseline measures were generated from the pre-intervention biopsy (PRE). The other biopsy was obtained from the working leg 24 h post-intervention. Approximately 25 mg of each biopsy sample was mounted in optimum cutting temperature (OCT) compound and frozen in isopentane cooled in liquid nitrogen. Approximately 50 mg (50.8 ± 3.4 mg) of fresh muscle tissue was placed in ice-cold Ham's (F-10) culture medium (Gibco/Invitrogen, Carlsbad, CA, USA) supplemented with 20% fetal bovine serum (FBS) (Gibco/Invitrogen) and 1% penicillin–streptomycin (Gibco/Invitrogen) for immediate flow cytometry preparation.
Fluorescence activated cell sorting and flow cytometry
Determination of myogenic satellite cell number and cell cycle kinetics using Pax7 and propidium iodide (PI)
PRE and 24 h muscle biopsy tissue was prepared for fluorescence activated cell sorting (FACS) analysis using standard methods and criteria (Megeney et al. 1996; Parise et al. 2008; Alexander et al. 2009; Conboy et al. 2010). Briefly, after weighing, muscle samples were mulched using sterile surgical scissors in 3.5 cm tissue culture plates in a sterile tissue culture hood. After tissue was adequately mulched, 1 ml of a collagenase–dispase solution (10 mg ml−1 collagenase B, Roche Diagnostics, Mannheim, Germany; 2.4 U ml−1 dispase, Gibco/Invitrogen; with 5 μl ml−1 of 0.5 m CaCl2) was added to the plate and placed in a tissue culture incubator for 10 min (5% CO2, 37°C). Another 0.5 ml of collagenase–dispase was added to the plate and the mixture was manually triturated through a 5 ml and 1 ml plastic serological pipette to further disrupt the tissue. The mixture was then incubated for 5–10 min. Following the incubation, 5 ml of ice-cold Ham's (F-10 with 20% FBS and 1% penicillin–streptomycin) culture medium was added and the mixture was triturated several times and filtered through a 50 μm mesh filter (BD Biosciences, Mississauga, ON, Canada) into a 50 ml conical bottom tube. The mixture was then centrifuged at 800 g for 5 min to obtain a pellet containing mononuclear cells. The pellet was resuspended in 1 ml of 1× phosphate-buffered saline (PBS; 10 mm, pH 7.4) and a 10 μl sample was taken for analysis of total mononuclear cell concentration using a haemocytometer (Hausser Scientific, Horsham, PA, USA). The cell suspension was added drop-wise to ice-cold 70% ethanol under gentle agitation for fixation. Total time of tissue removal from the subject to fixation was no longer than 1 h, as great care was taken to reach fixation as quickly as possible to maintain the in vivo cell cycle characteristics. After fixation, cells were pelleted and re-suspended in a blocking solution (2% BSA, 5% FBS, 0.2% Triton X-100, 0.1% sodium azide) and incubated on ice for 10 min. Cells were then pelleted and resuspended in 500 μl of anti-human Pax7 primary antibody (cell supernatant from hybridoma cells obtained from Developmental Studies Hybridoma Bank (DSHB), University of Iowa, Iowa, IA, USA; 50 ± 2 μg ml−1 mAb). After incubation on ice for 45 min, cells were pelleted and washed before being re-suspended in 2 ml of the appropriate secondary antibody (Alexafluor 488, Invitrogen, 1:500 for 45 min). After incubation in the secondary antibody cells were then pelleted and washed several times before being re-suspended in 300 μl of a propidium iodide (PI) solution (0.1 mg ml−1 PI (Calbiochem/EMD Chemicals, Gibbstown, NJ, USA), 0.2 mg ml−1 RNase A (Roche Diagnostics) and 0.1% Triton X-100 (Sigma-Aldrich, Canada) in 1× PBS). Flow cytometry was conducted using a Beckman-Coulter Epics XL flow cytometer (Beckman-Coulter Inc., Brea, CA, USA). Optical alignment and fluidics of the cytometer were verified daily using Flow-Check fluorospheres (Beckman-Coulter) and optimum instrument settings were verified daily using a Flow-Set kit (Beckman-Coulter) by a trained technician. Gating strategies were optimized through multiple experiments which included various unstained, secondary only, and PI only samples (for an example see supplemental Fig. S2). Furthermore, gates were set to include only cells with DNA (PI positive), thus gating out cellular debris commonly observed in isolating cells from solid tissues. The population of interest encompassed cells with a wide spread of side-scatter (SS) and forward scatter (FS), which we expected based on the fact that quiescent SCs have a very low cytoplasmic and organelle volume, while activated and cycling SCs have varying degrees of organelle and cytoplasmic volume (Charge & Rudnicki, 2004). Furthermore, cells beginning to differentiate upregulate different cellular machinery, altering SS and FS compared to quiescent SCs making discrete SS and FS gating (as with done with blood cells) more difficult. Repeated running of controls periodically throughout the study helped ensure the consistency of our gating strategies. Specific fluorochrome details are as follows: PI excitation = 520 nm, emission = 610 nm; Pax7 (Alexa 488) excitation = 494 nm, emission = 519 nm; NCAM (PE-Cy5.5) excitation = 488 nm, emission = 690 nm.
Determination of Pax7 and NCAM cell number
For co-staining with Pax7 and NCAM, tissue from a group of four subjects (22.5 ± 1.0 years) was isolated as stated above. Preparation was the same as above except during the primary antibody incubation, cells were incubated with a cocktail of Pax7 (cell supernatant from hybridoma cells obtained from DSHB; ∼50 μg ml−1 mAb) and neural cell adhesion molecule (NCAM, CD56, 35-0569 eBioscicence CD56-PE Cy5.5 conjugated mouse anti-human mAb, titrated to 2 μg/1 million cells). Appropriate positive, single stained and unstained control samples were re-run to establish the correct gates for N-CAM and Pax7.
FACS of Pax7 positive cells
For sorting Pax7+ cells, tissue from four subjects (22.5 ± 1.0 years) was isolated as above; however cells were not resuspended in PI, but rather in 1× PBS and sorted on Pax7 only. Cells were sorted onto silane (aminoalkysilane) coated slides (Sigma-Aldrich) and into 1.5 ml culture tubes and cytospun (StatSpin Cytofuge 2, IRIS International, Chatsworth, CA, USA) onto silane-coated slides for immunocytochemistry of desmin content (see below). Sorting was conducted using a Beckman-Coulter Epics Altra Cell Sorter. Gating strategies, optimization and controls were conducted as above.
Verification of myogenic lineage using desmin
Mononuclear cells isolated from muscle biopsies and FACS-sorted Pax7+ cells were then stained with an antibody against desmin, a muscle specific marker (Bar et al. 2004). Briefly, slides were washed with 1× PBS prior to incubation in the primary antibody. Slides were incubated in the primary antibody (anti-human desmin mAb, 1:500, Abcam, Cambridge, MA, USA) overnight at 4°C. Following three 5 min washes, slides were incubated in the appropriate secondary antibody (Alexafluor 594, 1:500, Molecular Probes/Invitrogen) for 2 h. Mononuclear cells were then cytostained with Pax7 as described below. Slides were then washed with PBS and DAPI (Sigma-Aldrich) for nuclear staining. Staining was verified using the appropriate positive and negative controls to ensure specificity of staining. Stained slides were viewed with the Nikon Eclipse 90i Microscope (Nikon Instruments, Inc., Melville, NY, USA) and images were captured and analysed using NIS Elements 3.0 software (Nikon Instruments). The mononuclear cell preparation served as an additional confirmation that the sorted Pax7 cells were, indeed, of the myogenic lineage.
Muscle tissue titration experiments
To determine the optimal amount of tissue needed to accurately reproduce Pax7+ cell number and Pax7+ cells per mg tissue, we conducted a series of separate titration experiments using the above methods. Briefly, we divided muscle biopsies obtained PRE and 24 h after damage from a separate subject group (n= 5) into five different tissue weight classes (approximately 15, 25, 50, 75 and 100 mg). Each sample was compared to the other weights for reproducibility of the number of cells per mg tissue value at each time point. The PRE samples were compared against tissue obtained 24 h after injury to determine the reproducibility of the expansion of the number of Pax7+ cells per mg tissue for each subject. We determined that 40–50 mg of fresh tissue was sufficient for satellite cell analysis using FACS since there was little variance observed in Pax7+ cell per mg with tissue weights ranging between 40 and 110 mg.
Immunofluorescence
Muscle cross-sections of 7 μm were stained with antibodies against Pax7 (neat; cell supernatant from cells obtained from the DSHB, USA); neural cell adhesion molecule (NCAM/CD56/Leu-19) (1:100, 559043, BD, Canada); C-Met (2 μg ml−1; 71-8000 Rabbit anti-C-Met, Zymed Laboratories/Invitrogen); and Laminin (1:1000, L8271, Sigma-Aldrich). Secondary antibodies used were: Pax7 (AlexaFluor 488 or AlexaFluor 594, 1:500, Molecular Probes/Invitrogen or when using two mouse primary antibodies an immunoglobulin biotinylated secondary antibody, 1:200, Dako Canada, Inc., Mississauga, ON, Canada; followed by a streptavidin-FITC fluorochrome, 1:100, Biosource/Invitrogen); NCAM (CD56) (AlexaFluor 488 or AlexaFluor 594, 1:500, Molecular Probes/Invitrogen); C-Met (Texas Red, 1:500, Molecular Probes/Invitrogen) and Laminin (AlexaFluor 488, 1:500, Molecular Probes/Invitrogen). Histochemical methods were adapted from previously published methods from our lab (O’Reilly et al. 2008; McKay et al. 2008, 2009). Briefly, for co-immunofluorescence staining (Pax7 and NCAM, Pax7 and Laminin, Pax7 and C-Met, NCAM and Laminin, or C-Met and Laminin), sections were fixed with 4% paraformaldehyde (PFA, Sigma-Aldrich) for 10 min followed by several washes in PBS. Sections were then covered for 60 min in a blocking solution containing 2% BSA, 5% FBS, 0.2% Triton X-100, 0.1% sodium azide. Following blocking, sections were incubated in the primary antibody at 4°C overnight. After several washes, sections were then incubated in the appropriate secondary antibodies. Sections were then re-fixed in 4% PFA to prevent migration of the secondary antibodies and re-blocked in 10% GS in 0.01% Triton X-100 (Sigma-Aldrich). The sections were then incubated in the second primary antibody, followed by incubation in the appropriate secondary antibody. Sections were then washed with PBS and 4′,6-diamidino-2-phenylindole (DAPI, 1:20000; Sigma-Aldrich) for nuclear staining. Staining was verified using the appropriate positive and negative controls to ensure specificity of staining. Stained slides were viewed with the Nikon Eclipse 90i Microscope (Nikon Instruments, Inc.) and images were captured and analysed using the Nikon NIS Elements 3.0 software (Nikon Instruments, Inc.).
Blood measures
A resting blood sample was obtained from the antecubital vein immediately prior to the intervention and at 24 h post-intervention. Approximately 20 ml of blood was collected and separated into one serum and one plasma vacutainer tube (BD, Canada) at each time point. Samples were separated into 50 μl aliquots and stored at −80°C for analysis at a later date. Serum samples were thawed on ice and analysed for creatine kinase (CK) protein concentration using a commercially available kit according to the manufactures’ instructions (Pointe Scientific Inc., Canton, MI, USA).
Statistical analysis
Statistical analysis was performed using SigmaStat 3.1.0 analysis software (Systat Software Inc., San Jose, CA, USA). Serum creatine kinase concentrations, immunohistochemistry and flow cytometry were analysed using a one-way repeated-measures analysis of variance (ANOVA). Statistical significance was accepted at P < 0.05. Significant interactions and main effects were analysed using the Tukey's HSD post hoc test. Data are presented as means ±s.d.
Results
Tissue titration and myogenic lineage determination
To ensure specificity of the antibody labelling, we preformed a series of confirmatory experiments. Pax7+ cells were sorted and subsequently cytostained with the muscle-specific intermediate filament protein desmin. Of the 1615 Pax7+ cells sorted, 100% of the Pax7+ cells were positive for desmin (cells that were Pax7− were negative for desmin). Supplemental Fig. S1a shows the localization of desmin (red) to the cytoplasm of Pax7+ sorted cells. The results of the FACS analysis were further confirmed using whole mononuclear preps isolated from muscle biopsies and cytostained for both desmin and one of Pax7 or NCAM. One hundred per cent of the cells which stained positive for Pax7 or NCAM were also positive for desmin, confirming that Pax7 (and NCAM) were specific for mononuclear cells restricted to the myogenic lineage (Fig. S1b and c). Furthermore, of the mononuclear cells, Pax7 negative cells did not show any desmin staining (Fig. S1d). Following confirmation of the specificity of the antibody, we conducted a series of titration experiments to determine the optimal amount of tissue needed to accurately reproduce the SC enumeration. The number of Pax7+ cells per mg muscle tissue was consistent from approximately 110 mg down to 50 mg with no significant loss in the reproducibility of cell number per mg of tissue. At tissue weights below 40–50 mg there was an abrupt loss in cell number in both resting and 24 h post-damage samples (Fig. S1e). Thus it was determined that a minimum of ∼50 mg of muscle was needed for reproducibility and an average of 50.8 ± 11.7 mg was used in the present study.
Enumeration of Pax7 positive cells using flow cytometry following myotrauma
The number of Pax7+ cells per mg of fresh muscle tissue was analysed before (PRE) and 24 h after a bout of damaging muscle contractions via flow cytometry. The extent of muscle damage was assessed using a creatine kinase (CK) assay. Muscle CK in the blood increased 212% 24 h after damaging exercise (167.1 ± 112.2 IU l−1 PRE to 522.3 ± 252.2 IU l−1 at 24 h). The number of total mononuclear cells tended to increase 24 h post-damage (Fig. 1A: 27 155.7 ± 8221.1 cells mg−1 PRE to 34,824.2 ± 11,495.1 cells mg−1 at 24 h; P= 0.08). The number of Pax7+ cells mg−1 increased 36% 24 h post-damage (Fig. 1B: 17,407.0 ± 5953.1 Pax7+ cells mg−1 PRE to 23,664.6 ± 8547.2 Pax7+ cells mg−1 at 24 h, P= 0.04), with a visible shift in the mean fluorescence of the FITC+ (Pax7+) cell population (Fig. 1C). Furthermore, there was a detectable change in both the forward scatter (FS) and side scatter (SS) of the FITC+ cell population, which indicates an increase in the size (FS) and granularity (SS or complexity, i.e. increased organelle volume; Fig. 1D), which would be expected as the SCs exit quiescence and enter the cell cycle.
Figure 1. Satellite cell enumeration via flow cytometry before (PRE) and 24 h after muscle damage.
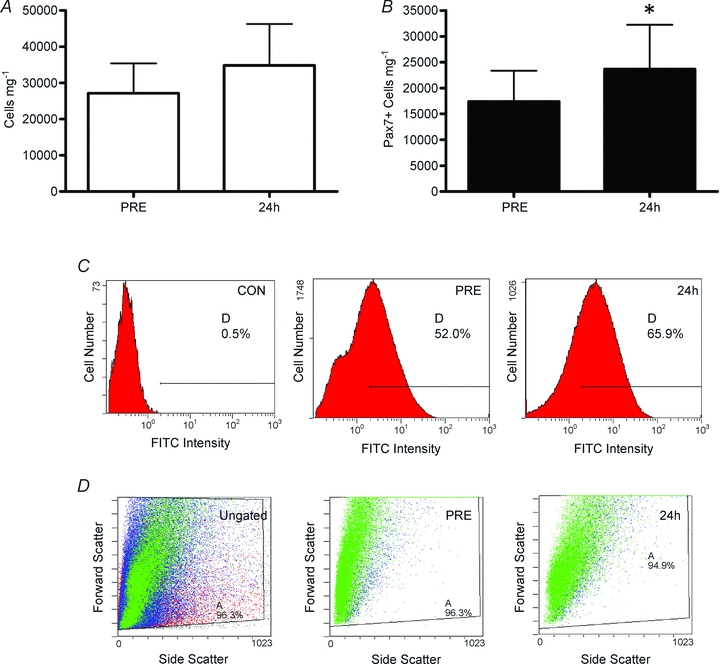
A, total mononuclear cells isolated from whole muscle biopsies. B, total Pax7+ cells mg−1 isolated from whole muscle biopsies. Pax7+ cells mg−1 increased 36% (P= 0.04; mean ±s.d., n= 12). C, representative flow cytometry histograms of total FITC (Pax7) fluorescence versus cell number of a secondary only control (CON), a pre-exercise (PRE) and 24 h post-exercise (24 h) cell sample. D, representative flow cytometry histograms of forward scatter (FS, y-axis) vs. side scatter (SS, x-axis) of an ungated sample and Pax7+ cells (gated on Pax7 and propidium iodide PRE and 24 h).
Cell cycle analysis of isolated Pax7 positive cells following myotrauma
In the resting condition (PRE) cell cycle analysis using propidium iodide (PI) staining of individual cells isolated from fresh tissue revealed that the majority of Pax7+ cells were in the G0/G1 phase of the cell cycle (84.6 ± 4.4% G0/G1) with very few cells actively dividing (i.e. in G2/M; 2.6 ± 1.7%; Fig. 2A). There was a significant increase in Pax7+ cells entering the cell cycle at 24 h, evidenced by an increase in the proportion of cells in S-phase and G2/M-phase of the PI DNA histogram (Fig. 3B). The PI data translated into a 32% increase in Pax7+ cells mg−1 in G0/G1, 59% increase in Pax7+ cells mg−1 in S-phase and 202% increase in Pax7+ cells mg−1 in G2/M 24 h after myotrauma (P < 0.001 for each phase; Fig. 2C–F).
Figure 2. Cell cycle analysis via flow cytometry.
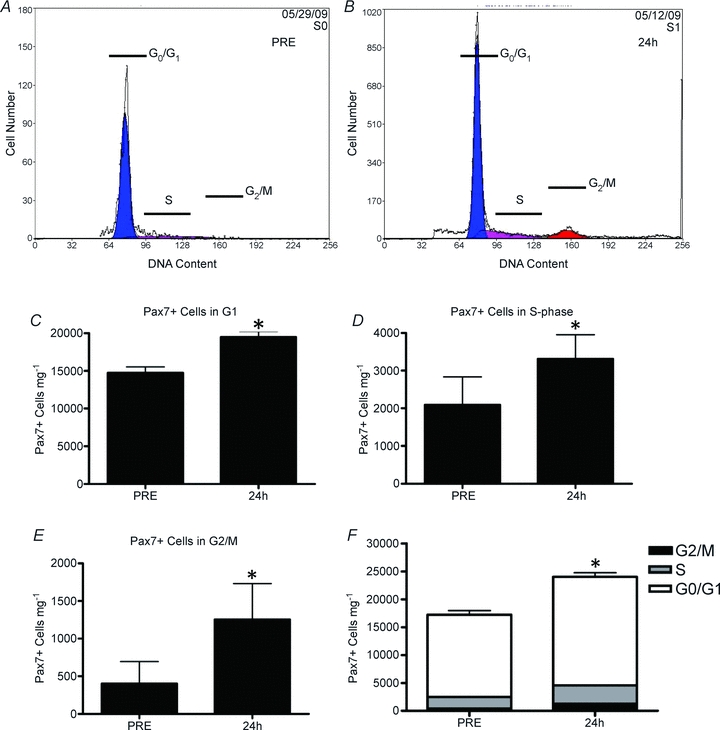
A and B, representative DNA histograms of SC (Pax7+ cells) isolated from muscle biopsies before (A, PRE) and 24 h after (B, 24 h) muscle damage. Cells in Go/G1 of the cell cycle are depicted in blue, cells with increasing DNA content (S-phase) are depicted in purple and cells with 2 compliments of DNA (cells in G2/M) are depicted in red. C, total number of Pax7+ cells mg−1 which are in Go/G1 of the cell cycle before (PRE) and 24 h after muscle damage. D, total number of Pax7+ cells mg−1 in S-phase of the cell cycle before (PRE) and 24 h after muscle damage (24 h). E, total number of Pax7+ cells mg−1 in G2/M of the cell cycle before (PRE) and 24 h after muscle damage (24 h). F, total number of Pax7+ cells mg−1 in each phase of the cell cycle as a proportion of the total number of SCs before (PRE) and 24 h after muscle damage. *Significant difference from PRE (P < 0.05). All data are means ±s.d., n= 12.
Figure 3. Immunohistochemical analysis of the satellite cell response to muscle damage before (PRE) and 24 h after muscle damage.
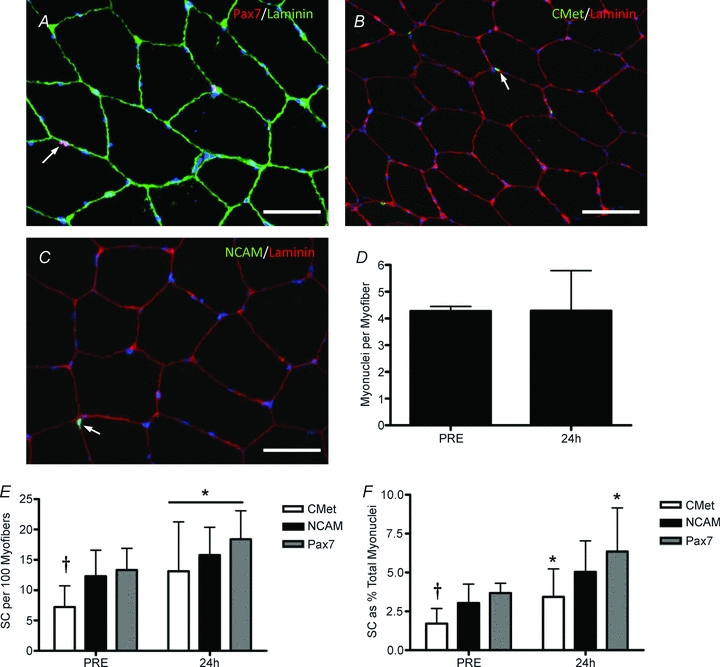
A, representative image of Pax7/laminin co-immunofluorescent stain. Arrow denotes a Pax7+ nucleus (red) beneath the basal lamina (green). Scale bar = 50 μm. B, representative image of a C-Met/laminin co-immunofluorescent stain. Arrow denotes a C-Met+ nucleus (green) beneath the basal lamina (red). Scale bar = 50 μm. C, representative image of NCAM/laminin co-immunofluorescent stain. Arrow denotes a NCAM+ cell (red) beneath the basal lamina (green). Scale bar = 50 μm. D, total number of myonuclei per muscle. E, SC number (per 100 myofibres) by SC marker. *Main effect of time (P < 0.05). F, SC number (as a percentage of total myonuclei) by SC marker. *Significant effect of time between Pax7 and C-met(P < 0.05). †Significant difference between Pax7 and C-met positive cells at PRE (P < 0.05). All data are means ±s.d., n= 12.
Immunohistochemical analysis of Pax7, NCAM and C-Met following myotrauma
To validate the expansion of the SC pool quantified using flow cytometry, we utilized common immunohistochemical analysis of several known SC markers. Muscle cross-sections were stained with Pax7, NCAM, or C-Met alone (with laminin to determine proper anatomical location of the SCs) and sections were also co-stained with Pax7 and NCAM or Pax7 and C-Met to determine the co-expression of these markers on SCs (Fig. 3A–C). There was no change in the average number of myonuclei per myofibre following contraction-induced myotrauma (Fig. 3D). Each marker (Pax7, NCAM, C-Met) illustrated a significant increase in the number of positive cells per 100 myofibres (MFs) (Fig. 3E). However, there were significantly fewer C-Met positive SCs in the PRE condition compared to either Pax7 or NCAM (Fig. 3E and F). Furthermore, the number of SCs increased when expressed either as SCs per 100 MFs (Fig. 3E) or as a percentage of total myonuclei (MN; Fig. 3F) regardless of marker used except for the increase in NCAM+ SCs as a percentage of MN, which did not reach statistical significance (P= 0.06, Fig. 3B). In agreement with Lindstrom & Thornell (2009), expressing SCs per MF (or per 100 MFs) appears to be a more relevant expression of SC number, which is more relatable to the FACS data, which is expressed per mg of tissue. However, to allow for comparisons with other studies we have provided SC enumeration as both % MN and per 100 MFs.
The co-expression of Pax7 and NCAM or Pax7 and C-Met are depicted in Fig. 4A and B, respectively. The number of Pax7+/NCAM+ cells was higher at PRE compared to Pax7+/C-Met+ cells (P= 0.003; Fig. 4C). However, the number of Pax7+/C-Met+ cells significantly increased 24 h after muscle damage (P= 0.016), while the number of Pax7+/NCAM+ cells showed a strong trend to increase (P= 0.07). In both cases there were several SCs that only stained positive for one of the two SC markers suggesting some heterogeneity in the SC pool (e.g. supplemental Fig. S3). There were significantly more Pax7+ only cells compared to either NCAM+ or C-Met+ only cells (P= 0.001; as % MN, Fig. 4D). Following myotrauma there was no detectable increase in any of the single-marker positive cell populations; however the number of Pax7+ only cells was no longer significantly higher than NCAM+ or C-Met+ only cell populations (P= 0.065, Fig. 4D).
Figure 4. Co-labelling of satellite cell markers before (PRE) and 24 h after muscle damage.
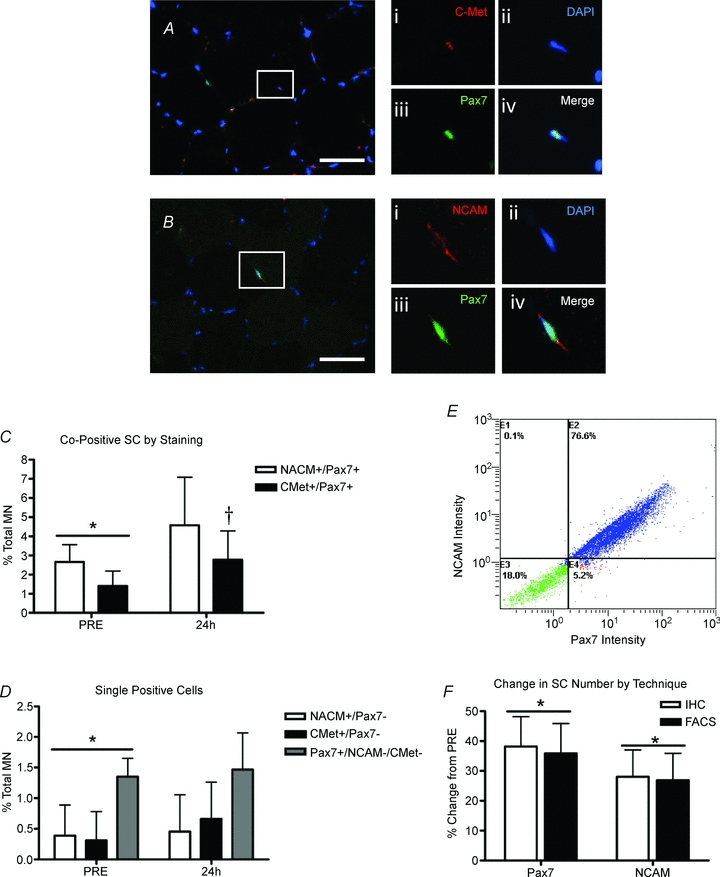
A, co-localization of C-Met and Pax7 with DAPI, scale bar = 50 μm; higher magnification of box: (i) C-Met (red), (ii) nucleus (DAPI, blue), (iii) Pax7 (green), and (iv) merged image showing co-localization. B, co-localization of NCAM and Pax7 with DAPI, scale bar = 50 μm; higher magnification of box: (i) NCAM (red), (ii) nucleus (DAPI, blue), (iii) Pax7 (green), and (iv) merged image showing co-localization. C, co-positive SC number by marker as a percentage of total myonuclei. *Significant difference between NCAM/Pax7 and C-Met/Pax7 at PRE (P < 0.05). †Significant effect of time for C-Met/Pax7 (P < 0.05). D, single positive cells (cells expressing only one SC marker) as a percentage of total myonuclei. *Significant difference at PRE between Pax7 only vs. C-Met and NCAM only (P < 0.05). E, representative flow cytometry histogram of muscle derived mononuclear cells stained for NCAM and Pax7. Cells expressing both NCAM and Pax7 (E2) represent approximately 95% of all positive cells, while NCAM only cells (E1) and Pax7 only (E4) represent approximately 5% of all positive cells. Cells negative for both SC markers are shown in quadrant E3. F, comparison of flow cytometry and IHC enumeration techniques: comparison of the percentage change in SC number 24 h after muscle damage analysed by flow cytometry and IHC for Pax7 and NCAM. *Significant effect of time (PRE vs. 24 h: P < 0.05). All data presented as means ±s.d., n= 12.
The commonly used marker NCAM co-localized to approximately 95% of Pax7+ cells using immunohistochemical techniques (data not shown). To verify that both markers were in fact binding to the same cells, we isolated mononuclear cells from fresh muscle and stained them for both NCAM and Pax7 and analysed them via flow cytometry. Figure 4E is a histogram illustrating the percentage co-localization of Pax7 and NCAM using flow cytometry. This experiment verified the immunohistochemical findings where approximately 95% of the Pax7+ cells also stained positive for NCAM (section E2, Fig. 4E). In addition, we also observed more Pax7+ only cells (section E4, Fig. 4E), compared with NCAM+ only (section E1, Fig. 4E) further verifying our finding that Pax7 appears to be expressed in a larger proportion of the SC pool then NCAM alone during the time course of our experimental protocol.
Comparison of flow cytometry and immunohistochemistry for muscle satellite cell enumeration
Both flow cytometry on fresh muscle samples and IHC on frozen muscle cross-sections illustrated that expression of Pax7 and NCAM similarly increased 24 h after acute myotrauma (Figs 1B and 3E). The comparison of the expansion of both Pax7 and NCAM positive cells expressed as a percentage change from PRE revealed that both techniques (FACS or IHC) report similar increases in SC number. For Pax7, flow cytometry (or FACS) reported a 36% increase in Pax7+ cells mg−1 (P= 0.04), and IHC reported a 36% increase in Pax7+ cells per 100 myofibres (P < 0.05, Fig. 4F). In addition, NCAM followed a similar trend increasing approximately 27% using flow cytometry (P < 0.05) and increasing 28% using immunohistochemistry (NCAM+ cells per 100 MFs, P < 0.05; Fig. 4F).
Discussion
We have demonstrated a significant shift of human muscle SC from G0/G1 to S- and G2/M-phase of the cell cycle in vivo in as little as 24 h following contraction-induced muscle injury. Furthermore, we report that FC or FACS analysis of freshly isolated human SC is an objective and reliable method for SC enumeration. Further, we demonstrate that analysis by FC allows for the accurate determination of cell cycle kinetics of SC at a resolution which is virtually unobtainable by IHC. Finally, we demonstrate that analysis of either Pax7 or NCAM results in similar increases in the SC pool following acute myotrauma; however Pax7 appears to be more widely expressed as compared to NCAM or C-Met.
In order to verify that FC analysis is an accurate tool to quantify the SC response to muscle damage, we chose to use a muscle-lengthening contraction protocol which we have previously shown to induce a significant increase in SCs (O’Reilly et al. 2008; McKay et al. 2009) and MRF mRNA expression (McKay et al. 2008) and an induction of some level of muscle damage (Beaton et al. 2002a,b; Mahoney et al. 2008). Muscle damage from our protocol was verified with a 212% increase in CK observed in the blood 24 h after the single-leg exercise bout. Myogenic lineage of Pax7+ cells was verified using the muscle intermediate filament protein desmin. Although it is unknown if all SCs in vivo express desmin, it has been shown that desmin expression precedes that of MyoD and may be regulated by Myf5 and thus is one of the earliest markers of myogenic commitment (Bar et al. 2004). Previously it has been suggested that SCs expressing desmin may be a subpopulation of fusion competent cells which do not proliferate but rather are committed to differentiation, whereas desmin negative cells were able to undergo rounds of cell division (Rantanen et al. 1995). However, data from human SCs in culture indicated that both subpopulations (cells committed to differentiation and non-fusion competent myoblasts) expressed desmin (Baroffio et al. 1995). Furthermore, native SCs (freshly isolated from human muscle) constituted a homogeneous cell population which expressed desmin and desmin has been shown to be expressed along with Pax3 and Pax7 in proliferating myogenic precursors isolated from human muscle. (Baroffio et al. 1995; Conboy et al. 2010). Of the mononuclear cells isolated from human muscle in the present study, all of the desmin+ cells were Pax7+. In addition, those cells sorted for Pax7 all stained positive for desmin in the cytosol. Thus it appears that in humans, Pax7+ cells are committed to the myogenic lineage, but whether or not these cells can be further separated into subpopulations based on fusion competency remains unknown.
Cell cycle analysis is particularly important when evaluating the SC response to a stimulus. However, to date, SC cell cycle analysis has been limited to the description of SCs that are either in the cell cycle (i.e. active; Ki67 positive) or not active (Ki67 negative). Currently the use of Ki67 or proliferating cell nuclear antigen (PCNA) in muscle cross-sections is routinely used to determine the percentage of SCs actively proliferating (Mackey et al. 2009; McKay et al. 2009). However both Ki67 and PCNA provide limited data with regards to cell cycle kinetics. Ki67 is apparent in the nucleus during all phases of the cell cycle, and thus its expression does not discern cells in discrete phases of the cell cycle. PCNA is only expressed in the nuclei of cells in the DNA synthesis phase (S-phase) and in late G1 of the cell cycle (Bruno et al. 1992) and therefore may underestimate the number of cycling cells in a muscle cross-section. FC analysis using propidium iodide (PI) allows for a more precise measurement of cell cycle kinetics based on DNA content of each cell. Therefore the use of PI allows for the description of the proliferation characteristics of SC as they were in vivo allowing for the determination of the number of cells in each discrete phase. Our data show that acute myotrauma is sufficient to induce an increase in the number of SCs in all phases of the cell cycle. There was a 32% increase in the number of SCs in G0/G1 of the cell cycle, which suggests that 24 h was sufficient for a proportion of the SCs to activate and complete one round of cell division. This finding is supported by the 36% increase in Pax7+ cells (mg tissue)−1 24 h after injury. Furthermore, there was a significant increase in the number of SC progressing through the cell cycle towards mitosis (59% increase in SCs in S-phase, 202% increase in SCs in G2/M). These data support previous reports showing a detectable expansion of the SC pool at 24 h which progresses until at least 72 h after induced myotrauma (O’Reilly et al. 2008; McKay et al. 2009). However, here we clearly illustrate that the active cells are not synchronized (but vary in cell cycle phase) and thus differences in activation and proliferation between different groups or populations (i.e. elderly vs. young) may be readily detectable using this method. In addition to SC number, determination of cell cycle kinetics would be invaluable to discern if there is a delay in the SC response in human elderly muscle (or clinical populations, etc.).
Through a series of experiments we determined that the average tissue required for accurate reproducibility of the FC analysis was ≥50 mg. Although more tissue is needed for FC as compared to immunohistochemistry, this technique allows for multiple antigen labelling of SCs, which allows for not only SC enumeration but also cell cycle analysis and potentially the determination of SC-specific expression of many key regulators (such as IGF-1, IL-6, etc.) in a single analysis. The time and subjectivity involved in this analysis are significantly less than with IHC (i.e. ∼4 h for FC vs. several weeks for IHC), resulting in virtually instantaneous results. FC analysis of SC expansion was verified by IHC and through the use of multiple markers (i.e. Pax7, NCAM and C-Met). FC analysis of both NCAM and Pax7 reported identical percentage changes in the SC pool compared with IHC techniques. However, Pax7 was consistently expressed on ∼5% more cells than NCAM, which is in contrast to the staining pattern observed by others (Mackey et al. 2009; Mikkelsen et al. 2009; Lindstrom & Thornell, 2009) who reported a slightly higher level of NCAM staining compared to Pax7 in human muscle cross-sections. We verified the IHC finding using flow cytometry, where 95% of Pax7+ cells expressed NCAM with ∼5% of cells that were Pax7+/NCAM−. This finding supports previous work where muscle SCs, identified in cross-section by co-labelling with NCAM and Pax7, showed that 94–96% of SCs were positive for both NCAM and Pax7 (Verdijk et al. 2007; Lindstrom & Thornell, 2009). However, our data suggest that Pax7+ cells are present to a greater degree than NCAM+ cells. This finding contrasts with the work by Lindstrom & Thornell (2009), who showed, in cross-section, that NCAM+ cells represent a greater proportion of cells than Pax7+ cells (5% of SC total was NCAM+/Pax7−). Our data show the opposite, with NCAM−/Pax7+ cells representing approximately 5% of the total SC pool. This finding was consistent between FC and IHC, and was repeated with separate sections to ensure accuracy of our findings. It is unclear at this time why this discrepancy exists since the same source for antibodies was used in both studies (Lindstrom & Thornell, 2009). The stringent staining protocol used by Lindstrom & Thornell (2009) showed a higher NCAM expression in 18 of the 19 subjects. Thus, reconciling the differences between these studies may not be solely due to enumeration methods. Our previous studies employing the same damage protocol utilized either NCAM (O’Reilly et al. 2008) or Pax7 (McKay et al. 2009) as the IHC marker for SCs. As in the present study, Pax7 illustrated a larger response from the same relative damage compared to NCAM (O’Reilly et al. 2008; McKay et al. 2009).
Some of the discrepancy between Pax7 and NCAM staining may be partially attributed to the fact that NCAM was recently shown to mark SCs committed to differentiation (Capkovic et al. 2008). Capkovic et al. (2008) were able to separate homogeneous primary myoblast cultures into proliferating and differentiating fractions based on NCAM expression. Furthermore, in vitro studies indicated that NCAM is mainly involved in early myoblast differentiation of cell–cell fusion leading to enhanced myotube formation (Suzuki et al. 2003). In addition, NCAM is not a SC specific marker, labelling intramuscular nerves, motor unit end terminals, Schwann cells and regenerating myofibres (Cashman et al. 1987; Illa et al. 1992; Mechtersheimer et al. 1992; Lindstrom & Thornell, 2009). These studies suggest that NCAM may not be the most appropriate marker for SC enumeration alone, especially during the early stages of muscle repair. Thus, the fact that NCAM is expressed to a higher degree in SC committing to terminal differentiation may explain why there were more NCAM+/Pax7− cells observed by others (Lindstrom & Thornell, 2009; Mikkelsen et al. 2009). As the majority of SCs progress towards differentiation they may begin to lose Pax7 and increase NCAM to allow for differentiation to occur (Capkovic et al. 2008; Kuang et al. 2008). Depending on the sampling time point, the SC pool may differentially express NCAM and Pax7. For example, a muscle sample at 4–8 days post-exercise may express NCAM to a greater degree as cells progress towards differentiation, whereas the sampling time point of 24 h may only capture the onset of the proliferative phase of the myogenic programme. It has been previously demonstrated that Pax7 is a known modulator of MyoD and Myf5 expression (Relaix et al. 2006; Zammit et al. 2006; McKinnell et al. 2008), and therefore may represent the SC population to a greater degree at earlier time points. Further research is warranted to determine the role of NCAM in the SC response to physiological damage.
The use of any single satellite cell marker alone for enumeration may inherently underestimate total SC number. Importantly, for consistency in reporting SC number via IHC, the use of laminin to identify the SC niche is critical especially when using NCAM as a SC marker (Lindstrom & Thornell, 2009). Pax7 has been shown to be expressed on the majority of human SCs (Reimann et al. 2004; Eriksson et al. 2005; Verdijk et al. 2007; Mikkelsen et al. 2009), representing approximately 95% of the SC pool. Thus to examine this heterogeneity further, the hepatocyte growth factor (HGF) receptor C-Met was also examined in the current study as another potential marker for human SC enumeration. The number of C-Met+ cells or C-Met+/Pax7+ cells was significantly lower PRE vs. NCAM+ or NCAM+/Pax7+ or Pax7+ cells, suggesting that the expression of C-Met is either very low in quiescent human SCs or that there is significant heterogeneity in the quiescent SC pool. C-met+ cells increased 80% 24 h after exercise, which is likely to have represented Pax7+ cells that upregulated C-Met expression rather than an 80% increase in total SCs. This suggests that C-met is highly inducible and not likely to be an effective immunohistochemical marker of SC number since it does not appear to be basally expressed (or expressed at detectable levels) on all human SC. Additionally, our data suggest that the expansion of the SC pool cannot be accounted for by a cell population expressing only a single SC marker. When examining cells expressing only Pax7, C-met, or NCAM (Fig. 4D) no increase in the SC pool could be detected. This suggests that the expansion of the SC pool was accounted for by cells expressing multiple markers, which may be interpreted as an expansion of cells with greater relative complexity (i.e. greater myogenic commitment). For example, the percentage of myonuclei represented by cells only expressing Pax7 was approximately 1.4% at baseline and this did not change 24 h following damage. However, since the total number of Pax7+ cells increased 36% following damage, then the increase could be accounted for by cells that expressed multiple markers and were likely progressing through the cell cycle. It may be that the single positive cells represent quiescent or more primitive progenitor cells (i.e. C-Met+ or Pax7+ only cells) or represent cells near terminal differentiation (i.e. NCAM+ only cells; Capkovic et al. 2008). Further work is needed to investigate C-Met expression and the role of HGF/C-Met signalling in response to damage. Previous work from our lab illustrated that components of the HGF signalling pathway were upregulated 4–24 h after damaging exercise, suggesting that HGF is playing a role in the SC response to injury in humans (O’Reilly et al. 2008), and thus the increase in HGF signalling may have led to the increase in C-Met observed at 24 h.
For IHC, it appears that multiple labelling (Pax7 and NCAM or Pax7 and C-Met) provides the best description of the SC pool and the response to muscle damage. However, the use of multiple markers can become very difficult in IHC especially with multiple nuclear antigens. Thus, the use of FC to quantify the expression of SC specific markers in addition to other measures such as cell cycle analysis through the application of multiple antibodies and the availability of positive and negative sorts for enhanced analysis seems preferable.
In conclusion, the use of FC and FACS has proven to be an objective, reproducible and precise tool for the investigation of SC cell cycle kinetics. We report the expansion of SCs in discrete phases of the cell cycle from cells freshly isolated from human muscle and immediately fixed to preserve the in vivo characteristics of these cells. The cell cycle analysis illustrated not only the initial expansion in SC number (32% increase in cells in G0/G1) but also that 202% more cells were in G2/M of the cell cycle progressing toward cell division. Furthermore, FC analysis illustrated the same percentage expansion of the SC pool as IHC, with SC number reported as the number of SC per milligram of tissue. Our findings with both IHC and FC support previous work illustrating that NCAM and Pax7 mark approximately 95% of the SC pool and that both are sensitive enough to detect subtle changes in SC number as early as 24 h after muscle damage or exercise stimuli (Verdijk et al. 2007; Lindstrom & Thornell, 2009; Mikkelsen et al. 2009).
Acknowledgments
Funding for this study was provided by CIHR (90915) and NSERC (327073-06) through grants awarded to G.P. B.R.M. currently holds an Alexander Graham Bell Doctoral CGS through NSERC. The Pax7 hybridoma cells developed by Dr A. Kawakami were obtained from the Developmental Studies Hybridoma Bank (DSHB) developed under the auspices of the NICHD and maintained by the University of Iowa, Department of Biology, Iowa City, IA 52242 USA. We would like to acknowledge Nicole MacFarlane and Dr Doug Boreham for their technical assistance with the flow cytometry and FACS analysis.
Glossary
Abbreviations
- FC
flow cytometry
- FACS
fluorescence activated cell sorting
- IHC
immunohistochemistry
- MRF
myogenic regulatory factor
- NCAM
neural cell adhesion molecule
- PCNA
proliferating cell nuclear antigen
- SC
satellite cell
Author contributions
Study conception and design: G.P., B.R.M. Sample collection and data analysis: B.R.M., K.G.T., M.A.T., G.P. Manuscript Preparation: B.R.M, G.P. Manuscript Editing: B.R.M., G.P., K.G.T., M.A.T. All authors approved the final version for publication. This work was completed at McMaster University, Hamilton, Ontario Cananda.
Supplemental material
supplemental Fig. S1
supplemental Fig. S2
supplemental Fig. S3
As a service to our authors and readers, this journal provides supporting information supplied by the authors. Such materials are peer-reviewed and may be re-organized for online delivery, but are not copy-edited or typeset. Technical support issues arising from supporting information (other than missing files) should be addressed to the authors
References
- Alexander CM, Puchalski J, Klos KS, Badders N, Ailles L, Kim CF, Dirks P, Smalley MJ. Separating stem cells by flow cytometry: reducing variability for solid tissues. Cell Stem Cell. 2009;5:579–583. doi: 10.1016/j.stem.2009.11.008. [DOI] [PMC free article] [PubMed] [Google Scholar]
- Bar H, Strelkov SV, Sjoberg G, Aebi U, Herrmann H. The biology of desmin filaments: how do mutations affect their structure, assembly, and organisation? J Struct Biol. 2004;148:137–152. doi: 10.1016/j.jsb.2004.04.003. [DOI] [PubMed] [Google Scholar]
- Baroffio A, Bochaton-Piallat ML, Gabbiani G, Bader CR. Heterogeneity in the progeny of single human muscle satellite cells. Differentiation. 1995;59:259–268. doi: 10.1046/j.1432-0436.1995.5940259.x. [DOI] [PubMed] [Google Scholar]
- Beaton LJ, Allan DA, Tarnopolsky MA, Tiidus PM, Phillips SM. Contraction-induced muscle damage is unaffected by vitamin E supplementation. Med Sci Sports Exerc. 2002a;34:798–805. doi: 10.1097/00005768-200205000-00012. [DOI] [PubMed] [Google Scholar]
- Beaton LJ, Tarnopolsky MA, Phillips SM. Contraction-induced muscle damage in humans following calcium channel blocker administration. J Physiol. 2002b;544:849–859. doi: 10.1113/jphysiol.2002.022350. [DOI] [PMC free article] [PubMed] [Google Scholar]
- Bergstrom J. Percutaneous needle biopsy of skeletal muscle in physiological and clinical research. Scand J Clin Lab Invest. 1975;35:609–616. [PubMed] [Google Scholar]
- Bourgeois JM, Tarnopolsky MA. Pathology of skeletal muscle in mitochondrial disorders. Mitochondrion. 2004;4:441–452. doi: 10.1016/j.mito.2004.07.036. [DOI] [PubMed] [Google Scholar]
- Bruno S, Gorczyca W, Darzynkiewicz Z. Effect of ionic strength in immunocytochemical detection of the proliferation associated nuclear antigens p120, PCNA, and the protein reacting with Ki-67 antibody. Cytometry. 1992;13:496–501. doi: 10.1002/cyto.990130508. [DOI] [PubMed] [Google Scholar]
- Capkovic KL, Stevenson S, Johnson MC, Thelen JJ, Cornelison DD. Neural cell adhesion molecule (NCAM) marks adult myogenic cells committed to differentiation. Exp Cell Res. 2008;314:1553–1565. doi: 10.1016/j.yexcr.2008.01.021. [DOI] [PMC free article] [PubMed] [Google Scholar]
- Cashman NR, Covault J, Wollman RL, Sanes JR. Neural cell adhesion molecule in normal, denervated, and myopathic human muscle. Ann Neurol. 1987;21:481–489. doi: 10.1002/ana.410210512. [DOI] [PubMed] [Google Scholar]
- Charge SB, Rudnicki MA. Cellular and molecular regulation of muscle regeneration. Physiol Rev. 2004;84:209–238. doi: 10.1152/physrev.00019.2003. [DOI] [PubMed] [Google Scholar]
- Conboy MJ, Cerletti M, Wagers AJ, Conboy IM. Immuno-analysis and FACS sorting of adult muscle fiber-associated stem/precursor cells. Methods Mol Biol. 2010;621:165–173. doi: 10.1007/978-1-60761-063-2_11. [DOI] [PubMed] [Google Scholar]
- Crameri RM, Aagaard P, Qvortrup K, Langberg H, Olesen J, Kjaer M. Myofibre damage in human skeletal muscle: effects of electrical stimulation versus voluntary contraction. J Physiol. 2007;583:365–380. doi: 10.1113/jphysiol.2007.128827. [DOI] [PMC free article] [PubMed] [Google Scholar]
- Crameri RM, Langberg H, Magnusson P, Jensen CH, Schroder HD, Olesen JL, Suetta C, Teisner B, Kjaer M. Changes in satellite cells in human skeletal muscle after a single bout of high intensity exercise. J Physiol. 2004;558:333–340. doi: 10.1113/jphysiol.2004.061846. [DOI] [PMC free article] [PubMed] [Google Scholar]
- Dhawan J, Rando TA. Stem cells in postnatal myogenesis: molecular mechanisms of satellite cell quiescence, activation and replenishment. Trends Cell Biol. 2005;15:666–673. doi: 10.1016/j.tcb.2005.10.007. [DOI] [PubMed] [Google Scholar]
- Dreyer HC, Blanco CE, Sattler FR, Schroeder ET, Wiswell RA. Satellite cell numbers in young and older men 24 hours after eccentric exercise. Muscle Nerve. 2006;33:242–253. doi: 10.1002/mus.20461. [DOI] [PubMed] [Google Scholar]
- Eriksson A, Kadi F, Malm C, Thornell LE. Skeletal muscle morphology in power-lifters with and without anabolic steroids. Histochem Cell Biol. 2005;124:167–175. doi: 10.1007/s00418-005-0029-5. [DOI] [PubMed] [Google Scholar]
- Hennessey JV, Chromiak JA, Della VS, Guertin J, MacLean DB. Increase in percutaneous muscle biopsy yield with a suction-enhancement technique. J Appl Physiol. 1997;82:1739–1742. doi: 10.1152/jappl.1997.82.6.1739. [DOI] [PubMed] [Google Scholar]
- Holterman CE, Rudnicki MA. Molecular regulation of satellite cell function. Semin Cell Dev Biol. 2005;16:575–584. doi: 10.1016/j.semcdb.2005.07.004. [DOI] [PubMed] [Google Scholar]
- Illa I, Leon-Monzon M, Dalakas MC. Regenerating and denervated human muscle fibers and satellite cells express neural cell adhesion molecule recognized by monoclonal antibodies to natural killer cells. Ann Neurol. 1992;31:46–52. doi: 10.1002/ana.410310109. [DOI] [PubMed] [Google Scholar]
- Kadi F, Eriksson A, Holmner S, Butler-Browne GS, Thornell LE. Cellular adaptation of the trapezius muscle in strength-trained athletes. Histochem Cell Biol. 1999;111:189–195. doi: 10.1007/s004180050348. [DOI] [PubMed] [Google Scholar]
- Kadi F, Schjerling P, Andersen LL, Charifi N, Madsen JL, Christensen LR, Andersen JL. The effects of heavy resistance training and detraining on satellite cells in human skeletal muscles. J Physiol. 2004;558:1005–1012. doi: 10.1113/jphysiol.2004.065904. [DOI] [PMC free article] [PubMed] [Google Scholar]
- Kadi F, Thornell LE. Concomitant increases in myonuclear and satellite cell content in female trapezius muscle following strength training. Histochem Cell Biol. 2000;113:99–103. doi: 10.1007/s004180050012. [DOI] [PubMed] [Google Scholar]
- Kuang S, Gillespie MA, Rudnicki MA. Niche regulation of muscle satellite cell self-renewal and differentiation. Cell Stem Cell. 2008;2:22–31. doi: 10.1016/j.stem.2007.12.012. [DOI] [PubMed] [Google Scholar]
- Lauritzen F, Paulsen G, Raastad T, Bergersen LH, Owe SG. Gross ultrastructural changes and necrotic fiber segments in elbow flexor muscles after maximal voluntary eccentric action in humans. J Appl Physiol. 2009;107:1923–1934. doi: 10.1152/japplphysiol.00148.2009. [DOI] [PubMed] [Google Scholar]
- Le Grand F, Rudnicki MA. Skeletal muscle satellite cells and adult myogenesis. Curr Opin Cell Biol. 2007;19:628–633. doi: 10.1016/j.ceb.2007.09.012. [DOI] [PMC free article] [PubMed] [Google Scholar]
- Lindstrom M, Thornell LE. New multiple labelling method for improved satellite cell identification in human muscle: application to a cohort of power-lifters and sedentary men. Histochem Cell Biol. 2009;132:141–157. doi: 10.1007/s00418-009-0606-0. [DOI] [PubMed] [Google Scholar]
- Mackey AL, Esmarck B, Kadi F, Koskinen SO, Kongsgaard M, Sylvestersen A, Hansen JJ, Larsen G, Kjaer M. Enhanced satellite cell proliferation with resistance training in elderly men and women. Scand J Med Sci Sports. 2007a;17:34–42. doi: 10.1111/j.1600-0838.2006.00534.x. [DOI] [PubMed] [Google Scholar]
- Mackey AL, Kjaer M, Charifi N, Henriksson J, Bojsen-Moller J, Holm L, Kadi F. Assessment of satellite cell number and activity status in human skeletal muscle biopsies. Muscle Nerve. 2009;40:455–465. doi: 10.1002/mus.21369. [DOI] [PubMed] [Google Scholar]
- Mackey AL, Kjaer M, Dandanell S, Mikkelsen KH, Holm L, Dossing S, Kadi F, Koskinen SO, Jensen CH, Schroder HD, Langberg H. The influence of anti-inflammatory medication on exercise-induced myogenic precursor cell responses in humans. J Appl Physiol. 2007b;103:425–431. doi: 10.1152/japplphysiol.00157.2007. [DOI] [PubMed] [Google Scholar]
- Mackey AL, Kjaer M, Dandanell S, Mikkelsen KH, Holm L, Dossing S, Kadi F, Koskinen SO, Jensen CH, Schroder HD, Langberg H. The influence of anti-inflammatory medication on exercise-induced myogenic precursor cell responses in humans. J Appl Physiol. 2007c;103:425–431. doi: 10.1152/japplphysiol.00157.2007. [DOI] [PubMed] [Google Scholar]
- Mahoney DJ, Safdar A, Parise G, Melov S, Fu M, MacNeil L, Kaczor J, Payne ET, Tarnopolsky MA. Gene expression profiling in human skeletal muscle during recovery from eccentric exercise. Am J Physiol Regul Integr Comp Physiol. 2008;294:R1901–R1910. doi: 10.1152/ajpregu.00847.2007. [DOI] [PMC free article] [PubMed] [Google Scholar]
- Maura A. Satellite cell of skeletal muscle fibers. J Biophys Biochem Cytol. 1961;9:493–495. doi: 10.1083/jcb.9.2.493. [DOI] [PMC free article] [PubMed] [Google Scholar]
- McKay BR, De Lisio M, Johnston AP, O’Reilly CE, Phillips SM, Tarnopolsky MA, Parise G. Association of interleukin-6 signalling with the muscle stem cell response following muscle-lengthening contractions in humans. PLoS One. 2009;4:e6027. doi: 10.1371/journal.pone.0006027. [DOI] [PMC free article] [PubMed] [Google Scholar]
- McKay BR, O’Reilly CE, Phillips SM, Tarnopolsky MA, Parise G. Co-expression of IGF-1 family members with myogenic regulatory factors following acute damaging muscle-lengthening contractions in humans. J Physiol. 2008;586:5549–5560. doi: 10.1113/jphysiol.2008.160176. [DOI] [PMC free article] [PubMed] [Google Scholar]
- McKinnell IW, Ishibashi J, Le GF, Punch VG, Addicks GC, Greenblatt JF, Dilworth FJ, Rudnicki MA. Pax7 activates myogenic genes by recruitment of a histone methyltransferase complex. Nat Cell Biol. 2008;10:77–84. doi: 10.1038/ncb1671. [DOI] [PMC free article] [PubMed] [Google Scholar]
- Mechtersheimer G, Staudter M, Moller P. Expression of the natural killer (NK) cell-associated antigen CD56(Leu-19), which is identical to the 140-kDa isoform of N-CAM, in neural and skeletal muscle cells and tumors derived therefrom. Ann N Y Acad Sci. 1992;650:311–316. doi: 10.1111/j.1749-6632.1992.tb49143.x. [DOI] [PubMed] [Google Scholar]
- Megeney LA, Kablar B, Garrett K, Anderson JE, Rudnicki MA. MyoD is required for myogenic stem cell function in adult skeletal muscle. Genes Dev. 1996;10:1173–1183. doi: 10.1101/gad.10.10.1173. [DOI] [PubMed] [Google Scholar]
- Mikkelsen UR, Langberg H, Helmark IC, Skovgaard D, Andersen LL, Kjaer M, Mackey AL. Local NSAID infusion inhibits satellite cell proliferation in human skeletal muscle after eccentric exercise. J Appl Physiol. 2009;107:1600–1611. doi: 10.1152/japplphysiol.00707.2009. [DOI] [PMC free article] [PubMed] [Google Scholar]
- O’Reilly C, McKay B, Phillips S, Tarnopolsky M, Parise G. Hepatocyte growth factor (HGF) and the satellite cell response following muscle lengthening contractions in humans. Muscle Nerve. 2008;38:1434–1442. doi: 10.1002/mus.21146. [DOI] [PubMed] [Google Scholar]
- Parise G, McKinnell IW, Rudnicki MA. Muscle satellite cell and atypical myogenic progenitor response following exercise. Muscle Nerve. 2008;37:611–619. doi: 10.1002/mus.20995. [DOI] [PubMed] [Google Scholar]
- Paulsen G, Crameri R, Benestad HB, Fjeld JG, Morkrid L, Hallen J, Raastad T. Time course of leukocyte accumulation in human muscle after eccentric exercise. Med Sci Sports Exerc. 2010;42:75–85. doi: 10.1249/MSS.0b013e3181ac7adb. [DOI] [PubMed] [Google Scholar]
- Rantanen J, Hurme T, Lukka R, Heino J, Kalimo H. Satellite cell proliferation and the expression of myogenin and desmin in regenerating skeletal muscle: evidence for two different populations of satellite cells. Lab Invest. 1995;72:341–347. [PubMed] [Google Scholar]
- Reimann J, Brimah K, Schroder R, Wernig A, Beauchamp JR, Partridge TA. Pax7 distribution in human skeletal muscle biopsies and myogenic tissue cultures. Cell Tissue Res. 2004;315:233–242. doi: 10.1007/s00441-003-0833-y. [DOI] [PubMed] [Google Scholar]
- Relaix F, Montarras D, Zaffran S, Gayraud-Morel B, Rocancourt D, Tajbakhsh S, Mansouri A, Cumano A, Buckingham M. Pax3 and Pax7 have distinct and overlapping functions in adult muscle progenitor cells. J Cell Biol. 2006;172:91–102. doi: 10.1083/jcb.200508044. [DOI] [PMC free article] [PubMed] [Google Scholar]
- Seale P, Rudnicki MA. A new look at the origin, function, and “stem-cell” status of muscle satellite cells. Dev Biol. 2000;218:115–124. doi: 10.1006/dbio.1999.9565. [DOI] [PubMed] [Google Scholar]
- Suzuki M, Angata K, Nakayama J, Fukuda M. Polysialic acid and mucin type o-glycans on the neural cell adhesion molecule differentially regulate myoblast fusion. J Biol Chem. 2003;278:49459–49468. doi: 10.1074/jbc.M308316200. [DOI] [PubMed] [Google Scholar]
- Verdijk LB, Koopman R, Schaart G, Meijer K, Savelberg HH, van Loon LJ. Satellite cell content is specifically reduced in type II skeletal muscle fibers in the elderly. Am J Physiol Endocrinol Metab. 2007;292:E151–E157. doi: 10.1152/ajpendo.00278.2006. [DOI] [PubMed] [Google Scholar]
- Zammit PS. All muscle satellite cells are equal, but are some more equal than others? J Cell Sci. 2008;121:2975–2982. doi: 10.1242/jcs.019661. [DOI] [PubMed] [Google Scholar]
- Zammit PS, Partridge TA, Yablonka-Reuveni Z. The skeletal muscle satellite cell: the stem cell that came in from the cold. J Histochem Cytochem. 2006;54:1177–1191. doi: 10.1369/jhc.6R6995.2006. [DOI] [PubMed] [Google Scholar]
Associated Data
This section collects any data citations, data availability statements, or supplementary materials included in this article.