

Abstract
During reductions in central blood volume while heat stressed, a greater decrease in stroke volume (SV) for a similar decrease in ventricular filling pressure, compared to normothermia, suggests that the heart is operating on a steeper portion of a Frank–Starling curve. If so, volume loading of heat-stressed individuals would shift the operating point to a flatter portion of the heat stress Frank–Starling curve thereby attenuating the reduction in SV during subsequent decreases in central blood volume. To investigate this hypothesis, right heart catheterization was performed in eight males from whom pulmonary capillary wedge pressure (PCWP), central venous pressure and SV (via thermodilution) were obtained while central blood volume was reduced via lower-body negative pressure (LBNP) during normothermia, whole-body heating (increase in blood temperature ∼1°C), and during whole-body heating after intravascular volume expansion. Volume expansion was accomplished by administration of a combination of a synthetic colloid (HES 130/0.4, Voluven) and saline. Before LBNP, SV was not affected by heating (122 ± 30 ml; mean ±s.d.) compared to normothermia (110 ± 20 ml; P= 0.06). However, subsequent volume loading increased SV to 143 ± 29 ml (P= 0.003). LBNP provoked a larger decrease in SV relative to the decrease in PCWP during heating (8.6 ± 1.9 ml mmHg−1) compared to normothermia (4.5 ± 3.0 ml mmHg−1, P= 0.02). After volume loading while heat stressed, the reduction in the SV to PCWP ratio during LBNP was comparable to that observed during normothermia (4.8 ± 2.3 ml mmHg−1; P= 0.78). These data support the hypothesis that a Frank–Starling mechanism contributes to compromised blood pressure control during simulated haemorrhage in heat-stressed individuals, and extend those findings by showing that volume infusion corrects this deficit by shifting the operating point to a flatter portion of the heat stress Frank–Starling curve.
Introduction
The Frank–Starling mechanism describes the relation between cardiac stroke volume (SV) and preload, expressed as the central venous pressure (CVP) or pulmonary capillary wedge pressure (PCWP) for the right and left ventricles, respectively (Patterson & Starling, 1914; Patterson et al. 1914; Swan et al. 1970). Accordingly, the Frank–Starling relation refers to a family of hyperbolic curves, with these curves having the capacity to shift with changes in cardiac contractility and afterload (Sarnoff & Mitchell, 1961). Operating on a steeper slope of a Frank–Starling curve is implicated in certain types of orthostatic intolerance (Levine, 1993). Perturbations such as volume loading, that increases PCWP, may relocate the operating point to a less steep portion of a Frank–Starling curve resulting in less of a reduction in stroke volume during provocations such as orthostatic or haemorrhagic challenges.
Whole-body heat stress reduces central blood volume and thus preload to the heart as assessed by electrical impedance (Cai et al. 2000), distribution of red blood cells (Crandall et al. 2008), CVP and PCWP, while SV is maintained (Rowell et al. 1969; Wilson et al. 2007, 2009). Despite a preserved SV while supine, heat stress shifts the operating point to a steeper portion of a Frank–Starling curve, resulting in a greater reduction in SV for a given reduction in PCWP during a simulated haemorrhagic challenge via lower-body negative pressure (LBNP) (Wilson et al. 2009). Conversely, increasing central blood volume in heat-stressed individuals normalizes orthostatic tolerance during LBNP relative to when subjects are normothermic (Keller et al. 2009). Given these observations, we hypothesize that volume expansion of heat-stressed individuals will relocate the operating point to a less steep portion of a Frank–Starling curve. If this hypothesis is correct, for a given reduction in left ventricular filling pressure there would be less of a reduction in SV while in this volume-expanded condition, similar to that observed while the individual is normothermic.
Methods
Subjects
Eight healthy male subjects of age (mean ±s.d.) 29 ± 5 years, height 180 ± 5 cm and weight 75 ± 4 kg participated in the study after oral and written informed consent. The subjects were not taking any prescribed or over-the-counter medications and they were free of any known cardiovascular, metabolic, or neurological diseases. The study and informed consent were approved by the Ethics Committee of Copenhagen (H-KF-090/04) and were registered by the Danish data protection agency and ClinacalTrials.gov under the national library of medicine (NCT00714766). All experiments were performed in accordance with the Declaration of Helsinki.
Instrumentation and measurements
Six thermocouples were attached to each subject's skin from which mean skin temperature was obtained (Taylor et al. 1989). ECG electrodes were placed for the measurement of heart rate. Each subject wore a tube-lined water-perfusion suit and was placed supine in an LBNP chamber. The suit covered the entire body except for the head, one forearm, hands and feet. A 20-gauge catheter was placed in the brachial artery of the non-dominant arm for arterial pressure measurements, and a flow-directed pulmonary arterial catheter (93A-831H-7.5F, Baxter Healthcare Corporation, Irvine, CA, USA) was introduced through the basilic vein of the left arm and advanced to the pulmonary artery. The catheter lumens were flushed with isotonic saline at 3 ml h−1. Blood temperature was measured from the right heart catheter in the pulmonary artery. Cardiac output (CO) was measured via thermodilution upon injection of 10 ml of ice-cooled isotonic saline, repeated 3–4 times per condition and reported as the mean cardiac output per condition. Multiple PCWP measurements for each condition were averaged during 5 s periods of end-expiratory breath-holds that were preceded by balloon inflation of the pulmonary artery catheter and visual confirmation of a successful wedge. Vascular pressures were referenced to atmospheric pressure via uniflow pressure transducers (Baxter Healthcare Corporation) zeroed 5 cm below the sternal angle and connected to a pressure-monitoring system (Dialogue 2000, IBC-Danica, Copenhagen, Denmark).
Protocol
During normothermic data collection, 34°C water was perfused through the suit. After baseline data collection, LBNP was engaged at 15 mmHg and then immediately followed by 30 mmHg. These levels of LBNP were selected because of intolerance at higher levels of LBNP while subjects are heat stressed (Wilson et al. 2006; Keller et al. 2009). Because of varying times required to obtain adequate PCWP waveforms and to perform multiple thermodilution CO between subjects, the duration of LBNP per stage (i.e. 15 and 30 mmHg) varied from subject to subject, with the typical duration being ∼15 min per LBNP stage. Following completion of normothermic data collection, LBNP was turned off and a recovery period ensued. Thereafter whole-body heating was established by perfusing 46–48°C water through the tube-lined suit until pulmonary artery blood temperature increased ∼1.0°C (typically after 30–45 min), upon which the water temperature was slightly reduced to attenuate further increases in body temperature during the ensuing data collection period. Baseline heat stress data were obtained, followed by data collection during 15 and 30 mmHg LBNP as previously described. After the heat stress plus LBNP protocol was completed, 500 ml of colloid (HES 130/0.4, Voluven, Fresenius Kabi) was infused, immediately followed by saline infusion sufficient to establish a total infused volume of 12 ml kg−1, typically in less than 10 min. The infused solutions were heated to 38°C to avoid influencing body temperature. The percentage change in plasma volume due to volume infusion was estimated from calculated haematocrit and haemoglobin (Radiometer ABL700, Denmark) of arterial blood samples (Dill & Costill, 1974; Greenleaf et al. 1979). Baseline data and data at 15 and 30 mmHg LBNP were again obtained, while body temperature was maintained with continuous heating by the suit.
Data analysis
Pressure and temperature data were acquired at a minimum of 50 Hz throughout experimental procedures (Biopac, Santa Barbara, CA, USA). The SV was calculated from CO and heart rate, and to express the load on the heart, stroke work was calculated by the product of SV and mean arterial pressure (MAP) and cardiac minute work by the product of cardiac output and MAP. Mean body temperature was expressed as: 0.9(Blood temperature) + 0.1(Mean skin temperature).
Statistics
To compare changes in variables among the three conditions (normothermia, heating and heating with volume infusion) and across LBNP, data were analysed via a mixed model ANOVA for repeated measures. If a significant main effect or interaction was identified, post hoc analyses were performed. Changes in SV relative to CVP and PCWP during LBNP were assessed with linear regression analyses between conditions. Data analysis was conducted with SAS 9.1 (SAS Institute Inc., Cary, NC, USA) with P < 0.05 considered to be statistically significant. Results are reported as means ±s.d.
Results
Baseline data
Before heating and application of LBNP, blood, mean skin, and mean body temperatures were 36.6 ± 0.3, 35.0 ± 0.2 and 36.5 ± 0.2°C, respectively (Table 1). Whole-body heating increased mean skin temperature by 2.6 ± 0.2°C and blood temperature by 1.1 ± 0.1°C, corresponding to an increase in mean body temperature by 1.3 ± 0.1°C. Subsequent volume infusion increased plasma volume by 18 ± 5%. Upon the end of the infusion, skin temperature was unchanged (P= 0.72), while blood and mean body temperatures both further increased another 0.2 ± 0.1°C (P < 0.0001). Compared to normothermia, heating reduced MAP, CVP and PCWP, and increased systemic vascular conductance. The CO also increased because of an elevated heart rate, as SV was unchanged. Subsequent volume loading did not change MAP or heart rate, while increasing PCWP, CVP, CO, SV and systemic vascular conductance. Consequently, both stroke and cardiac work increased during heating and further increased with subsequent volume loading (see Table 1).
Table 1.
Thermal and haemodynamic variables prior to the application of lower-body negative pressure during normothermia, whole-body heating and whole-body heating with volume loading
| Normothermia | Whole-body heating | Whole-body heating with volume loading | |
|---|---|---|---|
| Blood temperature (°C) | 36.6 ± 0.3 | 37.7 ± 0.4* | 37.9 ± 0.4*† |
| Mean body temperature (°C) | 36.5 ± 0.2 | 37.7 ± 0.4* | 37.9 ± 0.4*† |
| Mean arterial pressure (mmHg) | 91 ± 7.6 | 79 ± 7.8* | 80 ± 6.6* |
| Pulmonary capillary wedge pressure (mmHg) | 9.8 ± 1.5 | 6.7 ± 2.3* | 12.3 ± 3.3*† |
| Central venous pressure (mmHg) | 6.0 ± 2.2 | 3.1 ± 2.3* | 5.0 ± 2.7† |
| Cardiac output (l min−1) | 6.4 ± 0.9 | 10.9 ± 2.2* | 13.8 ± 2.4*† |
| Stroke volume (ml) | 110 ± 19 | 122 ± 30 | 143 ± 29*† |
| Heart rate (beats min−1) | 60 ± 11 | 91 ± 14* | 98 ± 11* |
| Systemic vascular conductance (ml min−1 mmHg−1) | 76 ± 11 | 144 ± 31* | 184 ± 33*† |
| Stroke work (mmHg ml) | 10003 ± 2125 | 9672 ± 2438 | 11410 ± 2641*† |
| Cardiac minute work (mmHg l min−1) | 587 ± 104 | 871 ± 199* | 1103 ± 230*† |
Difference from normothermia (P < 0.05),
difference between whole-body heating and whole-body heating with volume loading (P < 0.05). Values are mean ±s.d.
Effect of LBNP
No subject exhibited syncopal symptoms during normothermic LBNP, but four developed such symptoms during 30 mmHg LBNP while heat stressed. However, data collection was complete prior to cessation of LBNP in these subjects. In one subject we were unable to obtain PCWP during heat stress and heat stress plus 15 mmHg LBNP. Because under heat-stress conditions (in the absence of volume infusion) changes in PCWP are tracked by changes in CVP (Wilson et al. 2007), for this missing data point, the change in PCWP was estimated from the change in CVP. Nevertheless, if these values were excluded from the analysis, the statistical outcome and associated interpretation outlined below are unchanged. After volume infusion no subject experienced syncopal symptoms during LBNP when heated.
While the reduction in SV to 30 mmHg LBNP when subjects were heat stressed (57 ± 20 ml) was greater relative to when subjects were normothermic (36 ± 18 ml; P= 0.04 for paired comparison), this was not observed when inclusive of the SV decrease to 30 LBNP following volume infusion (51 ± 23 ml; P= 0.41 for main effect of the ANOVA). Nevertheless, since SV was elevated by volume infusion (see Table 1), at 30 mmHg LBNP absolute SV (91 ± 29 ml) was greater when compared to SV during heat stress alone at 30 mmHg LBNP (65 ± 27 ml; P < 0.001). The reduction in PCWP to LBNP was different between the three conditions (normothermia, heat stress, and heat stress with volume loading; P < 0.001), while reduction in CVP to LBNP was not (P= 0.07). Consequently the change in PCWP and CVP did not track each other across the three conditions during LBNP.
During all three conditions, application of LBNP reduced CVP, PCWP, CO, SV, systemic vascular conductance and MAP, while heart rate (HR) increased (all P < 0.05). The increase in HR to 30 mmHg LBNP while subjects were normothermic (8 ± 9 beats min−1) was not different relative to LBNP while subjects were heat stressed following volume infusion (9 ± 7 beats min−1). However, both of these values were less than the increase in HR during 30 mmHg LBNP with heat stress alone (30 ± 13 beats min−1; P < 0.001). During whole-body heating alone, the decrease in SV relative to the reduction in PCWP was greater (8.6 ± 3.9 ml mmHg−1) compared to normothermia (4.5 ± 3.0 ml mmHg−1, P= 0.02), suggesting that the operating point on Frank–Starling curves moved to a steeper location with heat stress (Fig. 1). Following volume infusion, however, this value (4.8 ± 2.3 ml mmHg−1) was not different from that established during normothermia (P= 0.78). These findings, coupled with visual inspection of Fig. 1, suggest that volume infusion moved the operating point to a flatter portion of the same Frank–Starling curve relative to heat stress alone.
Figure 1. Effects of heat-stress on Frank–Starling curves by expressing the relation between CVP (upper panel) and PCWP (lower panel) to SV during normothermia, heat stress, and heat stress plus volume infusion.
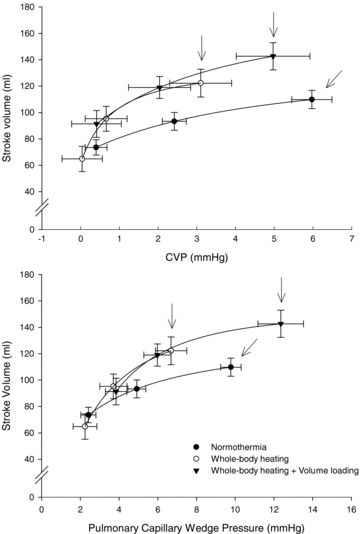
Data were obtained prior to LBNP and subsequent 15 and 30 mmHg LBNP for each of the indicated conditions. The arrows indicate pre-LBNP responses (i.e. operating point) for each thermal condition. The operating point is the prevailing PCWP, CVP and SV prior to the onset of LBNP. Lines represent fitted approximations.
Because of the differing responses between PCWP and CVP to LBNP following volume infusion, the relation between the reductions in SV relative to the reductions in CVP was also analysed. This analysis revealed a similar pattern to that observed for the SV to PCWP relation; that is the reduction in SV related to the reduction in CVP was larger during heat stress compared to normothermia, and volume infusion normalized the heat stress response relative to normothermic (Fig. 1).
Discussion
Reduction in central blood volume induced by LBNP during heat stress conditions caused larger decreases in SV and cardiac output (data not shown) for a given decrease in CVP or PCWP compared to normothermic conditions. This observation confirms the prior hypothesis that heat stress shifts the operating point to a steep portion of a different Frank–Starling curve relative to normothermia (Wilson et al. 2009). Unique to this investigation, subsequent volume loading during whole-body heating shifted the operating point to a flatter portion of the heat stress Frank–Starling curve, resulting in similar reductions in SV for a given reduction in CVP or PCWP compared to normothermia. The clinical manifestations of these effects were that pre-syncopal symptoms experienced during LBNP-induced reductions in central blood volume while heat stressed were eliminated with volume loading.
The Frank–Starling curve describes the relation between fibre length and the heart's ability to produce force, indexed by its filling pressures (Sarnoff & Mitchell, 1961). Consequently, CVP provides an index of mechanical loading of the right ventricle while PCWP provides this index for the left ventricle. Under heat stress conditions these two pressures track each other, even during LBNP (Wilson et al. 2007). However, after volume infusion this relation was altered since the increase in PCWP was greater than the increase in CVP (see Table 1). Nevertheless, a similar response was observed when relating the reduction in SV to PCWP or to CVP during LBNP between the three conditions (Fig. 1).
LBNP redistributes blood from the thoracic region to the lower body, which simulates changes that occur during a haemorrhagic challenge (Cooke et al. 2004). Consequently, central blood volume (Cai et al. 2000), filling pressures (Van Lieshout et al. 2005) and volume of the heart (Jans et al. 2008; Bundgaard-Nielsen et al. 2009) are reduced resulting in decreases in SV and CO by LBNP. Conversely, head-down tilt increases these indices of cardiac filling but without increasing SV or CO (Harms et al. 2003; Van Lieshout et al. 2005; Truijen et al. 2010). Thus, in the normothermic supine human the operating point on a Frank–Starling curve is close to the plateau portion of that curve (Harms et al. 2003; Wilson et al. 2009) such that further increases in cardiac preload do not appreciably increase SV. In contrast, during heat stress subsequent volume loading increases PCWP, SV and consequently CO. Based upon this observation, while heat stressed in the supine position, the location of the operating point is on the steep part of a Frank–Starling curve. To further assess the location of the operating points of the curves for the evaluated conditions (i.e. normothermia, heat stress, and heat stress plus volume infusion), preload was manipulated by the application of LBNP. When relating the reduction in SV to the reduction in PCWP, this value was approximately twofold greater during whole-body heating compared to normothermia. Importantly, subsequent volume loading caused this value to return to that observed during normothermia. A likely scenario ensuing from these observations is that heat stress increases cardiac systolic function, as we and others have shown (Brothers et al. 2009; Nelson et al. 2010), resulting in a corresponding leftward shift in the Frank–Starling curve, coupled with a shift in the operating point on that curve to a steeper location. Such a shift is probably related to the ‘hyperadrenergic state’ of the heat stress (Rowell, 1990). Subsequent volume loading probably shifted the operating point on this same heat stress Frank–Starling curve from the steep location mentioned above to a relative plateau on this curve (see Fig. 1). This shift in the operating point resulted in a smaller reduction in SV for a given reduction in PCWP, and thus preserved CO and consequently blood pressure during this simulated haemorrhagic challenge.
An alternative explanation for the findings may be related to the reductions in arterial pressure associated with heat stress. Such a reduction in blood pressure, along with increases in systemic vascular conductance, would reduce afterload with a resultant similar leftward shift in the Frank–Starling curve relative to the shift that would occur with increases in systolic cardiac function. Nevertheless, prior findings that heat stress increases cardiac systolic function (Brothers et al. 2009; Nelson et al. 2010) suggest that the shifting of the Frank–Starling curve by heat stress is perhaps due to a combination of increased contractility coupled with reduced afterload.
To regulate body temperature, heat stress increases vascular conductance and blood volume in cutaneous vessels (Deschamps & Magder, 1990; Johnson & Proppe, 1996) and consequently central blood volume is reduced (Crandall et al. 2008). In addition, blood volume is reduced secondarily to sweating. It is through a combination of these mechanisms that heating reduces preload to the heart, which was evident by decreases in PCWP (Table 1). During LBNP, the control of cutaneous vascular conductance becomes vital towards the regulation of perfusion pressure sufficient to adequately perfuse the cerebral vasculature. If during such a hypotensive challenge the blood in the skin was to be redistributed to the central circulation, then central blood volume and PCWP would increase (similar to what occurred with volume infusion) thereby preserving SV and thus arterial blood pressure sufficient to maintain cerebral perfusion. That said, we and others have shown that heat stress severely compromises the control of arterial blood pressure during hypotensive challenges such as LBNP (Wilson et al. 2006; Keller et al. 2009). This was also apparent in the present study in that four subjects developed syncopal symptoms during 30 mmHg LBNP while heat stressed, but none did while normothermic or after volume infusion. A hypothesis resulting from these observations may be as follows. First, heat stress increases cutaneous blood volume to the detriment of central blood volume; secondly, during a hypotensive challenge incurred by perturbations such as orthostasis, haemorrhage, or LBNP there is inadequate cutaneous vasoconstriction to redistribute that blood back to the central circulation thereby compromising SV, CO and thus arterial blood pressure; third, if sufficient volume is added to the central circulation exogenously (e.g. via intravascular infusion), then despite a large cutaneous blood volume the reduction in SV, CO and arterial blood pressure during the above-mentioned challenges are minimized resulting in adequate perfusion of the brain thereby forestalling the onset of syncopal symptoms.
Appropriate mean values of SV (110 ml) and CO (6.4 l min−1) were observed when subjects were normothermic. Heating alone increased CO to 10.9 l min−1 without appreciably changing SV. Although these SV and CO values during heat stress may seem adequate to protect arterial blood pressure, this is not the case given large reductions in arterial pressure and corresponding greater incidence of orthostatic intolerance during gravitational challenges (such as LBNP) while heat stressed (Wilson et al. 2006; Keller et al. 2009). Subsequent volume loading increased SV to 143 ml and CO to 13.8 l min−1, respectively. The clinical relevance of these findings is that interventions such as anaesthesia and medication, and illnesses such as sepsis and liver disease that, like heat stress, induce vasodilatation, have the potential to adversely affect the control of blood pressure despite elevated CO. This may occur in part through altering the location of the operating point on any one of a family of Frank–Starling curves to a steeper location on that particular curve. Therefore, under such clinical conditions appropriate control of the central blood volume would be advantageous and directional trends in SV and CO upon an intravascular volume loading may be of more importance than the absolute values.
Limitations
Application of the interventions was not performed in a randomized order. This design was selected because a randomized approach would require a 3 day study and would thereby increase the risk to the subject of having the right heart catheter remain in place for 3 days or by having catheters inserted three different times. However, given the improvements observed after volume infusion, despite further increases in internal temperature relative to heat stress alone (Table 1), it is unlikely that the absence of a randomized approach adversely affected the interpretation of the data.
In summary, these data demonstrated that heat stress shifts the operating point to a steeper portion of a different Frank–Starling curve, relative to normothermia, where small reductions in PCWP result in large reductions in SV. Subsequent volume-loading moves the operating point to a flatter portion of the heat stress Frank–Starling curve where comparable reductions in PCWP result in smaller reductions in SV, relative to heat stress alone. These findings suggest that improved blood pressure control, identified via preserved tolerance to LBNP of heat-stressed individuals, following blood volume expansion reflects a shift of the operating point to a flat portion of the heat stress Frank–Starling curve, thereby preserving SV and thus CO.
Acknowledgments
This research project was funded in part by grants from the National Heart, Lung, and Blood Institute (C.G.C.: HL-61388, HL-67422, and HL-84072), Aase & Ejnar Danielsens Foundation (N.H.S.) and Jeppe Juhl & hustrus Foundation (M.B.-N.). Experiments were carried out at the anesthetic department, Rigshospitalet, University of Copenhagen, Denmark.
Glossary
Abbreviations
- CO
cardiac output
- CVP
central venous pressure
- LBNP
lower-body negative pressure
- MAP
mean arterial pressure
- PCWP
pulmonary capillary wedge pressure
- SV
stroke volume
Author contributions
M.B.-N.: collection, analysis and interpretation of the data; drafting the article or revising it critically for important intellectual content. T.E.W.: conception and design of the experiments; collection, analysis and interpretation of data; drafting the article or revising it critically for important intellectual content. T.S.: collection, analysis and interpretation of data; drafting the article or revising it critically for important intellectual content; N.H.S.: conception and design of the experiments; collection, analysis and interpretation of data; drafting the article or revising it critically for important intellectual content. C.G.C.: conception and design of the experiments; collection, analysis and interpretation of data; drafting the article or revising it critically for important intellectual content. All authors approved the final version of the manuscript.
References
- Brothers RM, Bhella PS, Shibata S, Wingo JE, Levine BD, Crandall CG. Cardiac systolic and diastolic function during whole body heat stress. Am J Physiol Heart Circ Physiol. 2009;296:H1150–H1156. doi: 10.1152/ajpheart.01069.2008. [DOI] [PMC free article] [PubMed] [Google Scholar]
- Bundgaard-Nielsen M, Sorensen H, Dalsgaard M, Rasmussen P, Secher NH. Relationship between stroke volume, cardiac output and filling of the heart during tilt. Acta Anaesthesiol Scand. 2009;53:1314–1328. doi: 10.1111/j.1399-6576.2009.02062.x. [DOI] [PubMed] [Google Scholar]
- Cai Y, Holm S, Jenstrup M, Stromstad M, Eigtved A, Warberg J, Hojgaard L, Friberg L, Secher NH. Electrical admittance for filling of the heart during lower body negative pressure in humans. J Appl Physiol. 2000;89:1569–1576. doi: 10.1152/jappl.2000.89.4.1569. [DOI] [PubMed] [Google Scholar]
- Cooke WH, Ryan KL, Convertino VA. Lower body negative pressure as a model to study progression to acute hemorrhagic shock in humans. J Appl Physiol. 2004;96:1249–1261. doi: 10.1152/japplphysiol.01155.2003. [DOI] [PubMed] [Google Scholar]
- Crandall CG, Wilson TE, Marving J, Vogelsang TW, Kjaer A, Hesse B, Secher NH. Effects of passive heating on central blood volume and ventricular dimensions in humans. J Physiol. 2008;586:293–301. doi: 10.1113/jphysiol.2007.143057. [DOI] [PMC free article] [PubMed] [Google Scholar]
- Deschamps A, Magder S. Skin vascular bed is a potential blood reservoir during heat stress. Am J Physiol Heart Circ Physiol. 1990;259:H1796–H1802. doi: 10.1152/ajpheart.1990.259.6.H1796. [DOI] [PubMed] [Google Scholar]
- Dill DB, Costill DL. Calculation of percentage changes in volumes of blood, plasma, and red cells in dehydration. J Appl Physiol. 1974;37:247–248. doi: 10.1152/jappl.1974.37.2.247. [DOI] [PubMed] [Google Scholar]
- Greenleaf JE, Convertino VA, Mangseth GR. Plasma volume during stress in man: osmolality and red cell volume. J Appl Physiol. 1979;47:1031–1038. doi: 10.1152/jappl.1979.47.5.1031. [DOI] [PubMed] [Google Scholar]
- Harms MP, Van Lieshout JJ, Jenstrup M, Pott F, Secher NH. Postural effects on cardiac output and mixed venous oxygen saturation in humans. Exp Physiol. 2003;88:611–616. doi: 10.1113/eph8802580. [DOI] [PubMed] [Google Scholar]
- Jans O, Tollund C, Bundgaard-Nielsen M, Selmer C, Warberg J, Secher NH. Goal-directed fluid therapy: stroke volume optimisation and cardiac dimensions in supine healthy humans. Acta Anaesthesiol Scand. 2008;52:536–540. doi: 10.1111/j.1399-6576.2008.01585.x. [DOI] [PubMed] [Google Scholar]
- Johnson J, Proppe DW. Cardiovascular adjustments to heat stress. In: Fregly MJ, Blatteis CM, editors. Handbook of Physiology. New York: Oxford University Press; 1996. pp. 215–243. [Google Scholar]
- Keller DM, Low DA, Wingo JE, Brothers RM, Hastings J, Davis SL, Crandall CG. Acute volume expansion preserves orthostatic tolerance during whole-body heat stress in humans. J Physiol. 2009;587:1131–1139. doi: 10.1113/jphysiol.2008.165118. [DOI] [PMC free article] [PubMed] [Google Scholar]
- Levine BD. Regulation of central blood volume and cardiac filling in endurance athletes: the Frank-Starling mechanism as a determinant of orthostatic tolerance. Med Sci Sports Exerc. 1993;25:727–732. [PubMed] [Google Scholar]
- Nelson MD, Haykowsky MJ, Petersen SR, DeLorey DS, Cheng-Baron J, Thompson RB. Increased left ventricular twist, untwisting rates, and suction maintain global diastolic function during passive heat stress in humans. Am J Physiol Heart Circ Physiol. 2010;298:H930–H937. doi: 10.1152/ajpheart.00987.2009. [DOI] [PubMed] [Google Scholar]
- Patterson SW, Piper H, Starling EH. The regulation of the heart beat. J Physiol. 1914;48:465–513. doi: 10.1113/jphysiol.1914.sp001676. [DOI] [PMC free article] [PubMed] [Google Scholar]
- Patterson SW, Starling EH. On the mechanical factors which determine the output of the ventricles. J Physiol. 1914;48:357–379. doi: 10.1113/jphysiol.1914.sp001669. [DOI] [PMC free article] [PubMed] [Google Scholar]
- Rowell LB. Hyperthermia: a hyperadrenergic state. Hypertension. 1990;15:505–507. doi: 10.1161/01.hyp.15.5.505. [DOI] [PubMed] [Google Scholar]
- Rowell LB, Brengelmann GL, Murray JA. Cardiovascular responses to sustained high skin temperature in resting man. J Appl Physiol. 1969;27:673–680. doi: 10.1152/jappl.1969.27.5.673. [DOI] [PubMed] [Google Scholar]
- Sarnoff S, Mitchell JH. The regulation of the performance of the heart. Am J Med. 1961;30:747–771. doi: 10.1016/0002-9343(61)90211-x. [DOI] [PubMed] [Google Scholar]
- Swan HJ, Ganz W, Forrester J, Marcus H, Diamond G, Chonette D. Catheterization of the heart in man with use of a flow-directed balloon-tipped catheter. N Engl J Med. 1970;283:447–451. doi: 10.1056/NEJM197008272830902. [DOI] [PubMed] [Google Scholar]
- Taylor WF, Johnson JM, Kosiba WA, Kwan CM. Cutaneous vascular responses to isometric handgrip exercise. J Appl Physiol. 1989;66:1586–1592. doi: 10.1152/jappl.1989.66.4.1586. [DOI] [PubMed] [Google Scholar]
- Truijen J, Bundgaard-Nielsen M, Van Lieshout JJ. A definition of normovolaemia and consequences for cardiovascular control during orthostatic and environmental stress. Eur J Appl Physiol. 2010;109:141–157. doi: 10.1007/s00421-009-1346-5. [DOI] [PMC free article] [PubMed] [Google Scholar]
- Van Lieshout JJ, Harms MPM, Pott F, Jenstrup M, Secher NH. Stroke volume of the heart and thoracic fluid content during head-up and head-down tilt in humans. Acta Anaesthesiol Scand. 2005;49:1287–1292. doi: 10.1111/j.1399-6576.2005.00841.x. [DOI] [PubMed] [Google Scholar]
- Wilson TE, Brothers RM, Tollund C, Dawson EA, Nissen P, Yoshiga CC, Jons C, Secher NH, Crandall CG. Effect of thermal stress on Frank-Starling relations in humans. J Physiol. 2009;587:3383–3392. doi: 10.1113/jphysiol.2009.170381. [DOI] [PMC free article] [PubMed] [Google Scholar]
- Wilson TE, Cui J, Zhang R, Crandall CG. Heat stress reduces cerebral blood velocity and markedly impairs orthostatic tolerance in humans. Am J Physiol Regul Integr Comp Physiol. 2006;291:R1443–R1448. doi: 10.1152/ajpregu.00712.2005. [DOI] [PMC free article] [PubMed] [Google Scholar]
- Wilson TE, Tollund C, Yoshiga CC, Dawson EA, Nissen P, Secher NH, Crandall CG. Effects of heat and cold stress on central vascular pressure relationships during orthostasis in humans. J Physiol. 2007;585:279–285. doi: 10.1113/jphysiol.2007.137901. [DOI] [PMC free article] [PubMed] [Google Scholar]