Abstract
We present a further improvement of our SLO/OCT imaging system which enables to practically eliminate all eye motion artifacts with a correction accuracy approaching sub-cellular dimensions. Axial eye tracking is achieved by using a hardware based, high speed tracking system that consists of a rapid scanning optical delay line in the reference arm of the interferometer. A software based algorithm is employed to correct for transverse eye motion in a post-processing step. The instrument operates at a frame rate of 40 en-face fps with a field of view of ~1°×1°. Dynamic focusing enables the recording of 3D volumes of the human retina with cellular resolution throughout the entire imaging depth. Several volumes are stitched together to increase the total field of view. Different features of the three dimensional structure of cone photoreceptors are investigated in detail and at different eccentricities from the fovea.
1. Introduction
In the recent years optical coherence tomography (OCT) has evolved into an important retinal imaging technique [1-3]. Many papers have been published so far that demonstrated the clinical value of this technique [4-7]. However, imaging the retina on a cellular level is still challenging because of two reasons. First, imperfections of the optics of the eye will introduce aberrations to the imaging beam and will therefore degrade the resolution of retinal images in the majority of subjects. It has been shown that with the implementation of adaptive optics (AO) these aberrations can be compensated in many subjects, yielding a nearly diffraction limited image resolution [8-12]. Second, at the high magnification needed to resolve individual cells, subject and/or eye motion is very pronounced and can therefore be a severe problem. While scanning laser ophthalmoscope (SLO) and flood illumination systems are capable to record two dimensional images rapidly to minimize these artifacts, the 3D imaging speed of conventional OCT systems is rather limited (even with the use of high speed cameras that provide scan rates of ~200000 A-scans per second) [13-15].
To overcome the problem with aberrations introduced by imperfect eye optics we investigated in this study only retinal images of healthy volunteers with good eye optics. Several groups have demonstrated that in these special cases individual cone photoreceptors can be resolved within OCT images in vivo without the use of AO [13, 15-17]. Furthermore we address the problem of eye motion artifacts by minimizing them using a high speed transverse scanning OCT/SLO (TS-OCT/SLO) system that incorporates a fast axial eye motion correction device and a software based transverse eye motion correction algorithm.
In this paper we report on improvements of our instrument in terms of minimizing eye motion artifacts (axial and transverse). This motion correction approaches, what we believe for the first time, sub-cellular accuracy. The improved instrument enables to record several adjacent patches of the retina with cellular resolution throughout imaging depth and stitching of 3D data sets to generate large field of view images with cellular resolution. Finally we measure the cone density at different eccentricities from the fovea for several subjects, identify new features within the cone outer segments and present, what we believe for the first time, measurements of the density of these features.
2. Method
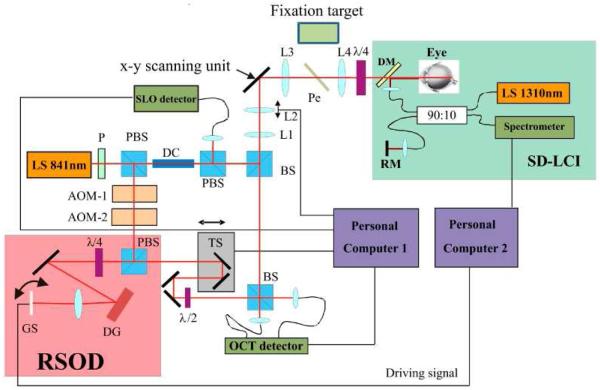
The basic principle of the system has been published elsewhere [17-19]. However we want to emphasize here some new key features of the instrument. Figure 1 shows a scheme of the experimental setup. The system is based on time domain (TD) transverse scanning OCT and consists of three major parts. The main Mach Zehnder interferometer, an auxiliary spectral domain low coherence interferometer (SD-LCI) operating at 1300nm and a rapid scanning optical delay line (RSOD) located in the reference arm of the main interferometer. The main interferometer is designed to record simultaneously SLO and OCT images of the human retina in vivo with cellular resolution. We lately implemented a high speed depth tracking device into our instrument in order to minimize axial eye motion artifacts [19]. This procedure is essential for 3D measurements with a TS-OCT instrument. For that purpose the position of the apex of the cornea is measured with the auxiliary SD-LCI system. To minimize influences of transverse eye motion on the measured apex position a collimated beam incident on the cornea is essential [17, 20]. The measured position of the corneal apex is used to drive a RSOD in the reference arm of the main interferometer in order to adapt the group delay in the reference arm to match the measured position of the eye. The RSOD consists of a grating, a lens and a fast galvo scanner [21]. The galvo scanner is positioned in a way that the light beam exactly illuminates the scanner pivot point in order to generate with the RSOD only a group delay (no additional phase modulation is introduced by the RSOD). The implementation of the RSOD represents an important improvement compared to our previous system whose performance was limited by the inertia of the translation stage that was used for depth tracking. SD-LCI signal recording and evaluation is implemented on a computer operating in ©Labview-Realtime (National Instruments) to ensure undisturbed performance of the depth tracking. The accuracy of the new device and the increased high loop speed of 1kHz enables the reduction of the residual tracking error below the axial resolution of the OCT system (<5μm) which is 2 to 4 times better than with our previously reported instrument [17].
Fig. 1.
Scheme of the SLO/OCT instrument. RSOD rapid scanning optical delay line, SD-LCI spectral domain low coherence interferometer, LS light source, P polarizer, DC dispersion compensation glass rods, BS beam splitter, L1-L4 lenses (L1 f = 50mm, L2 f = 20mm, L3 f = 40mm, L4 f = 80mm), AOM acousto optic modulator, TS translation stage, PBS polarizing beam splitter, DM dichroic mirror, RM reference mirror, DG diffraction grating, Pe Pellicle, GS galvo scanner, x-y scanning unit consists of a resonant scanner and a galvo scanner. (Imaging optics between the two scanning mirrors are omitted for clarity)
In order to improve the signal intensity in the SLO channel we slightly changed the configuration of the main interferometer in the following way. The incident light is linear polarized by a polarizer. The light traverses a polarizing beam splitter and is split into sample and reference beam. By rotation of the polarizer the splitting ratio of the light at the polarizing beam splitter can be adjusted in order to achieve 700μW incident on the cornea. In the sample arm the light traverses an additional polarizing beam splitter, a non polarizing beam splitter and is directed via telescope optics to the scanners and finally to the eye. In this configuration the pivot points of both scanners are imaged into the pupil plane of the eye. The second lens (L2 in Fig. 1) is mounted on a translation stage which enables the adjustment of the focus and dynamic focusing during the 3D measurements [18]. A quarter wave plate oriented at 45 degrees with respect to the incident polarization state is placed after the final lens in the sample arm (L4 in Fig. 1) which resembles together with the second PBS a bulk optics circulator. This ensures that 50 percent of the light returning from the retina is directed to the SLO detector (assuming negligible birefringence of the sample). The rest of the light is collected by the OCT detectors. A pellicle beam splitter (more than 90% of the light is transmitted) is placed between the lenses L3 and L4 which allows the measured subject to fixate on variable patterns on the fixation target (FT). The FT itself consists of an organic light emitting diode (OLED) display. Note that the measured eye is used for fixation which is essential to minimize transverse eye motion.
In the reference arm the light beam traverses two acousto optic modulators in order to generate a net frequency shift of 1MHz (carrier frequency) and is directed via a polarizing beam splitter and a quarter wave plate (equivalent to a bulk optics circulator) to the RSOD. The light returning from the RSOD is directed to a translation stage for depth scanning and a half wave plate in order to rotate the polarization plane by 90 degrees to match the polarization plane returning from the sample arm. Reference light and sample light are combined at the final beam splitter of the interferometer. Both interferometer exits are used which provides balanced detection. Currently the imaging speed is 40 frames (650 (×) × 200 (y) pixels) per second, covering an area of ~300 × 300μm2 on the retina. The axial resolution of the OCT is given by the bandwidth of the used light source (λ0 = 840nm, Δλ = 50nm) and is estimated with ~5μm in retinal tissue (assuming a refractive index of 1.4 within the retina). The diffraction limited lateral resolution of the system was estimated with 5μm.
3. Imaging protocol and post processing
The total recording time of one measurement was 3 seconds and consisted of 120 frames (~1°×1°, 700μm or 200μm in depth). The simultaneously recorded SLO images were used to correct for transverse eye motion. Our previous procedure [17] used plugins available from Image J for this purpose. However, in this software each frame was aligned to the previous frame which resulted in an unpredictable residual drift between frames, finally leading to blurred averaged frames (throughout imaging depth). Moreover, in the case of larger in frame motion artifacts the software frequently failed. Therefore, we developed a new software that is based on a calculation of the cross-correlation between individual frames. In a first step each recorded frame of a SLO stack is aligned to a reference frame and all SLO frames were averaged.
This averaged frame was used in a second alignment step as new reference frame to minimize any influences (e.g. slight distortions) of the first reference frame. The obtained translation matrix of this procedure was used to correct the OCT images (They have a pixel to pixel correspondence with the SLO images). Together with the axial eye tracking this transverse motion correction algorithm resulted in nearly motion artifact free 3D volumes of the retina. Moreover, because of the unique pattern of the cone mosaic 3D volumes recorded at different times could be aligned to each other with an accuracy that is better than the lateral extension of a single cone. This feature was used to further minimize errors (e.g. differing light coupling ratio into cone photoreceptors, residual depth tracking error) by recording for each eccentricity 5 data sets that were aligned to each other and averaged. Data was recorded at 8 different eccentricities from the fovea.
5 healthy, Caucasian volunteers (mean age, 32 ± 10 (SD) years) without any detectable ocular disease or history of an ocular disease were selected. The investigations were performed according to a protocol that adhered to the tenets of the Declaration of Helsinki and were approved by the ethics committee of the Medical University of Vienna. Informed consent was obtained from each volunteer prior to the measurements. A routine eye examination including visual acuity testing was performed before the measurement with the TS-OCT system. All eyes were rated as normal, with a spherical refractive error below 2 dpt. and a cylindrical refractive error below 0.5 dpt. Only the left eye of each volunteer was investigated. No pupil dilation was used in all measurements. The subjects were asked to fixate on a target in infinity. Therefore fixation can be achieved with a relaxed eye and accommodation effects that could cause a change in axial eye length [22] and thereby disturb the axial eye motion correction should not play a role (i.e. eye length changes should be kept below a few μm [22]).
4. Results
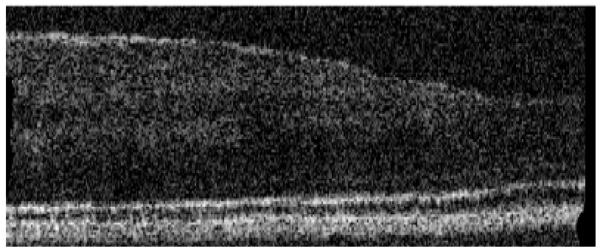
To demonstrate the performance of the system in terms of axial eye motion correction we recorded eight adjacent 3D data sets of the entire retinal depth with increasing eccentricities from the fovea (step size 0.5°). The eight data sets have been stitched together to cover an area of ~5°×1°. Figure 2 shows a “fly through” movie from the anterior part of the retina to the posterior part and Fig. 3 the corresponding B-scan “fly through” movie of the same data set. Note that the dynamic focus ensures that the entire depth of the retina is in focus. As the first movie starts, individual nerve fiber bundles within the nerve fiber layer can be observed. As the coherence plane is moved further into tissue, small capillaries in the ganglion cell layer as well as at the top and bottom of the inner nuclear layer can be seen. Deeper into the tissue the external limiting membrane (faint signal) is followed by the junction between inner and outer segments of photoreceptors and the end tips of photoreceptors. Both layers show the cone mosaic. The last layer visible in the movie is the retinal pigment epithelium. The B-scan movie shows the excellent performance of the system to correct for axial eye motion correction.
Fig. 2.
(Media 1) Frame number 65 of a movie retrieved from a 3D data set recorded with the instrument. The movie starts from the anterior part of the retina to the posterior part. Field of view: ~5°×1°. Imaging depth: ~393μm (in tissue). Images are represented in a logarithmic intensity scale.
Fig. 3.
(Media 2) Frame number 50 of a movie retrieved from the same data set as in Fig. 2. The movie starts from the inferior part of the retina to the superior part. Image size: 5° × 393μm (in tissue) Images are represented in a logarithmic intensity scale.
Note that due to the large field of view shown in the movie (with limited memory size) the resolution of the original data was reduced and without zooming into the original data set individual cone photoreceptors are rather hardly visible. A slight mismatch in axial direction can be observed between individual 3D data sets. This mismatch varies in y-direction and is caused by a slightly changing entrance pupil (vertical position) of the imaging beam from data set to data set. This mismatch might be compensated using an A-scan based correction algorithm on the final data set.
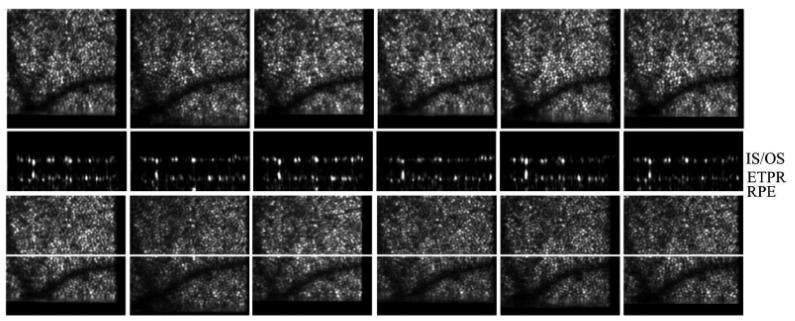
In a next step we use the instrument to investigate an interesting observation (i.e. bright reflections from within the outer segments of photoreceptors that are visible in 3D OCT data sets) in more detail. Five healthy volunteers with good eye optics participated in this study. Figure 4a) shows a full depth B-scan (1° scanning angle) reconstructed from a 3D data set to introduce the labeling of the different retinal layers used in this manuscript. As shown in Fig. 4b) and 4c) a similar cone mosaic can be observed at the inner/outer segments junction of cone photoreceptors (IS/OS) and at the end tips of photoreceptors (ETPR). However, isolated bright reflections (BRs) can be observed between these layers i.e. within the outer segments of cone photoreceptors (c.f. Figures 4c and 4e). This observation has been made earlier also by other groups in OCT B-scans [23, 24]. Note that at some of these locations no backscattering intensity can be observed within the ETPR layer (c.f. circles in Fig. 1d). To test the reproducibility of the system we recorded several volumes at the same location within 5 minutes. Figure 5 shows SLO, en-face z-projection OCT as well as representative B-scans of exactly the same location and demonstrates the good reproducibility of our technique.
Fig. 4.
Images of the human cone mosaic at ~4deg eccentricity. a) Overview B-scan image. ELM external limiting membrane, IS/OS junction between inner and outer segments of photoreceptors, OS outer segments photoreceptors, ETPR end tips photoreceptors, RPE retinal pigment epithelium. b) en-face image retrieved from the IS/OS junction, c) en-face image within OS (three bright reflection sites are marked with a circle), d) en-face image at ETPR, e) representative B-scan of the cone photoreceptors (bright reflection site is marked with a circle, a) is plotted in logarithmic scale, b) c) d) e) are plotted in a linear scale).
Fig. 5.
Measurement series of the same location on the retina recorded within 5 minutes. Upper row: SLO images, middle row: representative B-scan images (location marked with a white line in the lower rows). The bright layers within the B-scan images are (from top to bottom) IS/OS junction between inner and outer segments of photoreceptors, ETPR end tips of photoreceptors, RPE retinal pigment epithelium (hardly visible in the linear scale). Lower row: Over the whole imaging depth averaged en-face OCT images.
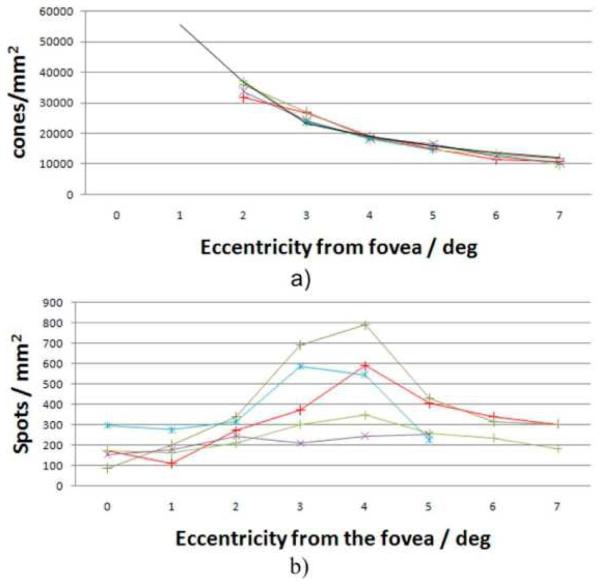
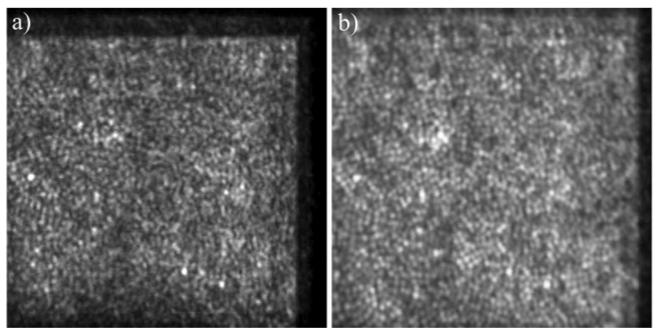
A good method to count the bright reflections (BR) would be to average all en-face images within the length of the OS (excluding IS/OS and ETPR layers) and to apply an intensity threshold on the resulting image. However, we found that this method does not take into account a varying cone outer segment length which can be observed at larger eccentricities from the fovea. Therefore we chose to count these BRs by an expert viewer who looked through all the reconstructed OCT B-scans for that purpose. With this procedure we measured the density of these reflection sites at different eccentricities from the fovea. Additionally we performed at each eccentricity a 2D Fourier transformation of all summated OCT en-face slices that show the cone mosaic to obtain Yellot's rings (YR) [25]. Figure 6 shows a movie of the calculated FFT's for volunteer 2. The movie starts at the foveal center and ends at an eccentricity of 7° with a spacing of 1° between individual frames. While in the first two frames no ring can be observed a decrease of the radius of the ring can be observed in the rest of the movie. The maximum of the ring corresponds to the spatial frequency of the cone rows or modal frequency of cone mosaic [26, 27]. This frequency has to be multiplied by a factor (1/cos 30°) to convert the modal frequency into closest neighbor spacing. Assuming a hexagonal arrangement of the cones and a conversion factor of 291 μm for 1 degree scanning angle we calculated the cone density for each eccentricity. Figure 7 shows the result of both measurements. As indicated in Fig. 7a) the cone mosaic could be resolved down to 2° eccentricity from the fovea even without the use of adaptive optics for four volunteers. Closer to the fovea the packing density of the cones is very high and therefore YRs could not be observed. The measured decrease of cone density is in excellent agreement with data known from histology [28] or AO-OCT [29]. The border of 2° eccentricity between resolvable cones and non resolvable cones is in excellent agreement with the theoretical resolution of the system (~5μm) and the expected row to row spacing of 5.5μm that is obtained from histology data at this eccentricity. To visualize the performance of the system Fig. 8 shows the cone mosaic at 2 degrees eccentricity in a comparison between SLO and OCT (integrated over the entire imaging depth). Note that on the right hand side of the images (closer to the fovea) the cones become hardly separated especially in the OCT image indicating the resolution limit of the system.
Fig. 6.
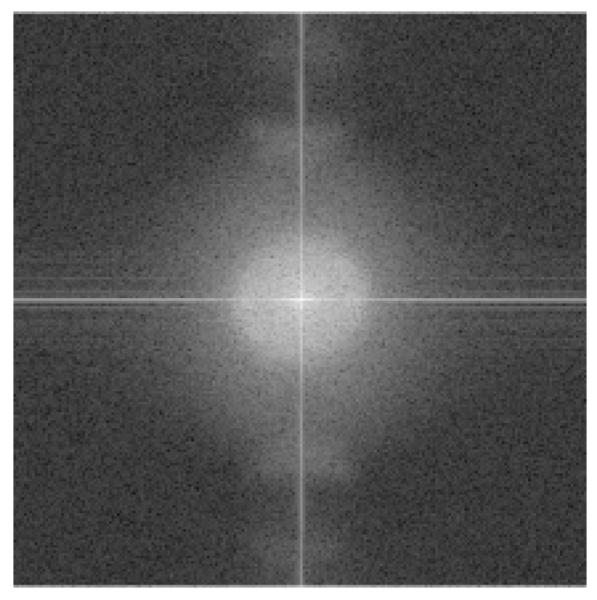
(Media 3) Frame No.3 (corresponding to 2° eccentricity) of a movie showing the calculated FFT's of the cone mosaic measured in volunteer 2.
Fig. 7.
a) Measured cone density of five volunteers at different eccentricities from the fovea (black line: data from Ref [27]. b) Measured bright reflections (BR) within the cone outer segments at different eccentricities (Each color corresponds to a different subject).
Fig. 8.
The cone mosaic imaged at 2 degrees eccentricity from the fovea. a) depth integrated OCT image, b) SLO image (field of view: ~1°×1°).
However, the measured density of the BRs follows a different dependence on the eccentricity from the fovea (c.f. Figure 7b). In four volunteers we observed an increase of BR with eccentricity with a maximum of BR density at ~4° eccentricity. At larger eccentricities this density decreases again. One volunteer showed almost constant BR density with eccentricity. We want to emphasize here that even though we are not able to resolve individual cones at eccentricities smaller than 2° it is still possible to count the BR's at these eccentricities provided that these are quite isolated (which is the case at larger eccentricities).
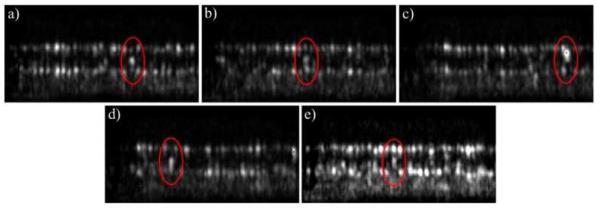
Although we counted every BR for the measurement above we observed differing arrangements of these spots with respect to the normal reflections from the IS/OS junction and ETPR layer. Figure 9 illustrates five different possibillities: a) Three distinct spots can be observed but the spot from within the outer segment has the highest intensity, b) Three distinct spots with equal intensity, c) only one highly reflecting spot, d) one spot within the outer segments, one within the ETPR layer, e) one spot within the IS/OS junction and one within the outer segments (no reflection from the ETPR).
Fig. 9.
Different arrangements of BR (marked with an ellipse) observed at 4° eccentricity (see text for explanation).
5. Discussion and conclusion
We introduced an improved version of our transverse scanning OCT/SLO system. With this technique nearly motion artifact free 3D volumes of the retina with cellular resolution throughout the entire imaging depth could be obtained. We showed the possibility to stitch several 3D data stacks together in order to enlarge the total field of view. With the new system we could overcome a limitation of all other currently used OCT techniques that suffer from both: transverse eye motion artifacts and limited depth of focus.
This allowed us to investigate the human cone mosaic of five volunteers in more detail. The measured cone density at different eccentricities from the fovea was found in excellent agreement with data known from histology and represents the first study of this kind using OCT without the use of adaptive optics. We want to emphasize here that a similar study was performed more than a decade ago with a SLO [30, 31]. However, in contrast to AO equipped systems the cone mosaic could only be observed down to two degrees eccentricity from the fovea because of the limited resolution of the system. Additionally we introduced, to the best of our knowledge for the first time, measurements of the density of bright reflections that can be observed in OCT images within the outer segments of cone photoreceptors. To minimize influences of differing light coupling efficiencies into the cone photoreceptors five 3D data sets were recorded and averaged. The BRs were categorized into five different appearances. Due to the different appearances of the BRs we can conclude that these BRs are not caused by multiple reflection between IS/OS and ETPR. (These should have a longer path and should appear at the level of the RPE or below). Although the origin of these bright reflections is, at this stage of investigation still unclear, one might speculate about their histological counterparts. Interestingly, a similar distribution as shown in Fig. 7b) can be found in histology for blue or S-cones [32]. These cones are also known to be shorter than the other (L and M) cones; however the difference should be in the order of only a few percent. Moreover, S-cones should have the maximum density closer to the fovea at ~1-2 degrees eccentricity. Therefore, the correlation with the S-cone distribution might be accidental. Another possibility might be that the BRs represent cone outer segments that underwent phagocytosis. In this case the depth position of the BRs should change over time. However, in a preliminary study we observed that the BRs density did not change within 48 hours [19].
Acknowledgement
Financial support from the Austrian Science Fund (FWF grant P19624-B02) is acknowledged.
Footnotes
OCIS codes: (170.4500) Optical coherence tomography; (170.4460) Ophthalmic optics and devices; (330.5310) Vision – photoreceptors; (110.6880) Three-dimensional image acquisition.
References and links
- 1.van Velthoven MEJ, Faber DJ, Verbraak FD, van Leeuwen TG, de Smet MD. Recent developments in optical coherence tomography for imaging the retina. Prog. Retin. Eye Res. 2007;26(1):57–77. doi: 10.1016/j.preteyeres.2006.10.002. [DOI] [PubMed] [Google Scholar]
- 2.Drexler W, Fujimoto JG. State-of-the-art retinal optical coherence tomography. Prog. Retin. Eye Res. 2008;27(1):45–88. doi: 10.1016/j.preteyeres.2007.07.005. [DOI] [PubMed] [Google Scholar]
- 3.Podoleanu AG, Rosen RB. Combinations of techniques in imaging the retina with high resolution. Prog. Retin. Eye Res. 2008;27(4):464–499. doi: 10.1016/j.preteyeres.2008.03.002. [DOI] [PubMed] [Google Scholar]
- 4.Schmidt-Erfurth U, Leitgeb RA, Michels S, Povazay B, Sacu S, Hermann B, Ahlers C, Sattmann H, Scholda C, Fercher AF, Drexler W. Three-dimensional ultrahigh-resolution optical coherence tomography of macular diseases. Invest. Ophthalmol. Vis. Sci. 2005;46(9):3393–3402. doi: 10.1167/iovs.05-0370. [DOI] [PubMed] [Google Scholar]
- 5.Chen TC, Cense B, Pierce MC, Nassif N, Park BH, Yun SH, White BR, Bouma BE, Tearney GJ, de Boer JF. Spectral domain optical coherence tomography: Ultra-high speed, ultra-high resolution ophthalmic imaging. Arch. Ophthalmol. 2005;123(12):1715–1720. doi: 10.1001/archopht.123.12.1715. [DOI] [PubMed] [Google Scholar]
- 6.Alam S, Zawadzki RJ, Choi S, Gerth C, Park SS, Morse L, Werner JS. Clinical application of rapid serial fourier-domain optical coherence tomography for macular imaging. Ophthalmology. 2006;113(8):1425–1431. doi: 10.1016/j.ophtha.2006.03.020. [DOI] [PMC free article] [PubMed] [Google Scholar]
- 7.Srinivasan VJ, Wojtkowski M, Witkin AJ, Duker JS, Ko TH, Carvalho M, Schuman JS, Kowalczyk A, Fujimoto JG. High-definition and 3-dimensional imaging of macular pathologies with high-speed ultrahigh-resolution optical coherence tomography. Ophthalmology. 2006;113(11):2054–2065.e3. doi: 10.1016/j.ophtha.2006.05.046. [DOI] [PMC free article] [PubMed] [Google Scholar]
- 8.Roorda A, Williams DR. The arrangement of the three cone classes in the living human eye. Nature. 1999;397(6719):520–522. doi: 10.1038/17383. [DOI] [PubMed] [Google Scholar]
- 9.Liang J, Williams DR, Miller DT. Supernormal vision and high-resolution retinal imaging through adaptive optics. J. Opt. Soc. Am. A. 1997;14(11):2884–2892. doi: 10.1364/josaa.14.002884. [DOI] [PubMed] [Google Scholar]
- 10.Pircher M, Zawadzki R. Combining adaptive optics with optical coherence tomography: Unveiling the cellular structure of the human retina in vivo. Expert Rev. Ophthalmol. 2007;2(6):1019. [Google Scholar]
- 11.Liang J, Williams DR, Miller DT. High resolution imaging of the living human retina with adaptive optics. Invest. Ophthalmol. Vis. Sci. 1997;38:55–55. [Google Scholar]
- 12.Miller DT, Qu J, Jonnal RS, Thorn K. Coherence gating and adaptive optics in the Eye. Proc. SPIE. 2003;4956:65–72. [Google Scholar]
- 13.Potsaid B, Gorczynska I, Srinivasan VJ, Chen YL, Jiang J, Cable A, Fujimoto JG. Ultrahigh speed spectral / Fourier domain OCT ophthalmic imaging at 70,000 to 312,500 axial scans per second. Opt. Express. 2008;16(19):15149–15169. doi: 10.1364/oe.16.015149. [DOI] [PMC free article] [PubMed] [Google Scholar]
- 14.Torti C, Povazay B, Hofer B, Unterhuber A, Carroll J, Ahnelt PK, Drexler W. Adaptive optics optical coherence tomography at 120,000 depth scans/s for non-invasive cellular phenotyping of the living human retina. Opt. Express. 2009;17(22):19382–19400. doi: 10.1364/OE.17.019382. [DOI] [PMC free article] [PubMed] [Google Scholar]
- 15.Schmoll T, Kolbitsch C, Leitgeb RA. Ultra-high-speed volumetric tomography of human retinal blood flow. Opt. Express. 2009;17(5):4166–4176. doi: 10.1364/oe.17.004166. [DOI] [PubMed] [Google Scholar]
- 16.Pircher M, Baumann B, Götzinger E, Hitzenberger CK. Retinal cone mosaic imaged with transverse scanning optical coherence tomography. Opt. Lett. 2006;31(12):1821–1823. doi: 10.1364/ol.31.001821. [DOI] [PMC free article] [PubMed] [Google Scholar]
- 17.Pircher M, Baumann B, Götzinger E, Sattmann H, Hitzenberger CK. Simultaneous SLO/OCT imaging of the human retina with axial eye motion correction. Opt. Express. 2007;15(25):16922–16932. doi: 10.1364/oe.15.016922. [DOI] [PMC free article] [PubMed] [Google Scholar]
- 18.Pircher M, Gotzinger E, Hitzenberger CK. Dynamic focus in optical coherence tomography for retinal imaging. J. Biomed. Opt. 2006;11(5):054013. doi: 10.1117/1.2358960. [DOI] [PubMed] [Google Scholar]
- 19.Pircher M, Baumann B, Sattman H, Gotzinger E, Hitzenberger CK. High speed, high resolution SLO/OCT for investigating temporal changes of single cone photoreceptors in vivo. Proc. SPIE. 2009;7372:13. [Google Scholar]
- 20.Hitzenberger CK. Measurement of Corneal Thickness by Low-Coherence Interferometry. Appl. Opt. 1992;31(31):6637–6642. doi: 10.1364/AO.31.006637. [DOI] [PubMed] [Google Scholar]
- 21.Tearney GJ, Bouma BE, Fujimoto JG. High-speed phase- and group-delay scanning with a grating-based phase control delay line. Opt. Lett. 1997;22(23):1811–1813. doi: 10.1364/ol.22.001811. [DOI] [PubMed] [Google Scholar]
- 22.Drexler W, Findl O, Schmetterer L, Hitzenberger CK, Fercher AF. Eye elongation during accommodation in humans: Differences between emmetropes and myopes. Invest. Ophthalmol. Vis. Sci. 1998;39(11):2140–2147. [PubMed] [Google Scholar]
- 23.Zawadzki RJ, Cense B, Zhang Y, Choi SS, Miller DT, Werner JS. Ultrahigh-resolution optical coherence tomography with monochromatic and chromatic aberration correction. Opt. Express. 2008;16(11):8126–8143. doi: 10.1364/oe.16.008126. [DOI] [PMC free article] [PubMed] [Google Scholar]
- 24.Cense B, Koperda E, Brown JM, Kocaoglu OP, Gao WH, Jonnal RS, Miller DT. Volumetric retinal imaging with ultrahigh-resolution spectral-domain optical coherence tomography and adaptive optics using two broadband light sources. Opt. Express. 2009;17(5):4095–4111. doi: 10.1364/oe.17.004095. [DOI] [PMC free article] [PubMed] [Google Scholar]
- 25.Yellott JI., Jr. Spectral Analysis of Spatial Sampling by Photoreceptors: Topological Disorder Prevents Aliasing. Vision Res. 1982;22(9):1205–1210. doi: 10.1016/0042-6989(82)90086-4. [DOI] [PubMed] [Google Scholar]
- 26.Coletta NJ, Williams DR. Psychophysical Estimate of Extrafoveal Cone Spacing. Journal. of the Optical Society of America. a-Optics Image,” Science and Vision. 1987;4:1503–1513. doi: 10.1364/josaa.4.001503. [DOI] [PubMed] [Google Scholar]
- 27.Pircher M, Zawadzki RJ, Evans JW, Werner JS, Hitzenberger CK. Simultaneous imaging of human cone mosaic with adaptive optics enhanced scanning laser ophthalmoscopy and high-speed transversal scanning optical coherence tomography. Opt. Lett. 2008;33(1):22–24. doi: 10.1364/ol.33.000022. [DOI] [PMC free article] [PubMed] [Google Scholar]
- 28.Curcio CA, Sloan KR, Kalina RE, Hendrickson AE. Human photoreceptor topography. J. Comp. Neurol. 1990;292(4):497–523. doi: 10.1002/cne.902920402. [DOI] [PubMed] [Google Scholar]
- 29.Zhang Y, Cense B, Rha J, Jonnal RS, Gao W, Zawadzki RJ, Werner JS, Jones S, Olivier S, Miller DT. High-speed volumetric imaging of cone photoreceptors with adaptive optics spectral-domain optical coherence tomography. Opt. Express. 2006;14(10):4380–4394. doi: 10.1364/OE.14.004380. [DOI] [PMC free article] [PubMed] [Google Scholar]
- 30.Miller DT, Williams DR, Morris GM, Liang J. Images of cone photoreceptors in the living human eye. Vision Res. 1996;36(8):1067–1079. doi: 10.1016/0042-6989(95)00225-1. [DOI] [PubMed] [Google Scholar]
- 31.Wade AR, Fitzke FW. In-vivo imaging of the human cone photoreceptor mosaic using a confocal LSO. Lasers and Light in Ophthalmology. 1998;8:129–136. [Google Scholar]
- 32.de Monasterio FM, McCrane EP, Newlander JK, Schein SJ. Density Profile of Blue-Sensitive Cones Along the Horizontal Meridian of Macaque Retina. Invest. Ophthalmol. Vis. Sci. 1985;26(3):289–302. [PubMed] [Google Scholar]


