Abstract
Therapy with nucleoside reverse transcriptase inhibitors (NRTIs) can be associated with mitochondrial toxicity. In vitro studies have been used to predict the predisposition for and characterize the mechanisms causing mitochondrial toxicity. Metacavir (PNA) is a novel synthetic nucleoside analog for oral administration with potent and specific antiviral activity against hepatitis B virus (HBV). We assessed the potential for mitochondrial toxicity of PNA in long-term cultures of HepG2 hepatoma cells by measuring mitochondrial function (through lactate secretion), levels of mitochondrial DNA (mtDNA), and the activities of respiratory-chain complexes I to IV. Exposure of HepG2 cells to PNA at concentrations up to 50 μM for 15 days resulted in no deleterious effect on cell proliferation, levels of lactate or mtDNA, or enzyme activities of respiratory-chain complexes I to IV. In contrast, dideoxycytosine at 10 μM and zidovudine at 50 μM have significant effects on cell proliferation, levels of lactate and mtDNA, and enzyme activities of respiratory-chain complexes I to IV. However, PNA at a supratherapeutic concentration of 250 μM could result in significant alterations in the levels of mtDNA and the activities of respiratory-chain complex enzymes, revealing evidence of the potential mitochondrial toxicity of PNA. In summary, these in vitro results indicate that the potential for PNA to interfere with mitochondrial functions is low.
A variety of nucleoside analogs have been developed for treatment of viral infections, including HIV and hepatitis B virus (HBV) infections. Although they are highly efficacious, these compounds have been associated with adverse effects, including hematological disorders, peripheral neuropathy, skeletal and cardiac myopathy, pancreatitis, hepatic failure, lactic acidosis, and possibly, lipodystrophy (5-11, 14, 15). Most previous studies demonstrated that these adverse effects of nucleoside analogs are directly associated with mitochondrial injury, on the basis of the abnormal morphology of mitochondria, depletion of mitochondrion-encoded enzyme subunits, and decreased mitochondrial gene number (2, 3, 5, 6, 10, 11, 14, 15, 29). Clinical toxicities due to the mitochondrial dysfunction induced by nucleoside analogs may limit the use of certain treatment regimens and may even produce fatal complications, as documented for some cases of severe lactic acidosis (2, 12, 13, 26, 27). Therefore, it is important to evaluate new drugs from the nucleoside analogs for their potential to cause mitochondrial toxicity by measuring specific markers of toxicity, such as the level of mitochondrial DNA (mtDNA) synthesis or production of lactic acid in drug-treated cell cultures (1, 2, 5, 6, 12, 20, 29). Zidovudine (AZT) was the first and the most commonly used dideoxynucleoside for the treatment of AIDS and was well recognized to induce mitochondrial toxicity in heart muscle, skeletal muscle, and other tissues by the mechanisms of causing inhibition of mtDNA polymerase, termination of synthesis of growing mtDNA strands, and mtDNA depletion (1, 10, 11, 14, 15, 22, 29). A large number of studies have demonstrated that AZT and dideoxycytosine (ddC) can inhibit cell proliferation, induce cytoplasmic lipid droplet accumulation, increase lactate production, and decrease the activities of mitochondrial respiratory-chain enzymes in cell culture assays (1, 2, 29). Therefore, AZT and ddC were two of the most commonly used reference controls for evaluation of mitochondrial toxicity (2, 21, 29).
Metacavir (PNA) (Fig. 1) is a novel nucleotide analog with potent anti-HBV activity (18) and has recently been approved for evaluation in a phase I trial by the State Food and Drug Administration in China. In our preclinical study, our findings showed that PNA could significantly inhibit the secretion of HBsAg and HBeAg in the HepG2.2.15 cell line and lower the level of duck hepatitis B virus (DHBV) DNA in a DHBV-infected duck model by oral perfusion and intravenous injection, suggesting that PNA could potentially possess anti-HBV activity.
FIG. 1.
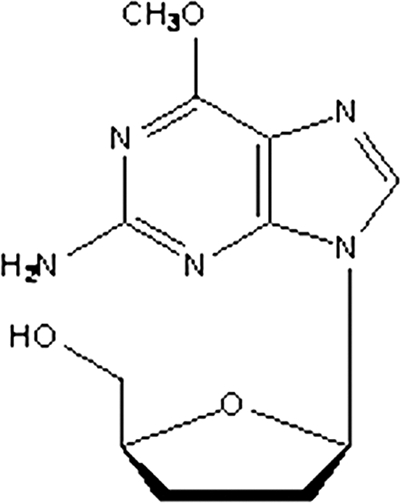
Structure of PNA.
By comparing the various cell culture models currently used for the investigation of nucleoside reverse transcriptase inhibitor (NRTI)-induced mitochondrial toxicity, Pinti et al. demonstrated that a HepG2 cell model is excellent for investigating mitochondrial toxicity because of the large amounts of mitochondria and mtDNA present in such cells (25). The use of HepG2 cells enables recognition of the effects of an agent on mtDNA as well as the direct effects on mitochondrial function, while the other tissue-specific cell culture models do not provide additional information regarding the potential of an agent to induce mitochondrial toxicity (17, 25). In the present study, PNA was characterized and compared with AZT and ddC for its potential to cause mitochondrial toxicity in HepG2 cells. Specific mitochondrial and nonspecific cell toxicities were assessed at intervals during the course of the 15-day culture. The results indicate that the potential for PNA to interfere with mitochondrial functions is low.
MATERIALS AND METHODS
Cells and compounds.
The HepG2 cell line was purchased from the American Type Culture Collection. Minimum essential medium with nonessential amino acids, sodium pyruvate, fetal bovine serum, and trypsin was purchased from Gibco Life Technologies, Inc. AZT was obtained from the Shanghai Modern Pharmaceutical Co., Ltd. A lactic acid assay kit was purchased from Kinghawk Pharmaceutical Co., Ltd. ddC was obtained from the Tokyo Chemical Industry Co., Ltd. PNA was provided by the Nanjing Chang'ao Medicinal and Pharmaceutical Co., Ltd.
Determination of cytotoxicity and l-lactic acid and morphological evaluations.
HepG2 cells (5 × 10⁵/ml) were plated into 75-cm2 flasks in minimum essential medium with nonessential amino acids supplemented with 10% fetal bovine serum, 1 mM sodium pyruvate, and 1% penicillin-streptomycin and exposed to various concentrations of AZT, ddC, and PNA for 6, 9, and 15 days. The culture medium and drugs were renewed every 3 days. On days 6, 9, and 15, cell numbers were determined using trypan blue dye exclusion and counting with a hemocytometer. The level of lactic acid in the medium after 6, 9, and 15 days of treatment was determined with a Kinghawk lactic acid kit and was expressed as milligrams of lactic acid production per 106 cells.
Test compound exposures.
The effects of PNA and other nucleoside analogs were assessed in HepG2 cell cultures essentially as described previously (21, 28). The compounds or dimethyl sulfoxide (DMSO) vehicle control was added from DMSO stocks at 1,000 times the final exposure concentration. The final concentrations of ddC and AZT were 10 μM and 50 μM, respectively. The final concentrations of PNA were 10 μM, 50 μM, and 250 μM. The DMSO concentration in the vehicle-treated control culture was 0.1% (vol/vol). Cultures were exposed to compounds for a total of 15 days and were reseeded to the original cell density every 5 days. In addition, medium and compounds were also replaced 3 days after cells were seeded. This schedule resulted in replacement of medium containing fresh compound on days 1, 3, 5, 8, 10, and 13. Cells and culture supernatants were harvested and assayed on days 5, 10, and 15.
Electron microscopic evaluation.
Electron microscopic evaluation of mitochondrial morphological changes was performed as described previously (24). Briefly, the cells were fixed in 2.5% glutaraldehyde for 1 h, washed with sodium phosphate buffer, and postfixed in 1% osmium tetroxide for 1 h. The cells were gradually dehydrated with increasing concentrations of ethanol from 50% through 100% in propylene oxide and slowly infiltrated and embedded in Epon. The cells were then sectioned with a Reichert-Jung ultramicrotome and stained with uranyl acetate and lead citrate. Finally, the cells were examined with a Tecnai 12 (Philips) electron microscope. All experiments were repeated three times. More than 10 fields of cells receiving each drug treatment were examined under low or high magnification, and the electron micrographs of representative fields were saved for further analysis.
Recombinant plasmids of cyt-b and actin construction.
Two fragments from a highly conserved region of the human cytochrome b (cyt-b) and actin genes were amplified as described previously (16). These fragments were inserted into a linearized vector (pGEM-T Easy vectors; Promega) using a TA cloning system. Ligation and transformation were carried out following the instructions of the manufacturer. More than 30 colonies were obtained in each of the two petri plates spread with the transformation product. Ten colonies were picked and grown overnight in Luria-Bertani (LB) growth medium. Plasmid DNA was extracted using a QIAamp preplasmid minikit (Qiagen GmbH, Hilden, Germany) and identified by PCR. Recombinant plasmids were sequenced using T3 and T7 primers, which framed the insert, using an ABI Prism BigDye Terminator cycle sequencing kit and were analyzed by using an Applied Biosystems 3700 automatic sequencing system.
DNA extraction.
HepG2 cells (5 × 10⁵/ml) were exposed to different concentrations of AZT, ddC, and PNA for 15 days. Dry pellets of 1 × 10⁶ cells were resuspended in 200 μl of elution buffer, and the DNA in the cells was extracted with QIAamp DNA minikits (Qiagen GmbH), according to the manufacturer's instructions. Briefly, a DNA sample (200 μl) was supplemented with Qiagen protease (20 μl), RNase (4 μl), and buffer AL (200 μl). After the mixture was vortexed for 15 s, it was incubated at 56°C for 60 min. Then, it was supplemented with absolute ethanol (200 μl) and was carefully applied to a QIAamp spin column in a 2-ml collection tube. It was sequentially supplemented with 500 μl each of buffers AW1 and AW2 after each centrifugation. Then, the mixture was supplemented with buffer AE (200 μl; elution buffer) after centrifugation at full speed (20,000 × g; 14,000 rpm). It was incubated at room temperature for 5 min and was then centrifuged at 6,000 × g (8,000 rpm) for 1 min. Finally, the DNA samples were stored at −20°C for further experiments.
mtDNA quantitation.
cyt-b quantification was performed with a consensus TaqMan PCR assay, as described previously (16). The PCR primers (cyt-2s and cyt-2as) and probe were selected from a highly conserved region of the human cyt-b gene. The Cyt-P2 probe (5′-FAM-CACCAGACGCCTCAACCGCCTT-TAMRA-3′) contained at the 5′ end 6-carboxyfluorescein (FAM) as a fluorescent reporter dye and at the 3′ end 6-carboxytetramethylrhodamine (TAMRA) as a quencher dye. The amplification was performed in a 20-μl reaction mixture containing 1 μl of DNA, 0.8 μl of TaqMan universal PCR master mix (TaRaKa), 200 nM each primer, and 200 nM probe. Starting by the activation of the uracil N-glycosylase for 2 min at 95°C and AmpliTaq Gold for 10 min at 95°C, 45 cycles (15 s at 95°C and 1 min at 60°C) were performed with an iQ5 cycler real-time PCR detector system (Bio-Rad). A recombinant plasmid containing one copy of the cyt-b target sequence was used as a standard for mtDNA quantification. In parallel, we determined the number of copies of the actin gene in the DNA sample. Serial dilutions of from 106 to 10 copies of the actin plasmid were prepared using a recombinant plasmid to establish a standard curve. The PCR primers and the probes were synthesized by Sangon Biotech (Shanghai) Co., Ltd. With this method, the absolute cytochrome b/actin ratios were determined for each sample, and the values, representing the percentage of the value for the 0.1% DMSO-treated control cultures, are presented.
Isolation of mitochondria and enzyme assays.
HepG2 cells (10 × 106) were grown in a 175-cm2 tissue culture flask (Corning). Various concentrations of PNA, AZT, ddC, and DMSO vehicle-treated control were added to the medium, which was changed every 3 days. After 15 days, the cell monolayers were treated with 10% trypsin-phosphate-buffered saline (PBS) and then neutralized with the medium. The cells were washed three times with cold PBS and then suspended in 4 ml of 10 mM triethanolamine acetate buffer, pH 7.4, containing 0.25 M sucrose, 1 mM EGTA, and 0.5% bovine serum albumin. Isolation of mitochondria was performed as described previously (24). Briefly, the cells were homogenized with a glass homogenizer and centrifuged twice at 1,500 × g for 10 min at 4°C. The supernatant was centrifuged at 12,000 × g for 10 min. The pellets (mitochondria) were washed three times; resuspended in 10 mM Tris-HCl, pH 7.4, containing 10 mM KCl, 0.25 M sucrose, and 5 mM MgCl2; and stored at −70°C. Protein was measured as described by Bradford (4).
The activities of complexes I, II, III, and IV were assayed with an animal mitochondrial respiratory-chain assay kit (Genmed Scientifics Inc.), with modification to allow quantitation in a 96-well plate format. Complex I activity was measured through the decrease in absorption at 340 nm for NADH oxidation with decylubiquinone as an electron acceptor in the presence or absence of rotenone. Complex II activity was assayed by measuring the decrease in absorbance at 600 nm for the rate of reduction of 2,6-dichlorophenolindophenol. Complex III activity was measured from the reduction in absorbance at 550 nm for cytochrome c and was expressed as the first-order rate constant per milligram of protein. Complex IV activity was measured by following the oxidation of reduced cytochrome c at 550 nm and was expressed as the first-order rate constant per milligram of protein. Except for complex IV, activity was measured at 25°C; all the other enzyme assays were performed at 30°C in a final volume of 100 μl with a Tencan Lambda 6 spectrophotometer (Safire2; Switzerland). Total protein was determined by a bicinchoninic acid protein assay kit (Genmed Scientifics Inc.).
Statistical analysis.
The absolute values for each end point measured (cell numbers, extracellular lactate levels, or mtDNA/nuclear DNA [nDNA] ratio) were compared to the individual control values for each experiment, thus generating a percentage of the control value for each treatment. Means and standard deviation (SDs) or standard errors of the means (SEMs) were determined for each treatment group (n = 3). Transformed results were analyzed using one-way analysis of variance with Dunnett's posttest (GraphPad Prism software, version 3.0).
RESULTS
Cytotoxicity and evaluation by electron microscopy of mitochondria in HepG2 cells treated with nucleoside analogs.
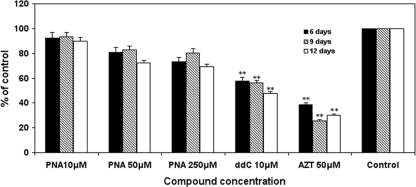
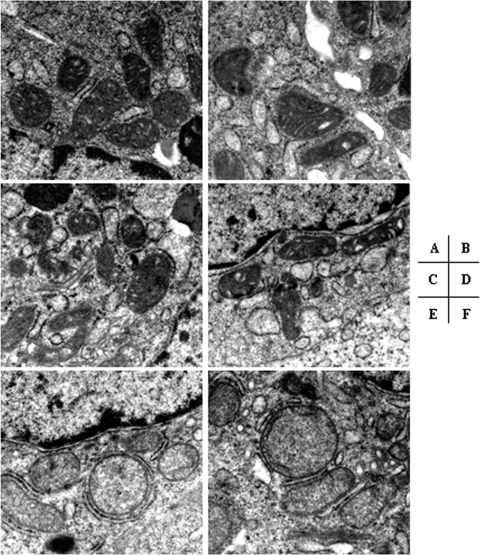
HepG2 cells were exposed to various concentrations of PNA and the other HBV NRTIs for various durations, and the cell numbers were determined. After treatment with various concentrations of nucleoside analogs, ddC significantly decreased the number of cells, ultimately decreasing to <30% of the control values after 15 days. AZT at a 50 μM concentration resulted in decreased cell numbers, seen at days 6 through 15 of culture (P < 0.001), with the cell numbers being nearly 60% lower than those in the control cultures after 15 days. In contrast, exposure to PNA at concentrations up to 250 μM did not significantly affect HepG2 cell numbers at any time during the 15-day culture (Fig. 2). Following 15 days of exposure to PNA, AZT, and ddC, the ultrastructures of the HepG2 cells were examined by electron microscopy. Although exposure to PNA at various concentrations did not significantly affect the cell structure, an increase in lipid droplet formation and swelled mitochondria compared with the findings for the DMSO-treated control were observed with 250 μM. With respect to mitochondria, AZT slightly enlarged the organelle size, whereas swelled mitochondria and disrupted mitochondrial cristae were also observed in ddC-treated cells (Fig. 3). Subsequent assays were performed to determine whether the observed cytotoxicities were related to mitochondrial toxicity.
FIG. 2.
Effects of NRTI exposures on HepG2 cell numbers. Cell cultures were exposed to different concentrations of the NRTIs listed, and cell numbers were determined after 6, 9, or 12 days. Data represent the percentage of the numbers for the 0.1% DMSO-treated control cultures and are the means plus SDs (error bars) of three independent experiments. The durations of culture were 6 days, 9 days, and 12 days. **, P < 0.001 by Dunnett's multiple-comparison test.
FIG. 3.
Representative electron micrographs of HepG2 cells treated with nucleosides. After 15 days of incubation of HepG2 cells with the control (DMSO) (A), 10 μM PNA (B), 50 μM AZT (C), 50 μM PNA (D), 10 μM ddC (E), and 250 μM PNA (F), electron microscopy was undertaken. Swelled mitochondria were observed in ddC- and PNA (250 μM)-treated cells. For each drug treatment, more than 10 fields were examined under low or high magnification. A representative electron micrograph from three independent experiments is shown. Magnification, ×26,500.
Mitochondrial function and lactate secretion.
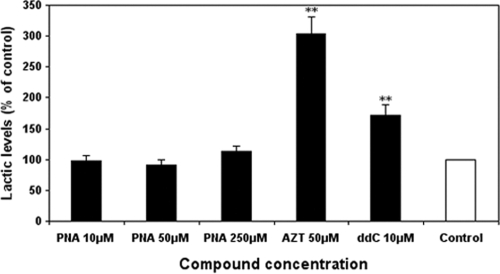
Increased secretion of extracellular lactate is a marker of impaired mitochondrial function (24). As shown in Fig. 4, the level of lactic acid in the medium was markedly increased approximately 300% and 170% by AZT (50 μM) and ddC (10 μM) treatment, respectively. In contrast, exposure of the cells to PNA at 10 μM, 50 μM, and 250 μM did not result in significant increases in extracellular lactate levels at the longest duration of 15 days (Fig. 4). Consistent with previous reports (21, 24), exposure of cells to ddC at 10 μM resulted in significant increases in extracellular lactate levels (P < 0.001), indicating impaired mitochondrial function.
FIG. 4.
Effects of NRTI exposures on extracellular lactate levels. HepG2 cell cultures were exposed to different concentrations of the NRTIs listed, and the levels of lactate in the medium were determined after 15 days. Lactate levels were normalized according to cell numbers. Values represent the percentage of the values for the 0.1% DMSO-treated control cultures and are the means plus SDs of three independent experiments. **, P < 0.001 by Dunnett's multiple-comparison test.
Effects of PNA and other NRTIs on mtDNA content in liver cells.
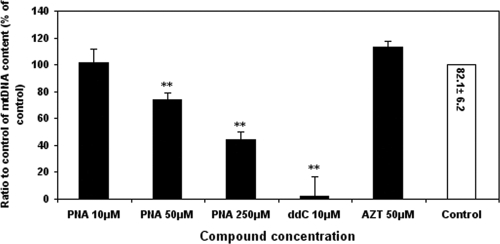
Clinical adverse effects due to NRTI-induced mitochondrial toxicity frequently occur in liver tissue (23, 27). Therefore, the in vitro experiments performed to assess the mitochondrial toxicity of PNA were carried out with HepG2 cells. Directly monitoring mtDNA levels is a very sensitive method of measuring mitochondrial toxicity (17). The effects of PNA and other NRTIs on mtDNA synthesis were determined by measuring the ratio of mtDNA and chromosomal DNA in total cellular DNA preparations by quantitative real-time PCR, as described previously (16). Exposure of HepG2 cells to PNA at 10 μM for 15 days did not result in any significant alterations in mtDNA levels (Fig. 5), whereas PNA at the high concentrations of 50 μM and 250 μM significantly decreased mtDNA levels compared with those for the DMSO-treated control (P < 0.001). These results suggested a lack of a direct correlation between the increase in the medium lactic acid level and inhibition of mtDNA replication by these nucleoside analogs. As previously reported, the mtDNA level of ddC (10 μM)-treated cells was significantly decreased to 3% of control levels after 15-day exposures. Consistent with previous reports (1, 24), exposure of cells to AZT at 50 μM resulted in a slight elevation in the mtDNA/nDNA ratio after 15 days, but the difference was found to be statistically insignificant.
FIG. 5.
Effects of NRTI exposures on mtDNA levels. HepG2 cell cultures were exposed to different concentrations of the NRTIs listed. The ratios of mtDNA to nDNA were determined by real-time PCR, as described in Materials and Methods. Values represent the percentage of the values for 0.1% DMSO-treated control cultures and are the means plus SDs of three independent experiments. **, P < 0.001 by Dunnett's multiple-comparison test. The value in the control bar represents the absolute ratio of mtDNA/nDNA ± SEM for the control.
Effects of nucleoside analogs on respiratory-chain complex I to IV activities.
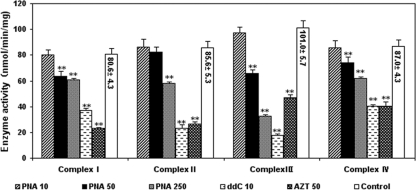
In order to explore whether these nucleoside analogs have effects on the activities of the respiratory-chain complexes, mitochondria were isolated from HepG2 cells after 15-day exposures to 10, 50, and 250 μM PNA; 50 μM AZT; and 10 μM ddC. Figure 6 shows that ddC and AZT significantly decreased the activities of mitochondrial respiratory-chain complexes I to IV compared with the activity for the DMSO-treated control (P < 0.001). In contrast, PNA displayed a concentration-dependent effect on the activities of mitochondrial respiratory-chain complexes I to IV. Exposure to PNA at concentrations up to 10 μM did not result in any significant alterations in the activities of mitochondrial respiratory-chain complexes I to IV in HepG2 cells compared with the activity in DMSO-treated control cells. Compared with the DMSO-treated controls, PNA at 50 μM significantly decreased the capacity of mitochondrial respiratory-chain complexes I, III, and IV, while it had no significant effect on complex II activities. Although at 250 μM PNA significantly decreased the activities of the four mitochondrial respiratory-chain complexes compared with the activity of the DMSO-treated controls, the decrease was less than the decreases obtained with ddC (10 μM) and AZT (50 μM).
FIG. 6.
Effects of antiviral nucleoside analogs on the activities of respiratory-chain enzyme complexes. HepG2 cell cultures were exposed to various concentrations of nucleoside analogs for 15 days. Mitochondria were then extracted as described in Materials and Methods. The standard deviations (error bars) of the data were determined from the means of three experiments. **, P < 0.001 by Dunnett's multiple-comparison test.
DISCUSSION
Mitochondrial toxicity is considered an inherent risk of therapies involving the nucleoside (nucleotide) analog class, having been observed upon prolonged use of a subset of approved NRTIs (23, 27). Therefore, a panel of in vitro assays has been established to determine the potential for mitochondrial toxicity (17). HepG2 cells were considered an excellent model for investigation of mitochondrial toxicity because of the large amounts of mitochondria and mtDNA present in such cells (17). In the present study, we assessed the potential mitochondrial toxicity of PNA in this cell culture model. Our data showed that PNA at concentrations up to 10 μM did not decrease cell numbers or increase extracellular lactate levels, even after prolonged incubation, whereas AZT, used as a positive control for mitochondrial toxicity, exhibited a mild cytotoxic effect and caused a significant elevation in the extracellular lactate levels (P < 0.001) and ddC caused a marked decrease in the viability of HepG2 cells and a significant elevation in extracellular lactate levels (P < 0.001) in a concentration- and time-dependent manner.
Our study also revealed that PNA has concentration-dependent effects on mtDNA levels in HepG2 cells. Exposure of HepG2 cultures to PNA at 10 μM for 15 days did not result in any significant alterations in the level of mtDNA from DMSO-treated controls, whereas at supratherapeutic concentrations of 50 μM and 250 μM, PNA caused a significant decrease in mtDNA levels (about 80% and 60% of the level for the DMSO-treated controls, respectively). These results were accompanied by decreased activities of mitochondrial respiratory-chain complexes I to IV. Treatment with PNA at concentrations up to 10 μM did not result in any significant alterations in the activities of mitochondrial respiratory-chain complexes I to IV, whereas PNA at 50 μM and 250 μM had significant effects on the capacities of mitochondrial respiratory-chain complexes I to IV. In addition, ddC caused a significant decrease in mtDNA levels and the activities of mitochondrial respiratory-chain complexes I to IV (P < 0.001), which could be associated with its mechanism of efficient incorporation into mtDNA and inefficient removal through polymerase proofreading (1, 7, 19). Consistent with the findings of previous research (1, 24), we found that AZT can significantly reduce the capacity of the respiratory-chain complexes in mitochondria without depleting mtDNA.
The results presented in Fig. 2 to 6 suggested that exposure of HepG2 cell cultures to PNA at 10 μM did not result in any alterations in cell numbers, extracellular lactate or mtDNA levels, or the capacities of mitochondrial respiratory-chain complexes, whereas PNA at high concentrations exhibited significant dose-dependent mitochondrial toxicity. Our results are consistent with those of Zeng et al. described in a recent report about the in vivo mitochondrial toxicity of PNA in rhesus monkeys (30). Their data showed that daily treatment with PNA at 40 mg/kg of body weight for 3 months did not result in any significant alterations in mitochondrial function in rhesus monkeys. However, treatment with 120 mg/kg PNA for 3 months decreased the activities of the respiratory-chain complexes and the mtDNA contents in skeletal muscle, cardiac muscle, and liver tissue in rhesus monkey (30). Therefore, the mechanism of mitochondrial toxicity of PNA needs to be further explored.
In conclusion, long-term cell culture studies that examined the mitochondrial toxicity of PNA revealed evidence of mitochondrial toxicity after PNA exposure at supratherapeutic concentrations, that is, those exceeding concentrations reasonably expected to be used during therapy. However, exposure to PNA at 10 μM for 15 days did not result in any significant alterations. In contrast, the other approved NRTIs with anti-HBV activity, AZT and ddC, at 10 μM exhibited significant mitochondrial injury. These results suggest that PNA has a very low potential for mitochondrial toxicity during therapy.
Acknowledgments
The research was supported by the Mega-Projects of Science Research for the 11th Five-Year Plan: Standardized Platform Construction and Scientific Application in New Technologies for New Drug Screening (grant 2009ZX09302-002).
Footnotes
Published ahead of print on 30 August 2010.
REFERENCES
- 1.Benbrik, E., P. Chariot, S. Bonavaud, M. Ammi-Said, E. Frisdal, C. Rey, R. Gherardi, and G. Barlovatz-Meimon. 1997. Cellular and mitochondrial toxicity of zidovudine (AZT), didanosine (ddI) and zalcitabine (ddC) on cultured human muscle cells. J. Neurol. Sci. 149:19-25. [DOI] [PubMed] [Google Scholar]
- 2.Birkus, G., M. J. Hitchcock, and T. Cihlar. 2002. Assessment of mitochondrial toxicity in human cells treated with tenofovir: comparison with other nucleoside reverse transcriptase inhibitors. Antimicrob. Agents Chemother. 46:716-723. [DOI] [PMC free article] [PubMed] [Google Scholar]
- 3.Birkus, G., C. S. Gibbs, and T. Cihlar. 2003. Comparative effects of adefovir and selected nucleoside inhibitors of hepatitis B virus DNA polymerase on mitochondrial DNA in liver and skeletal muscle cells. J. Viral Hepat. 10:50-54. [DOI] [PubMed] [Google Scholar]
- 4.Bradford, M. M. 1976. A rapid and sensitive method for the quantitation of microgram quantities of protein utilizing the principle of protein-dye binding. Anal. Biochem. 72:248-254. [DOI] [PubMed] [Google Scholar]
- 5.Brinkman, K., H. ter Hofstede, D. M. Burger, J. A. Smeitink, and P. P. Koopmans. 1998. Adverse effects of reverse transcriptase inhibitors: mitochondrial toxicity as common pathway. AIDS 12:1735-1744. [DOI] [PubMed] [Google Scholar]
- 6.Brinkman, K., and H. ter Hofstede. 1999. Mitochondrial toxicity of nucleoside analogue reverse transcriptase inhibitors: lactic acidosis, risk factors and therapeutic options. AIDS Rev. 1:140-146. [Google Scholar]
- 7.Buffet, M., M. Schwarzinger, B. Amellal, K. Gourlain, P. Bui, M. Prevot, J. Deleuze, J. P. Morini, I. Gorin, V. Calvez, and N. Dupin. 2005. Mitochondrial DNA depletion in adipose tissue of HIV-infected patients with peripheral lipoatrophy. J. Clin. Virol. 33:60-64. [DOI] [PubMed] [Google Scholar]
- 8.Carr, A., and D. A. Cooper. 2000. Adverse effects of antiretroviral therapy. Lancet 356:1423-1430. [DOI] [PubMed] [Google Scholar]
- 9.Carr, A., J. Miller, M. Law and, D. A. Cooper. 2000. A syndrome of lipoatrophy, lactic acidaemia and liver dysfunction associated with HIV nucleoside analogue therapy: contribution to protease inhibitor-related lipodystrophy syndrome. AIDS 14:25-32. [DOI] [PubMed] [Google Scholar]
- 10.Casademont, J., A. Barrientos, J. M. Grau, E. Pedrol, X. Estivill, A. Urbano-Marquez, and V. Nunes. 1996. The effect of zidovudine on skeletal muscle mtDNA in HIV-1 infected patients with mild or no muscle dysfunction. Brain 119:1357-1364. [DOI] [PubMed] [Google Scholar]
- 11.Chariot, P., F. Le Maguet, F. J. Authier, D. Labes, F. Poron, and R. Gherardi. 1995. Cytochrome c oxidase deficiency in zidovudine myopathy affects perifascicular muscle fibres and arterial smooth muscle cells. Neuropathol. Appl. Neurobiol. 21:540-547. [DOI] [PubMed] [Google Scholar]
- 12.Chen, C. H., M. Vazquez-Padua, and Y. C. Cheng. 1991. Effect of anti-human immunodeficiency virus nucleoside analogs on mitochondrial DNA and its implication for delayed toxicity. Mol. Pharmacol. 39:625-628. [PubMed] [Google Scholar]
- 13.Cui, L., S. Yoon, R. S. Schinazi, and J. P. Sommadossi. 1995. Cellular and molecular events leading to mitochondrial toxicity of 1-(2-deoxy-2-fluoro-β-d-arabinofuranosyl)-5-iodouracil in human liver cells. J. Clin. Invest. 95:555-563. [DOI] [PMC free article] [PubMed] [Google Scholar]
- 14.Dalakas, M. C., I. Illa, G. H. Pezeshkpour, J. P. Laukaita, B. Cohen, and J. L. Griffin. 1990. Mitochondrial myopathy caused by long-term zidovudine therapy. N. Engl. J. Med. 322:1098-1105. [DOI] [PubMed] [Google Scholar]
- 15.Dalakas, M. C., M. E. Leon-Monzon, I. Bernardini, W. A. Gahl, and C. A. Jay. 1994. Zidovudine-induced mitochondrial myopathy is associated with muscle carnitine deficiency and lipid storage. Ann. Neurol. 35:482-487. [DOI] [PubMed] [Google Scholar]
- 16.Gourlain, K., B. Amellal, Z. A. Arkoub, N. Dupin, C. Katlama, and V. Calvez. 2003. Quantitative analysis of human mitochondrial DNA using a real-time PCR assay. HIV Med. 4:287-292. [DOI] [PubMed] [Google Scholar]
- 17.Höschele, D. 2006. Cell culture models for the investigation of NRTI-induced mitochondrial toxicity. Relevance for the prediction of clinical toxicity. Toxicol. In Vitro 20:535-546. [DOI] [PubMed] [Google Scholar]
- 18.Li, Z., X. Huang, Z. Z. Jiang, Y. J. Xiao, C. H. Liu, L. Y. Zhang, B. Shu, J. F. Huang, T. Li, T. Wang, and F. Wang. 2008. A sensitive and specific liquid chromatography-mass spectrometry method for determination of metacavir in rat plasma. J. Chromatogr. B 864:9-14. [DOI] [PubMed] [Google Scholar]
- 19.Lund, K. C., L. L. Peterson, and K. B. Wallace. 2007. Absence of a universal mechanism of mitochondrial toxicity by nucleoside analogs. Antimicrob. Agents Chemother. 51:2531-2539. [DOI] [PMC free article] [PubMed] [Google Scholar]
- 20.Martin, J. L., C. E. Brown, N. Matthews-Davis, and J. E. Reardon. 1994. Effects of antiviral nucleoside analogs on human DNA polymerases and mitochondrial DNA synthesis. Antimicrob. Agents Chemother. 38:2743-2749. [DOI] [PMC free article] [PubMed] [Google Scholar]
- 21.Mazzucco, C. E., R. K. Hamatake, R. J. Colonno, and D. J. Tenney. 2008. Entecavir for treatment of hepatitis B virus displays no in vitro mitochondrial toxicity or DNA polymerase gamma inhibition. Antimicrob. Agents Chemother. 52:598-605. [DOI] [PMC free article] [PubMed] [Google Scholar]
- 22.Mhiri, C., M. Baudrimont, G. Bonne, C. Geny, F. Degoul, C. Marsac, E. Roullet, and R. Gherardi. 1991. Zidovudine myopathy: a distinctive disorder associated with mitochondrial dysfunction. Ann. Neurol. 29:606-614. [DOI] [PubMed] [Google Scholar]
- 23.Moyle, G. 2000. Clinical manifestations and management of antiretroviral nucleoside analog-related mitochondrial toxicity. Clin. Ther. 22:911-936. [DOI] [PubMed] [Google Scholar]
- 24.Pan-Zhou, X. R., L. Cui, X. J. Zhou, J. P. Sommadossi, and V. M. Darley-Usmar. 2000. Differential effects of antiretroviral nucleoside analogs on mitochondrial function in HepG2 cells. Antimicrob. Agents Chemother. 44:496-503. [DOI] [PMC free article] [PubMed] [Google Scholar]
- 25.Pinti, M., L. Troiano, M. Nasi, R. Ferraresi, J. Dobrucki, and A. Cossarizza. 2003. Hepatoma HepG2 cells as a model for in vitro studies on mitochondrial toxicity of antiviral drugs: which correlation with the patient? J. Biol. Regul. Homeost. Agents 17:166-171. [PubMed] [Google Scholar]
- 26.Slipetz, D. M., J. R. Aprille, P. R. Goodyer, and R. Rozen. 1991. Deficiency of complex III of the mitochondrial respiratory chain in a patient with facioscapulohumeral disease. Am. J. Hum. Genet. 48:502-510. [PMC free article] [PubMed] [Google Scholar]
- 27.Sundar, K., M. Suarez, P. E. Banogon, and J. M. Shapiro. 1997. Zidovudine induced fatal lactic acidosis and hepatic failure in patients with acquired immunodeficiency syndrome: report of two patients and review of the literature. Crit. Care Med. 25:1425-1430. [DOI] [PubMed] [Google Scholar]
- 28.Walker, U. A., N. Venhoff, E. C. Koch, M. Olschewski, J. Schneider, and B. Setzer. 2003. Uridine abrogates mitochondrial toxicity related to nucleoside analogue reverse transcriptase inhibitors in HepG2 cells. Antivir. Ther. 8:463-470. [PubMed] [Google Scholar]
- 29.White, A. J. 2001. Mitochondrial toxicity and HIV therapy Sex. Transm. Infect. 77:158-173. [DOI] [PMC free article] [PubMed] [Google Scholar]
- 30.Zeng, W., A. C. Cheng, Z. L. Chen, Q. H. Luo, Y. B. Sun, Z. Li, and F. J. Bin. 2009. In vivo assessment of mitochondrial toxicity of metacavir in rhesus monkeys after three months of intravenous administration. Acta Pharmacol. Sin. 30:1666-1673. [DOI] [PMC free article] [PubMed] [Google Scholar]


