

Abstract
Clearing blood-stage malaria parasites without inducing major host pathology requires a finely tuned balance between pro- and anti-inflammatory responses. The interplay between regulatory T (Treg) cells and dendritic cells (DCs) is one of the key determinants of this balance. Although experimental models have revealed various patterns of Treg cell expansion, DC maturation, and cytokine production according to the infecting malaria parasite species, no studies have compared all of these parameters in human infections with Plasmodium falciparum and P. vivax in the same setting of endemicity. Here we show that during uncomplicated acute malaria, both species induced a significant expansion of CD4+ CD25+ Foxp3+ Treg cells expressing the key immunomodulatory molecule CTLA-4 and a significant increase in the proportion of DCs that were plasmacytoid (CD123+), with a decrease in the myeloid/plasmacytoid DC ratio. These changes were proportional to parasite loads but correlated neither with the intensity of clinical symptoms nor with circulating cytokine levels. One-third of P. vivax-infected patients, but no P. falciparum-infected subjects, showed impaired maturation of circulating DCs, with low surface expression of CD86. Although vivax malaria patients overall had a less inflammatory cytokine response, with a higher interleukin-10 (IL-10)/tumor necrosis factor alpha (TNF-α) ratio, this finding did not translate to milder clinical manifestations than those of falciparum malaria patients. We discuss the potential implications of these findings for species-specific pathogenesis and long-lasting protective immunity to malaria.
Despite several decades of control efforts, malaria remains the most devastating protozoan disease worldwide. Plasmodium falciparum, the most prevalent and virulent malaria parasite that infect humans, causes 200 to 660 million clinical malaria episodes yearly, with 0.5 to 3 million deaths, mostly among African children (45). Plasmodium vivax, the most widespread species, predominates outside Africa and causes 130 to 390 million episodes of disease each year (19). The recent emergence of severe (and sometimes fatal) disease in South and Southeast Asia, Oceania, and South America challenges the traditional view of vivax malaria as a benign infection and calls for a better understanding of the species-specific pathology of human malaria (37).
A delicate balance between pro- and anti-inflammatory responses is required for clearing malaria parasites without inducing major host pathology, suggesting that the timing and intensity of different types of responses are crucial to determining the infection's outcome (16, 28, 38). While an early proinflammatory response is required to reduce the parasite load, immunoregulatory mechanisms can prevent further organ damage once parasitemia is under control and may cause the suppression of T-cell responses to both malarial and unrelated antigens, which is often observed in malaria-exposed populations (2, 17, 18).
One of the key determinants of immune homeostasis is the interplay between regulatory T (Treg) cells and dendritic cells (DCs). Treg cells are CD4+ CD25+ cells characterized by the intracellular expression of the forkhead box P3 (Foxp3) transcription factor that play a major role in the control of immune responses to self and environmental antigens, pathogens, and commensals (40). DCs are bone marrow-derived leukocytes specialized in presenting antigens to other immune cells, thereby initiating adaptive immune responses (1). They drive the differentiation of naïve T cells into gamma interferon (IFN-γ)-secreting Th1 cells, interleukin-4 (IL-4)-secreting Th2 cells, and some subsets of regulatory cells, including induced Foxp3+ Treg cells that are derived from circulating CD25− Foxp3− CD4+ T cells under stimulation with transforming growth factor beta (TGF-β) (24, 41). Rodent malaria models have been used extensively to explore the relative roles of Treg cell and DC populations in determining disease outcomes, leading to conflicting conclusions for different parasite-host combinations (14, 29, 43, 46, 53).
Studies on human malaria immune homeostasis are limited to circulating cells and cytokines, since the peripheral blood is the most accessible compartment for sampling (3, 9, 10, 13, 27, 36, 48, 49, 50). Most studies have examined P. falciparum infections acquired under conditions of very intense transmission that prevail in Africa (3, 13, 27, 48, 49, 50), and although experimental malaria models have revealed various patterns of cell activation and cytokine production according to the infecting parasite species and load (29), it remains unclear how humans regulate their immune responses when exposed to different malaria species and various transmission levels. Changes in peripheral populations of Treg cells (4, 22) and DCs (22) during acute P. vivax malaria were recently characterized in Brazil and Thailand, but no data are available for P. falciparum infections in comparable settings of low endemicity. Here we sought to characterize peripheral populations of Treg cells and DCs and to compare levels of circulating cytokines in uncomplicated malaria patients infected with either P. vivax, P. falciparum, or both species and in apparently healthy controls living in the same area of endemicity and exposed to relatively low levels of malaria transmission.
MATERIALS AND METHODS
Study population.
Pretreatment venous blood samples were collected into heparinized tubes at the malaria diagnosis outpost in the rural settlement of Remansinho (see Fig. S1 in the supplemental material). This region, in the Western Amazon Basin of Brazil, is characterized by year-round hypo- to mesoendemic transmission of both P. vivax (which accounts for 80% of the local malaria burden) and P. falciparum, with rare P. malariae infections (8). The study population comprised patients infected with P. vivax (n = 43), P. falciparum (n = 19), or both species (n = 14). The clinical spectrum of malaria ranged from a very mild illness to full-blown paroxysms, but no patient had severe or complicated malaria (52). The intensity of malaria-associated illness was assessed quantitatively (25). To this end, we interviewed all patients to classify the perceived intensity of 13 common symptoms (fever, chills, sweating, headache, myalgia, arthralgia, abdominal pain, nausea, vomiting, dizziness, cough, dyspnea, and diarrhea) as absent, mild, moderate, or severe (corresponding to numerical scores of 0, 1, 2, and 3). The numerical scores were aggregated into a clinical index to rank patients according to overall symptom intensity (see the supplemental material). On-site malaria diagnosis, based on thick blood smear microscopy, was further confirmed by nested PCR with species-specific primers that target the 18S rRNA genes of P. falciparum and P. vivax (51), and parasitemias were quantified by real-time PCR (see the supplemental material). For subjects coinfected with P. vivax and P. falciparum, parasite counts for each species were summed to calculate the total parasitemia level.
We collected a second blood sample around 28 days (accepted range, 26 to 30 days) after the start of antimalarial chemotherapy from 22 P. vivax-infected subjects to evaluate cell populations and cytokines. We also collected blood samples from 18 apparently healthy subjects living in the same area who were negative for malaria parasites by both microscopy and nested PCR and thus served as malaria-exposed but noninfected controls. Full blood cell counts and hemoglobin measurements were performed at the time of blood collection, using an ABX Micro 60 automated cell counter (Horiba, Montpellier, France). Because platelet counts were not obtained for most healthy controls, comparisons of this parameter considered only malaria patients. Plasmas were obtained by centrifugation of heparinized whole-blood samples, shipped to São Paulo, Brazil, on dry ice, and stored at −70°C. Stool samples from malaria patients were examined for intestinal helminths (see the supplemental material). The demographic and clinical characteristics of the study subjects are listed in Table 1. This study was approved by the Ethical Review Board of the Institute of Biomedical Sciences of the University of São Paulo, Brazil (792/CEP). Written informed consent was obtained from all study participants or their parents or guardians.
TABLE 1.
Demographic, hematologic, and clinical characteristics of study participants
| Characteristic | Value for groupd |
P value | |||
|---|---|---|---|---|---|
| Noninfected controls | P. vivax infections | P. falciparum infections | Mixed-species infections | ||
| No. of subjectsa | 18 | 43 | 19 | 14 | |
| Age (yr) | 32 (28-42) | 29 (21-40) | 41 (21-47) | 35 (28-47) | 0.111 |
| Gender (% male) | 55.5 | 62.8 | 63.2 | 50.0 | 0.816 |
| Time (yr) of malaria exposure | 28 (20-40) | 22 (15-30) | 25 (17-35) | 31 (19-39) | 0.155 |
| Hemoglobin level (g liter−1) | 141 (123-155) | 129 (117-141) | 130 (117-138) | 128 (110-138) | 0.107 |
| Anemia (%) | 22.2 | 34.7 | 26.3 | 35.7 | 0.530 |
| No. of WBCs (109 liter−1) | 7.5 (6.2-9.9) | 5.7 (4.8-6.7) | 5.1 (4.3-6.8) | 5.8 (4.6-6.4) | 0.003b |
| No. of lymphocytes (109 liter−1) | 2.6 (1.5-4.1) | 1.1 (0.7-1.6) | 1.5 (0.8-1.9) | 1.4 (1.0-1.7) | <0.0001b |
| No. of T lymphocytes (106 liter−1) | 948 (710-1,787) | 371 (180-729) | 464 (223-772) | 418 (322-650) | <0.0001b |
| No. of CD4+ T lymphocytes (106 liter−1) | 518 (356-914) | 140 (70-282) | 172 (106-303) | 184 (95-364) | <0.0001b |
| No. of platelets (109 liter−1) | 183 (120-220) | 201 (164-234) | 223 (128-266) | 0.248 | |
| Thrombocytopenia (%) | 39.5 | 15.8 | 28.6 | 0.217 | |
| Parasitemia (no. of parasites ml−1) | 1,068 (116-4,009) | 258 (20-1,365) | 12 (2-227) | 0.003c | |
| Geometric mean parasitemia | 422 | 135 | 18 | ||
| Clinical index | 0.91 (−1.87-2.85) | 1.12 (−1.31-3.33) | −1.04 (−2.71-1.90) | 0.296 | |
| Duration of symptoms (days) | 4 (2-6) | 5 (3-10) | 4 (2-5) | 0.445 | |
T lymphocytes and CD4+ T lymphocytes were quantified for 17 noninfected controls, 39 P. vivax-infected patients, 14 P. falciparum-infected patients, and 14 mixed-infection patients.
Post hoc Dunn's multiple comparison tests showed a significant difference between noninfected controls and all groups of patients but not between groups of patients.
Post hoc Dunn's multiple comparison tests showed a significant difference between P. vivax-infected patients and mixed-infection patients only (P = 0.001).
Data are presented as medians (interquartile ranges) unless stated otherwise and were compared across three or four groups with Kruskal-Wallis tests (continuous variables) or χ2 tests (proportions). Anemia was defined when the hemoglobin concentration was below the following cutoff values: 120 g liter−1 for adolescents aged 12 to 14 years and nonpregnant women and 130 g liter−1 for men aged ≥15 years. Thrombocytopenia was defined when the platelet count was below 150 × 109 liter−1.
PBMCs.
Peripheral blood mononuclear cells (PBMCs) from malaria patients and exposed controls were separated on-site by gradient centrifugation with Ficol-Paque Plus (GE Healthcare, Little Chalfont, Buckinghamshire, United Kingdom). Isolated PBMCs were washed twice in Hanks buffer, resuspended at 107 cells ml−1 in 90% heat-inactivated fetal bovine serum (FBS) and 10% dimethyl sulfoxide, frozen to −80°C at 1°C per min in Nalgene freezing devices, and transferred to liquid nitrogen for shipping and long-term storage. On the day of flow cytometric analysis, PBMCs were thawed in a 37°C water bath, checked for viability (only samples with >85% viability were used for analysis), and resuspended to 107 cells ml−1 in RPMI 1640 medium supplemented with 25 mM sodium bicarbonate, 25 mM HEPES, 3 mM l-glutamine, and a 3% (vol/vol) solution containing 100 U ml−1 of penicillin, 10 μg ml−1 of streptomycin, and 25 μl ml−1 of amphotericin B.
Flow cytometric analysis.
Cryopreserved PBMCs were used to measure relative proportions of Treg cells and DCs, as well as patterns of costimulatory molecule expression. Thawed PBMCs were centrifuged at 250 × g for 10 min, and 106 viable cells ml−1 were transferred to V-bottomed 96-well microplates (Nunc, Roskilde, Denmark) in 170 μl of staining buffer (phosphate-buffered saline [PBS] with 2% FBS [Gibco, Carlsbad, CA] and 2 mm EDTA) for surface staining with directly conjugated antibodies. Cells were incubated at 4°C in darkness for 30 min, washed twice with staining buffer, and then resuspended in 100 μl of fixation buffer (1% paraformaldehyde in PBS). The following labeled murine monoclonal antibodies (all from BD Biosciences, San Jose, CA) were used for Treg cell surface staining: anti-CD3 (clone SK7) labeled with phycoerythrin-carbocyanin (PE-Cy7), anti-CD4 (clone SK4) labeled with peridinin chlorophyll protein (PerCP), anti-CD25 (clone 2A3) labeled with phycoerythrin (PE), and anti-cytotoxic T-cell-associated antigen 4 (CTLA-4; also known as CD152) (clone BNI3) labeled with allophycocyanin (APC). Surface DC markers were characterized with the following murine monoclonal antibodies: dump cocktail lineage 1 (anti-CD3, anti-CD14, anti-CD16, anti-CD20, and anti-CD56 antibodies [clones SK7, MϕP9, 3G8, SJ25C1, L27, and NCAM-16.2]) labeled with fluorescein isothiocyanate (FITC), anti-CD123 (clone 9F5) labeled with PE, anti-CD86 (clone 2331) labeled with PE-Cy7 (all of the above from BD Biosciences), anti-CD11c (clone 3.9) labeled with APC (eBioscience, San Diego, CA), and anti-HLA-DR (clone L243/G46-6) labeled with Alexa 700 (Biolegend, San Diego, CA). For Foxp3 expression analysis, cells were permeabilized with a Foxp3 permeabilization/fixation kit and stained with a murine FITC-labeled anti-Foxp3 monoclonal antibody (clone PCH101), all from eBioscience, according to the manufacturer's instructions. All cells were analyzed by flow cytometry using a two-laser FACSCanto instrument running FACS-DIVA software (BD Biosciences). Anti-mouse IgG-coated beads (BD Biosciences) were stained with each fluorochrome separately and used for software-based compensation. At least 100,000 events in a live gate were collected. The gating strategy used to characterize Treg cells and DCs is illustrated in Fig. S2 and S3 in the supplemental material. Data analysis was carried out using FlowJo software (Tree Star, San Carlo, CA).
Cytokine determination.
Pretreatment and convalescent-phase plasma samples were examined for tumor necrosis factor alpha (TNF-α), IFN-γ, IL-4, IL-10, IL-12, and TGF-β by use of OptEIA capture enzyme-linked immunosorbent assay (ELISA) kits (BD Biosciences) according to the manufacturer's instructions. All specimens were measured in duplicate, and the averages for 2 values were obtained.
Statistical analysis.
Because most continuous variables (absolute cell numbers and proportions and cytokine levels) had an overdispersed distribution, results were summarized as medians and interquartile ranges (IQR) and compared across malaria patient groups and nonexposed controls, using nonparametric Kruskal-Wallis or Mann-Whitney tests (continuous variables) or χ2 tests (proportions). When the Kruskal-Wallis test indicated a significant difference (P < 0.05) among groups, post hoc Dunn's multiple comparison tests were carried out to determine where the differences lay. Paired data were compared with Wilcoxon signed rank tests (continuous variables) or McNemar tests (proportions). Correlations were analyzed using Spearman rank correlation tests. All analyses were performed using SPSS 16.0 software (SPSS, Chicago, IL), with statistical significance set at the 5% level.
RESULTS
Characteristics of study subjects.
Patients infected with P. vivax or P. falciparum, those coinfected with both species, and the healthy local controls were all comparable in age, gender, length of exposure to malaria transmission, median hemoglobin concentration, and prevalence of anemia (Table 1). Both malaria parasite species induced significant decreases in the numbers of circulating white blood cells (WBCs), lymphocytes, T lymphocytes (CD3+ PBMCs), and CD4+ T lymphocytes (CD3+ CD4+ PBMCs) (Table 1) (26, 31, 47), possibly due to their reallocation to lymph nodes during acute infection (11). The parasite counts determined by quantitative real-time PCR were usually low (range, 0.1 to 19,000 parasites μl−1), with the highest and lowest geometric means for P. vivax-only and mixed-species malaria, respectively (Table 1). Among 13 mixed-species infections analyzed, P. vivax parasitemia was higher in 7 cases and P. falciparum predominated in 6 cases. No patient with severe or complicated disease was enrolled in the study; the overall intensities of malaria-related symptoms (estimated by the clinical index), the median platelet counts, and the prevalence of thrombocytopenia were all similar among infected subjects, regardless of the infecting malaria parasite. T-lymphocyte counts (r = −0.595) and CD4+ T-lymphocyte counts (r = −0.508) were negatively correlated with parasitemia among infected subjects (P < 0.0001 for both). In contrast, no significant correlation was found between the clinical index and overall parasitemias (in all patients) or species-specific parasite counts (in monoinfected patients). Two patients harbored intestinal nematodes at the time of enrollment: one P. vivax-infected subject harbored Ascaris lumbricoides, and one P. falciparum-infected subject harbored Strongyloides stercoralis and hookworm.
Treg cells during acute malaria.
CD25+ Foxp3+ cells comprised similar proportions (1.9 to 2.6%) of circulating CD4+ cells in infected and noninfected subjects. However, malaria patients had lower absolute numbers of Treg cells than controls did (Table 2), because of their lower overall CD4+ cell counts. The CD25+ Foxp3+ Treg cell counts were inversely proportional to parasitemias (r = −0.450; P < 0.0001). We next examined the number and proportion of circulating CD4+ CD25+ Foxp3+ Treg cells that expressed CTLA-4, a molecule that is critically involved in Treg cell-mediated suppression of immune responses (44), on the surface (the gating strategy is shown in the lower panel of Fig. S2 in the supplemental material). Malaria patients had a larger number and proportion of CTLA-4-expressing Treg cells than did noninfected controls, regardless of the infecting parasite species (Table 2). This expanded CTLA-4+ population may have comprised new Treg cells that were released in the peripheral blood during the acute malaria episode or already existing, circulating Treg cells that were previously CTLA-4−. The proportion of circulating CTLA-4+ Treg cells correlated positively with parasite counts in P. vivax and P. falciparum (although weakly) monoinfections, but no such correlation was found for patients coinfected with both species, who typically had lower parasitemias (Fig. 1; see Fig. S4 in the supplemental material). The proportion of CTLA-4+ Treg cells did not correlate with the intensity of malaria-related symptoms. Therefore, we characterized a parasite density-dependent expansion, in both P. vivax and P. falciparum infections, of the Treg cell subset expressing the key immunomodulatory molecule CTLA-4 on the surface.
TABLE 2.
Numbers and proportions of circulating Treg cells and dendritic cells in study participants
| Characteristic | Value for groupf |
P value | |||
|---|---|---|---|---|---|
| Noninfected controls | P. vivax infections | P. falciparum infections | Mixed-species infections | ||
| No. of CD4+ CD25+ Foxp3+ Treg cells (106 liter−1) | 10.4 (6.6-16.9) | 3.7 (1.6-5.8) | 4.4 (2.8-6.8) | 5.0 (2.6-9.4) | <0.0001a |
| % CD25+ Foxp3+ cells among CD4+ cells | 1.9 (1.4-2.3) | 2.0 (1.6-5.8) | 2.6 (2.2-4.2) | 2.5 (1.8-3.1) | 0.064 |
| No. of CTLA-4+ Treg cells (103 liter−1) | 200 (70-230) | 350 (70-1,010) | 430 (230-1,200) | 870 (440-1,280) | <0.0001a |
| % CTLA-4+ cells among Treg cells | 1.8 (0.4-2.6) | 12.3 (4.1-33.8) | 13.1 (3.9-14.5) | 15.7 (13.6-20.6) | <0.0001a |
| % CTLA-4+ cells among CD4+ T cells | 0.4 (0.2-0.5) | 1.1 (0.4-1.3) | 1.7 (0.9-2.7) | 2.1 (0.9-3.2) | <0.0001a |
| % CTLA-4+ cells among CD4+ CD25+ Foxp3− cells | 2.8 (2.2-3.3) | 2.8 (1.4-3.5) | 6.5 (3.2-7.4) | 7.1 (4.8-9.2) | <0.0001b |
| No. of DCs (106 liter−1) | 31.7 (20.6-44.1) | 13.8 (7.9-24.5) | 17.6 (8.8-29.1) | 22.3 (14.0-31.9) | 0.001c |
| % DCs among PBMCs | 1.1 (0.8-1.4) | 1.0 (0.9-1.2) | 1.0 (0.7-1.3) | 1.2 (0.9-1.4) | 0.459 |
| No. of myeloid (CD11c+) DCs (106 liter−1) | 17.2 (10.8-21.9) | 6.8 (2.9-12.5) | 6.7 (4.8-15.3) | 11.7 (5.3-16.1) | 0.005d |
| % CD11c+ DCs among total DCs | 50.8 (43.6-56.9) | 50.6 (31.1-61.1) | 44.8 (31.1-62.7) | 47.9 (34.4-62.7) | 0.865 |
| No. of plasmacytoid (CD123+) DCs (106 liter−1) | 2.0 (1.3-3.8) | 2.6 (1.2-5.3) | 1.9 (0.8-4.5) | 4.9 (2.4-7.3) | 0.135 |
| % CD123+ DCs among total DCs | 8.5 (4.0-11.2) | 24.5 (14.3-35.5) | 15.9 (4.0-31.1) | 21.4 (15.7-33.3) | <0.0001a |
| Myeloid/plasmacytoid DC ratio | 5.5 (4.3-16.4) | 1.8 (1.2-4.4) | 3.5 (1.3-10.9) | 2.2 (0.9-4.3) | 0.001e |
| No. of subjects | 17 | 39 | 14 | 14 | |
Significant difference between noninfected controls and all groups of patients but not between groups of patients.
Significant differences between P. falciparum-infected patients and noninfected controls(P < 0.05), between mixed-species-infected patients and noninfected controls (P < 0.01), between P. falciparum-infected patients and P. vivax-infected patients (P < 0.001), and between mixed-species-infected patients and P. vivax-infected patients (P <0.001).
Significant differences between P. vivax-infected patients and noninfected controls (P < 0.001) and between P. falciparum-infected patients and noninfected controls (P <0.05).
Significant differences between noninfected controls and all groups of patients (P < 0.001), between P. vivax-infected and mixed-infection patients (P < 0.001), and between P. falciparum-infected and mixed-infection patients (P < 0.01).
Significant differences between P. vivax-infected patients and noninfected controls (P < 0.001) and between mixed-infection patients and noninfected controls (P < 0.01).
Data are presented as medians (interquartile ranges) and were compared across four groups with Kruskal-Wallis tests. Results of post hoc Dunn's multiple comparison tests are indicated in the other footnotes.
FIG. 1.

Correlation between parasitemia and the proportion (%) of CTLA-4-expressing Treg cells in P. vivax-infected patients (circles; n = 39), P. falciparum-infected patients (triangles; n = 14), and patients coinfected with both species (squares; n = 13). The gating strategy to characterize CTLA-4+ Treg cells is shown in the supplemental material. Parasitemia in P. vivax-infected patients was strongly correlated with the proportion of CTLA-4+ cells among Treg cells (r = 0.419; P = 0.008). When P. falciparum-infected patients were added to the Spearman correlation model, the coefficient of correlation remained nearly unchanged (r = 0.400; P = 0.003). However, the overall correlation was substantially attenuated (r = 0.277; P = 0.024) when patients coinfected with both species were added to the model. Therefore, parasitemia was strongly correlated with the proportion (%) of CTLA-4-expressing Treg cells in single-species infections (with either P. vivax or P. falciparum) but not in mixed-species infections. Figure S4 in the supplemental material shows data for P. vivax, P. falciparum, and mixed-species infections in three separate plots.
Because the Treg cell population is known to expand gradually over the first few days of malarial infection, we next examined whether the duration of clinical symptoms prior to blood collection correlated with Treg cell numbers. The median duration of symptoms did not differ according to the infecting species (Table 1), and no significant correlation was found between the duration of symptoms and the number or proportion of circulating CD4+ CD25+ Foxp3+ Treg cells and CTLA-4-expressing Treg cells.
A large population of CTLA-4-expressing T cells that were not necessarily Treg cells was recently found in the peripheral blood of acute malaria patients (42). We thus analyzed the surface expression of CTLA-4 in non-Treg-cell populations. In fact, the overall proportion of circulating CD4+ T cells that were CTLA-4+ increased from 0.4% in noninfected controls to >1.0% in malaria patients (Table 2). Moreover, P. falciparum (either alone or coinfecting with P. vivax) induced a significant increase in the subpopulation of circulating CD4+ CD25+ Foxp3− cells that expressed CTLA-4 on the surface (the gating strategy is shown in the upper panel of Fig. S2 in the supplemental material), suggesting that the immunoregulatory effect of CTLA-4 during human malaria may also be exerted by circulating CD4+ T cells without the classical Treg phenotype.
DCs during acute malaria.
About 1% of PBMCs from infected subjects and healthy controls were characterized phenotypically as lineage 1-negative and HLA-DR-positive DCs (15). The absolute number, but not the proportion, of PBMCs that were phenotyped as DCs was significantly diminished in P. vivax and P. falciparum monoinfections; no difference was observed when subjects with mixed-species infections were compared to healthy controls (Table 2). The two major DC subsets, characterized phenotypically by the surface expression of CD11c and CD123, were affected differently by malaria infection. Malaria induced a clear increase in the proportion of circulating DCs with the plasmacytoid (CD123+) phenotype compared to that in controls; as a consequence, we observed a significant decrease in the myeloid/plasmacytoid DC ratio in infected subjects (Table 2). The proportion of DCs with the plasmacytoid phenotype correlated positively with parasitemia in P. vivax or P. falciparum monoinfections but not in patients coinfected with both species (Fig. 2). Therefore, P. vivax and P. falciparum infections elicited similar changes in the peripheral population of DCs, to an extent that was proportional to the level of parasitemia.
FIG. 2.
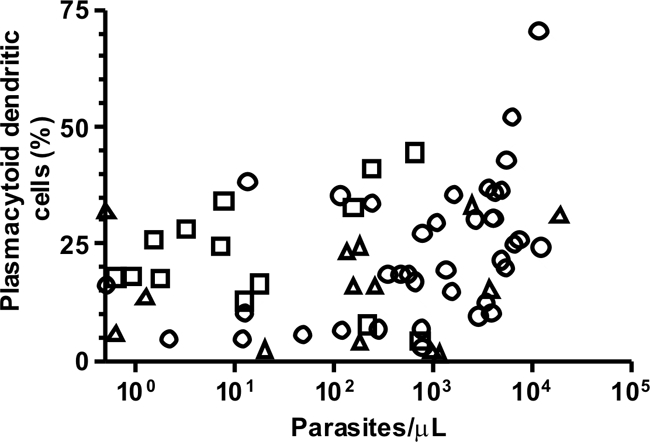
Correlation between parasitemia and proportion of DCs that were phenotypically characterized as plasmacytoid (CD123+) DCs in P. vivax-infected patients (circles; n = 38), P. falciparum-infected patients (triangles; n = 15), and patients coinfected with both species (squares; n = 13). The gating strategy to characterize CD123+ DCs is shown in the supplemental material. Parasitemia in P. vivax-infected patients was significantly correlated with the proportion of CD123+ cells among DCs (r = 0.371; P = 0.022). When P. falciparum-infected patients were added to the Spearman correlation model, the coefficient of correlation changed little (r = 0.304; P = 0.027). However, the overall correlation was substantially attenuated (r = 0.215; P = 0.084) when patients coinfected with both species were added to the model. Therefore, parasitemia was positively correlated with the proportion (%) of CD123+ DCs in single-species infections (with either P. vivax or P. falciparum) but not in mixed-species infections. Figure S5 in the supplemental material shows data for P. vivax, P. falciparum, and mixed-species infections in three separate plots.
Maturation status of circulating DCs during acute malaria.
Different malaria parasites and their products have been reported to either stimulate or suppress DC maturation (29, 53), a process characterized by increased expression of costimulatory molecules, such as CD80 and CD86, HLA-DR, and adhesive molecules (1). We next compared the proportions of circulating myeloid and plasmacytoid DCs that expressed the maturation marker CD86, a molecule that interacts with CTLA-4 on the surfaces of Treg cells, in infected subjects and healthy controls. Most circulating DCs from subjects infected with P. falciparum (alone or mixed with P. vivax) and healthy controls were CD86+, but the proportion of phenotypically mature DCs had a clearly bimodal distribution in vivax malaria patients. Two-thirds of them had large proportions of CD86+ myeloid and plasmacytoid DCs, while others had few, if any, CD86+ DCs detectable in their peripheral blood (Fig. 3, upper panels). Therefore, P. vivax seems to suppress the maturation of both DC subsets in selected patients, an effect that we did not observe in patients infected with P. falciparum alone or coinfected with P. falciparum and P. vivax. This suppressive effect on CD86 expression was not parasite density dependent, since parasite counts did not correlate with the proportion of CD86+ myeloid and plasmacytoid DCs. Interestingly, reduced proportions of both CD86+ myeloid and plasmacytoid DCs were found in the same patients, suggesting a common mechanism downregulating the maturation of both DC subpopulations. The vivax malaria patients with normal and decreased DC maturation were comparable in age, gender, length of exposure to malaria, and CD4+ CD25+ Foxp3+ Treg cell counts (P > 0.05; Mann-Whitney test). However, patients with few CD86+ DCs also had few circulating CTLA-4+ Treg cells (Fig. 3, lower panels), arguing for a link (although not necessarily a causal relationship) between circulating CTLA-4+ Treg cells and DC maturation in P. vivax infection.
FIG. 3.

Proportions of phenotypically mature (CD86-expressing) DCs in P. vivax-infected study participants and their association with the number of circulating CTLA-4-expressing T regulatory cells. In the upper panels, P. vivax-infected subjects (n = 38) are distributed according to the proportions of circulating myeloid (left) and plasmacytoid (right) DCs that express the costimulatory molecule CD86. The gating strategy to characterize CD86+ DCs is shown in Fig. S5 of the supplemental material. The x axis represents the proportion (%) of DCs that express high levels of CD86 on the surface, and the y axis shows the absolute number of patients. For example, 9 and 15 patients had <10% of their circulating myeloid and plasmacytoid DCs, respectively, expressing high levels of CD86 (first bar, from left to right, in the plots in the upper panels). Note that for both myeloid and plasmacytoid DCs, the distribution of subjects according to CD86 expression levels in their DCs was bimodal, with two subgroups of subjects clearly defined according to the maturation status of their peripheral blood DCs. In the lower panels, we compare the absolute numbers of circulating CTLA-4-expressing T regulatory cells in these subgroups of subjects with small and large proportions of circulating phenotypically mature myeloid (left) and plasmacytoid (right) DCs. The difference in CTLA-4-expressing T regulatory cell counts was highly significant in both comparisons (P < 0.0001; Mann-Whitney test).
Cytokines during acute malaria.
Plasma levels of IFN-γ, TNF-α, and IL-10 and the IL-10/TNF-α ratio were increased in one or more groups of patients relative to those in noninfected controls (Table 3). Note that the increases in IL-10 and the IL-10/TNF-α ratio were directly proportional to parasite counts in P. vivax monoinfections (r = 0.659 and 0.678, respectively; P < 0.0001 for both) and in all infections, regardless of the malaria parasite species (r = 0.697 and 0.544, respectively; P < 0.0001 for both correlations). Only IL-10 levels and the IL-10/TNF-α ratio were significantly correlated with the overall clinical index (r = 0.255 and 0.245, respectively; P = 0.027 and 0.034, respectively), regardless of the species of infecting parasites. IFN-γ levels correlated significantly with levels of parasitemia (r = 0.284; P = 0.014), while TNF-α concentrations correlated neither with parasite counts nor with the clinical index. Because IL-10 levels correlated negatively with the numbers of circulating WBCs (r = −0.340; P = 0.003), lymphocytes (r = −0.694; P < 0.0001), T lymphocytes (r = −0.632; P < 0.0001), and CD4+ T lymphocytes (r = −0.540; P < 0.0001) in infected subjects, we also found a significant negative correlation between CD4+ CD25+ Foxp3+ Treg cell counts and IL-10 levels (r = −0.461; P < 0.0001). No such correlation was observed, however, between IL-10 levels and the number or proportion of CTLA-4+ Treg cells. Levels of IFN-γ also correlated negatively with the absolute numbers of lymphocytes (r = −0.355; P = 0.002), T lymphocytes (r = −0.465; P < 0.0001), CD4+ T lymphocytes (r = −0.395; P = 0.001), and CD4+ CD25+ Foxp3+ Treg cells (r = −0.269; P = 0.029) in malaria patients. Therefore, malaria parasites induced an increase in IL-10, TNF-α, and IFN-γ levels, which co-occurred with changes in peripheral blood cell populations but did not associate with the expansion of the CTLA-4+ subset of Treg cells observed during acute infections.
TABLE 3.
Plasma levels of cytokines in study participants
| Characteristic | Value for groupd |
P value | |||
|---|---|---|---|---|---|
| Noninfected controls | P. vivax infections | P. falciparum infections | Mixed-species infections | ||
| Cytokine concn (pg ml−1) | |||||
| IL-4 | 1.9 (1.7-2.5) | 2.9 (2.4-3.6) | 2.8 (2.0-3.6) | 2.9 (2.5-3.0) | 0.066 |
| IL-12 | 30.8 (28.4-50.6) | 44.9 (30.1-75.1) | 66.7 (37.0-83.4) | 42.6 (26.2-61.7) | 0.125 |
| IFN-γ | 5.4 (3.1-8.5) | 8.3 (3.7-14.2) | 27.2 (6.6-133.5) | 4.4 (3.0-9.9) | 0.005a |
| TNF-α | 3.8 (3.0-4.3) | 5.2 (4.3-7.6) | 7.8 (4.7-20.9) | 6.5 (3.4-13.8) | <0.0001b |
| IL-10 | 6.2 (4.4-9.1) | 176.4 (23.6-455.6) | 56.8 (21.0-103.5) | 24.5 (6.5-68.1) | <0.0001c |
| TGF-β | 379 (178-1,440) | 457 (290-773) | 593 (392-1,107) | 502 (364-1,707) | 0.603 |
| IL-10/TNF-α ratio | 1.65 (1.25-1.95) | 18.99 (4.21-93.37 | 5.52 (1.06-21.38) | 2.24 (1.57-7.82) | <0.0001c |
| No. of subjects | 18 | 42 | 19 | 14 | |
Significant differences between noninfected controls and P. falciparum-infected patients(P < 0.05) and between P. falciparum-infected and mixed-infection patients(P < 0.05).
Significant differences between noninfected controls and all groups of patients (P values of <0.05 to <0.001) but not between groups of patients.
Significant differences between noninfected controls and P. vivax-infected patients (P < 0.001) and between noninfected controls and P. falciparum-infected patients (P < 0.01).
Data are presented as medians (interquartile ranges) and were compared across four groups with Kruskal-Wallis tests. Results of post hoc Dunn's multiple comparison tests are indicated in the other footnotes.
We next explored the association between levels of circulating cytokines and other hematological abnormalities observed in our malaria patients, namely, anemia and thrombocytopenia. TNF-α concentrations (but not IL-10 levels or IL-10/TNF-α ratios) were slightly but significantly increased in anemic patients relative to those in nonanemic patients (see Table S1 in the supplemental material). IL-12, IL-10, and IFN-γ levels and the IL-10/TNF-α ratio were increased, and TNF-α levels were decreased, in thrombocytopenic patients. The IL-10/TNF-α ratio was also increased in thrombocytopenic patients (see Table S2 in the supplemental material). These findings point to IL-10 (6) and an IL-10/TNF-α imbalance as major contributors to malaria-related thrombocytopenia, a common complication of P. vivax and P. falciparum infections (30), although other cytokines may also be involved (35). Levels of IL-10, TGF-β, and IFN-γ were also negatively correlated with the total number of circulating DCs and the number of circulating CD11c+ DCs in infected subjects (r values were between −0.270 and −0.749, with P values ranging between 0.028 and <0.0001), suggesting that the cytokine environment might contribute to the decreased peripheral circulation of DCs during acute malaria. Nevertheless, because both IL-10 and IFN-γ concentrations and the number of circulating DCs correlate with each other and with parasite counts, it remains unclear whether cytokines, levels of parasitemia, or both are independently associated with changes in peripheral DC populations during acute malaria.
Treg cells, DCs, and cytokines after antimalarial chemotherapy.
To determine whether changes observed in peripheral WBC populations and cytokine levels during acute malaria lasted after parasites were cleared by chemotherapy, we compared 22 pairs of acute-phase and convalescent-phase samples from P. vivax malaria patients given standard chloroquine-primaquine treatment. All convalescent-phase samples, collected 28 ± 2 days after the start of chemotherapy, were negative for malaria parasites by PCR. The posttreatment median numbers of circulating WBCs, lymphocytes, T lymphocytes, CD4+ T lymphocytes, total DCs, DC subsets, and platelets, as well as the hemoglobin levels, increased to the ranges observed in healthy, noninfected controls living in the same area (compare Tables 1 and 4) (35, 50). However, the absolute numbers and proportions of CD4+ CD25+ Foxp3+ Treg cells and CTLA-4+ Treg cells remained nearly unchanged after chemotherapy. Accordingly, the CTLA-4+ Treg cell subset remained expanded and accounted for a median of 5.2% of CD4+ CD25+ Foxp3+ cells in convalescent subjects (Table 4), compared to 1.8% in noninfected controls (Table 1). The overall proportion of CTLA-4+ CD4+ T cells decreased after chemotherapy, to levels similar to those found in noninfected controls (compare Tables 1 and 4). The proportion of DCs with the plasmacytoid phenotype, the myeloid/plasmacytoid DC ratio, and the maturation status of myeloid and plasmacytoid DCs, as determined by the proportion of CD86+ cells, were all quite similar in paired acute-phase and convalescent-phase blood samples, suggesting that some changes in DC populations induced by P. vivax malaria persisted after treatment.
TABLE 4.
Numbers of circulating Treg cells and dendritic cells and cytokine levels in acute-phase and convalescent-phase blood samples from P. vivax-infected study participants
| Variable | Valuea |
No. of paired samples | P value | |
|---|---|---|---|---|
| Acute-phase samples | Convalescent-phase samples | |||
| Hemoglobin level (g liter−1) | 129 (65-162) | 134 (96-153) | 22 | 0.030 |
| Prevalence of anemia (%) | 40.9 | 18.1 | 22 | 0.062 |
| No. of WBCs (109 liter−1) | 5.5 (4.4-6.7) | 7.0 (5.6-8.2) | 22 | 0.003 |
| No. of lymphocytes (109 liter−1) | 0.9 (0.6-1.4) | 1.9 (1.6-2.1) | 22 | <0.0001 |
| No. of T lymphocytes (106 liter−1) | 371 (166-644) | 757 (539-903) | 21 | 0.004 |
| No. of CD4+ T lymphocytes (106 liter−1) | 144 (62-293) | 232 (177-406) | 21 | 0.035 |
| No. of platelets (109 liter−1) | 191 (70-286) | 292 (153-407) | 22 | <0.0001 |
| Prevalence of thrombocytopenia (%) | 22.7 | 0 | 22 | |
| No. of CD4+ CD25+ Foxp3+ Treg cells (106 liter−1) | 3.9 (1.3-8.6) | 4.6 (2.5-10.2) | 21 | 0.520 |
| % CD25+ Foxp3+ cells among CD4+ cells | 2.2 (1.9-3.8) | 1.9 (1.1-2.4) | 21 | 0.085 |
| No. of CTLA-4+ Treg cells (103 liter−1) | 289 (99-507) | 407 (124-781) | 21 | 0.414 |
| % CTLA-4+ cells among Treg cells | 7.4 (4.0-20.6) | 5.2 (3.1-16.4) | 21 | 0.305 |
| % CTLA-4+ cells among CD4 T cells | 1.1 (0.4-1.3) | 0.5 (0.2-1.4) | 20 | 0.004 |
| No. of DCs (106 liter−1) | 9.9 (7.6-18.0) | 28.8 (20.7-34.5) | 21 | 0.001 |
| % DCs among PBMCs | 0.9 (0.6-1.1) | 1.4 (1.1-1.4) | 21 | 0.038 |
| No. of myeloid (CD11c+) DCs (106 liter−1) | 4.5 (1.8-10.1) | 17.3 (11.9-21.4) | 21 | 0.001 |
| % CD11c+ DCs among total DCs | 45.5 (32.7-60.3) | 60.6 (54.7-64.2) | 21 | 0.007 |
| No. of plasmacytoid (CD123+) DCs (106 liter−1) | 2.4 (1.0-5.0) | 5.8 (4.6-9.7) | 21 | 0.004 |
| % CD123+ DCs among total DCs | 24.2 (16.7-36.0) | 23.7 (18.7-30.5) | 21 | 0.507 |
| Myeloid/plasmacytoid DC ratio | 2.5 (1.8-3.4) | 2.6 (1.8-3.9) | 21 | 0.376 |
| Cytokine level (pg ml−1) | ||||
| IL-4 | 3.0 (2.3-4.0) | 5.5 (3.9-6.4) | 19 | 0.002 |
| IL-12 | 49.3 (30.2-74.4) | 33.4 (27.0-43.8) | 19 | 0.027 |
| IFN-γ | 7.6 (3.8-19.8) | 3.0 (2.7-5.2) | 19 | 0.013 |
| TNF-α | 5.2 (4.6-8.5) | 4.2 (3.4-6.5) | 19 | 0.044 |
| IL-10 | 260.1 (53.5-627.3) | 4.8 (4.2-8.8) | 19 | <0.0001 |
| TGF-β | 447 (318-717) | 410 (311-797) | 19 | 0.748 |
| IL-10/TNF-α ratio | 43.4 (7.9-96.7) | 1.3 (0.7-1.5) | 19 | <0.0001 |
Data are presented as medians (interquartile ranges), except for prevalence data (presented as percentages), and were compared with Wilcoxon tests (continuous variables) or McNemar tests (proportions). Anemia and thrombocytopenia were defined as in Table 1. The prevalences of thrombocytopenia were not compared because of the zero value for convalescent patients.
Plasma levels of IL-12, IL-10, IFN-γ, and TNF-α significantly decreased, and those of IL-4 increased, after chemotherapy (Table 4). The nearly 50-fold difference in IL-10 levels in paired samples collected 28 days apart is particularly remarkable and mirrors the pattern previously described for P. falciparum infections (27). To what extent these changes were elicited by parasite clearance alone is uncertain, since chloroquine itself is known to inhibit the production of IFN-γ, TNF-α, and other cytokines by stimulated PBMCs, possibly by blocking Toll-like receptor (TLR)-mediated signaling pathways required for antigen presentation (reviewed in reference 23).
DISCUSSION
Here we examine Treg cell and DC numbers and kinetics in uncomplicated malaria patients exposed to relatively low levels of transmission. We describe significant changes in the peripheral populations of Treg cells expressing the key immunomodulatory molecule CTLA-4 and of DCs during acute infections, with potential implications for the pathogenesis of malaria and the acquisition of long-lasting protective immunity to malaria.
The expansion of the CTLA-4+ Treg cell population described in this study was similar in magnitude in P. vivax and P. falciparum infections and in coinfections with both species, correlated with parasite density in single-species infections, and persisted after P. vivax clearance following chloroquine-based chemotherapy. Parasite density-dependent expansions of Treg cells during acute uncomplicated and severe falciparum malaria have been found previously in adults from Indonesia (regulatory phenotype defined as CD4+ CD25+ Foxp3+ CD127low) (33) but not in children from Gambia (regulatory phenotype defined as CD4+ Foxp3+ CD127−/low) (50), suggesting that the host's age, cumulative exposure to malaria, or both may influence the peripheral circulation of Treg cells. Adults with uncomplicated P. vivax infections were also found to have increased proportions of CD4+ CD25+ Foxp3+ Treg cells in Thailand (22) and Brazil (4). Since the levels of CTLA-4 expression on the surfaces of Treg cells reflect their activation status (21), it is unfortunate that the subset of circulating Treg cells expressing CTLA-4 on the surface was not quantified in these previous studies. The immunomodulatory effects of CTLA-4-expressing CD4+ CD25+ Foxp3+ cells may not be transient in vivax malaria patients, since the absolute and relative numbers of these cells remained elevated after chemotherapy, with potential implications for the development of immune responses to both parasite-derived and unrelated antigens (17). Furthermore, we found that the peripheral population of CD4+ CD25+ cells expressing CTLA-4 during acute human malaria comprised not only classical (Foxp3+) Treg cells but also a sizeable subset of Foxp3− cells that may potentially play an immunoregulatory role. Similar findings were recently reported for experimental murine malaria (20, 46).
During acute malaria infections, DCs capture infected red blood cells and parasite products, such as soluble antigens. Antigen uptake leads to DC maturation and activation, with upregulation of major histocompatibility complex (MHC) class II antigens and costimulatory molecules and production of proinflammatory cytokines (1). Circulating DCs are affected by malaria parasites in two ways. First, we describe that acute P. vivax and P. falciparum infections induced a significant increase in the proportion of DCs that were CD123+ (although the absolute numbers of circulating DCs with this phenotype remained unchanged), with a consequent decrease in the myeloid/plasmacytoid DC ratio (22). These changes were proportional to parasite loads in single-species infections and may drive immune responses to the less inflammatory Th2-type pathway (39). The posttreatment numbers of circulating DCs and subsets returned to the range observed in healthy controls living in the same area, but the myeloid/plasmacytoid DC ratio did not change significantly after P. vivax clearance. It is currently unknown whether these changes in circulating DC populations mirror what happens to DC populations in lymphoid tissues or merely reflect a redistribution of circulating cells to the spleen, lymph nodes, or other organs.
We showed that P. vivax may also suppress DC maturation, while P. falciparum alone or coinfections with P. falciparum and P. vivax had no such effect. The fact that different malaria parasite species may affect DC biology in opposite directions is well known from murine models and ex vivo experiments (29, 53), but we provide the first evidence that P. vivax infection affects the maturation status of circulating DCs in selected patients, an effect that persists after parasite clearance. Since mature forms of P. falciparum were shown to prevent monocyte-derived DC maturation by adhering to the class B scavenger receptor CD36, human and rodent malaria parasites have been described to either enhance or downregulate DC maturation and activation, depending on the time course of infection, the antigen dose, and the cytokine environment in which antigen uptake occurs (29, 53). Although P. vivax was recently found to bind to endothelial receptors such as chondroitin sulfate A (CSA) and intercellular adhesion molecule 1 (ICAM-1), no evidence that this parasite binds to CD36 has been found so far (5), ruling out a CD36-dependent mechanism for the observed parasite-mediated suppression of DC maturation.
The lowest level of expression of the costimulatory molecule CD86 on the surfaces of circulating DCs was found in P. vivax-infected patients with small proportions of circulating CTLA-4-expressing CD4+ CD25+ Foxp3+ Treg cells. Treg cell-mediated immunoregulatory activity in vitro involves an interaction between CTLA-4 and the costimulatory molecules CD80 and CD86 on DCs, which in turn downregulate the surface expression of both CD80 and CD86 by DCs (34). We thus expected, in contrast to what we found, that the number of circulating CTLA-4+ Treg cells would correlate negatively with CD86 expression levels on DCs. However, the interaction between CTLA-4-expressing Treg cells and mature, CD86-expressing DCs may also result in expansion of the pool of circulating Treg cells when the appropriate cytokine environment is provided (41). We therefore speculate that the required stimulus for Treg cell expansion in the peripheral blood was lacking in some P. vivax-infected patients, because of the decreased number of CD86-expressing circulating DCs, leading to reduced numbers and proportions of CTLA-4+ Treg cells.
Plasma levels of IFN-γ, TNF-α, and IL-10 were increased in one or more groups of acute-phase patients. Cytokine levels correlated with changes in hemoglobin levels and lymphocyte and platelet counts, but not with the expansion of the CTLA-4+ subset of Treg cells observed during acute infections, and decreased substantially in vivax malaria patients after chemotherapy with chloroquine. We and others (12) failed to confirm previous observations of extremely high levels of circulating proinflammatory cytokines in vivax malaria patients, close to those usually found in P. falciparum-infected cerebral malaria patients (32). In fact, the balance between pro- and anti-inflammatory responses tended to differ between P. vivax and P. falciparum infections, in opposite directions, with the highest IL-10/TNF-α ratio observed in vivax malaria patients. Interestingly, increased levels of proinflammatory cytokines and chemokines may potentially affect red blood cell invasion by blocking the interaction between P. vivax merozoites and their receptor on target cells (reticulocytes). The domain on the Duffy antigen receptor for chemokines (DARC) that serves as a receptor for parasite invasion is also used to remove inflammatory cytokines from the blood circulation; IL-8, for example, can block parasite binding to Duffy-positive red blood cells, likely because of overlapping binding domains (7). However, here we found no evidence that the bias toward anti-inflammatory cytokines in vivax malaria translates to lower levels of parasitemia and milder clinical manifestations.
We concluded that uncomplicated malaria with P. vivax and P. falciparum induces similar changes in the absolute numbers and proportions of circulating populations of Treg cells and DCs that may affect the development of protective immunity to both species. However, we described impaired maturation of circulating DCs only for P. vivax patients, who also had a less inflammatory cytokine response. We are currently carrying out cohort studies to investigate to what extent these between-species differences influence disease expression and acquired immunity in populations exposed to relatively low levels of transmission of both major human malaria parasites.
Supplementary Material
Acknowledgments
We thank the population of Remansinho for their enthusiastic participation in this study; Raquel Hoffmann Panatieri, Simone Ladeia Andrade, Paulo Rufalco Moutinho, and Bianca Cechetto Carlos for their valuable help during fieldwork; and Maria José Menezes for her continuous laboratory support.
This research was supported by Fundação de Amparo à Pesquisa do Estado de São Paulo (FAPESP; research grants 07/52771-0 and 08/50645-0 to M.U.F. and scholarships to R.M.G. and K.K.G.S.) and Conselho Nacional de Desenvolvimento Científico e Tecnológico (CNPq; research grant 470195/2008-8 to M.U.F. and scholarships to K.C.S., A.M.S., E.G.K., and M.U.F.).
Editor: J. H. Adams
Footnotes
Published ahead of print on 16 August 2010.
Supplemental material for this article may be found at http://iai.asm.org/.
REFERENCES
- 1.Banchereau, J., F. Briere, C. Caux, J. Davoust, S. Lebecque, Y. J. Liu, B. Pulendran, and K. Palucka. 2000. Immunobiology of dendritic cells. Annu. Rev. Immunol. 18:767-811. [DOI] [PubMed] [Google Scholar]
- 2.Braga, E. M., L. H. Carvalho, C. J. Fontes, and A. U. Krettli. 2002. Low cellular response in vitro among subjects with long-term exposure to malaria transmission in Brazilian endemic area. Am. J. Trop. Med. Hyg. 66:299-303. [DOI] [PubMed] [Google Scholar]
- 3.Breitling, L. P., R. Fendel, B. Mordmueller, A. A. Adegnika, P. G. Kremsner, and A. J. F. Luty. 2006. Cord blood dendritic cell subsets in African newborns exposed to Plasmodium falciparum in utero. Infect. Immun. 74:5725-5729. [DOI] [PMC free article] [PubMed] [Google Scholar]
- 4.Bueno, L. L., C. G. Morais, F. F. Araújo, J. A. S. Gomes, R. Correa-Oliveira, I. S. Soares, M. V. Lacerda, R. T. Fujiwara, and E. M. Braga. 2010. Plasmodium vivax: induction of CD4+CD25+FoxP3+ regulatory T cells during infection is directly associated with level of circulating parasites. PLoS One 5:e9623. [DOI] [PMC free article] [PubMed] [Google Scholar]
- 5.Carvalho, B. O., S. C. P. Lopes, P. A. Nogueira, P. P. Orlandi, D. Y. Bargieri, Y. C. Blanco, R. Mamoni, J. A. Leite, M. M. Rodrigues, I. S. Soares, T. R. Oliveira, G. Wunderlich, M. V. G. Lacerda, H. A. del Portillo, M. O. G. Araújo, B. Russell, R. Suwanarusk, G. Snounou, L. Rénia, and F. T. M. Costa. 2010. On the cytoadhesion of Plasmodium vivax-infected erythrocytes. J. Infect. Dis. 202:638-647. [DOI] [PubMed] [Google Scholar]
- 6.Casals-Pascual, C., C. Kai, C. R. J. C. Newton, N. Peshu, and D. J. Roberts. 2006. Thrombocytopenia in falciparum malaria is associated with high concentrations of IL-10. Am. J. Trop. Med. Hyg. 75:434-436. [PubMed] [Google Scholar]
- 7.Chitnis, C. E., and A. Sharma. 2008. Targeting the Plasmodium vivax Duffy-binding protein. Trends Parasitol. 24:29-34. [DOI] [PubMed] [Google Scholar]
- 8.da Silva-Nunes, M., C. T. Codeço, R. S. Malafronte, N. S. da Silva, C. Juncansen, P. T. Muniz, and M. U. Ferreira. 2008. Malaria on the Amazonian frontier: transmission dynamics, risk factors, spatial distribution, and prospects for control. Am. J. Trop. Med. Hyg. 79:624-635. [PubMed] [Google Scholar]
- 9.Day, N. P. J., T. T. Hien, T. Schollaardt, P. P. Loc, L. V. Choung, T. T. H. Chau, N. T. H. Mai, N. H. Phu, D. X. Sinh, N. J. White, and M. Ho. 1999. The prognostic and pathophysiologic role of pro- and anti-inflammatory cytokines in severe malaria. J. Infect. Dis. 180:1288-1297. [DOI] [PubMed] [Google Scholar]
- 10.Diallo, M., D. Aldebert, J. C. Moreau, M. Ndiaye, and R. Jambou. 2008. Decrease of lymphoid dendritic cells in blood from malaria-infected pregnant women. Int. J. Parasitol. 38:1557-1565. [DOI] [PubMed] [Google Scholar]
- 11.Elhassan, I. M., L. Hviid, G. Satti, B. Akerstrom, P. H. Jakobsen, J. B. Jensen, and T. G. Theander. 1994. Evidence of endothelial inflammation, T cell activation, and T cell reallocation in uncomplicated Plasmodium falciparum malaria. Am. J. Trop. Med. Hyg. 51:372-379. [DOI] [PubMed] [Google Scholar]
- 12.Fernandes, A. A. M., L. J. M. Carvalho, G. M. Zanini, A. M. R. S. Ventura, J. M. Souza, P. M. Cotias, I. L. Silva-Filho, and C. T. Daniel-Ribeiro. 2008. Similar cytokine responses and degrees of anemia in patients with Plasmodium falciparum and Plasmodium vivax infections in the Brazilian Amazon region. Clin. Vaccine Immunol. 15:650-658. [DOI] [PMC free article] [PubMed] [Google Scholar]
- 13.Finney, O. C., E. M. Riley, and M. Walther. 2010. Phenotypic analysis of human peripheral blood regulatory T cells (CD4+FOXP3+CD127lo/−) ex vivo and after in vivo restimulation with malaria antigens. Eur. J. Immunol. 40:47-60. [DOI] [PubMed] [Google Scholar]
- 14.Finney, O. C., E. M. Riley, and M. Walther. 2010. Regulatory T cells in malaria—friend or foe? Trends Immunol. 31:63-70. [DOI] [PubMed] [Google Scholar]
- 15.Freudenthal, P. S., and R. M. Steinman. 1990. The distinct surface of human blood dendritic cells, as observed after an improved isolation method. Proc. Natl. Acad. Sci. U. S. A. 87:7698-7702. [DOI] [PMC free article] [PubMed] [Google Scholar]
- 16.Good, M. F., H. Xu, M. Wykes, and C. R. Engwerda. 2005. Development and regulation of cell-mediated immune responses in the blood stages of malaria: implications for vaccine research. Annu. Rev. Immunol. 23:69-99. [DOI] [PubMed] [Google Scholar]
- 17.Goonewardene, R., R. Carter, C. P. Gamage, G. Del Giudice, R. H. David, S. Howie, and K. N. Mendis. 1990. Human T cells proliferative responses to Plasmodium vivax antigens: evidence of immunosuppression following prolonged exposure to endemic malaria. Eur. J. Immunol. 20:1387-1391. [DOI] [PubMed] [Google Scholar]
- 18.Greenwood, B. M., A. M. Bradley-Moore, A. Palit, and A. D. M. Bryceson. 1972. Immunosuppression in children with malaria. Lancet i:169-172. [DOI] [PubMed] [Google Scholar]
- 19.Hay, S. I., C. A. Guerra, A. J. Tatem, A. M. Noor, and R. W. Snow. 2004. The global distribution and population at risk of malaria: past, present, and future. Lancet Infect. Dis. 4:327-336. [DOI] [PMC free article] [PubMed] [Google Scholar]
- 20.Jacobs, T., S. E. Graefe, S. Niknafs, I. Gaworski, and B. Fleischer. 2002. Murine malaria is exacerbated by CTLA-4 blockade. J. Immunol. 169:2323-2329. [DOI] [PubMed] [Google Scholar]
- 21.Jago, C. B., J. Yates, N. O. Câmara, R. I. Lecher, and G. Lombardi. 2004. Differential expression of CTLA-4 among T cell subsets. Clin. Exp. Immunol. 136:463-471. [DOI] [PMC free article] [PubMed] [Google Scholar]
- 22.Jangpatarapongsa, K., P. Chootong, J. Sattabongkot, K. Chotivanich, J. Sirichaisinthop, S. Tungpradabkul, H. Hisaeda, M. Troye-Blomberg, L. Cui, and R. Udomsangpetch. 2008. Plasmodium vivax parasites alter the balance of myeloid and plasmacytoid dendritic cells and the induction of regulatory T cells. Eur. J. Immunol. 38:2697-2705. [DOI] [PMC free article] [PubMed] [Google Scholar]
- 23.Kalia, S., and J. P. Dutz. 2007. New concepts in antimalarial use and mode of action in dermatology. Dermatol. Ther. 20:160-174. [DOI] [PMC free article] [PubMed] [Google Scholar]
- 24.Kapsenberg, M. L. 2003. Dendritic-cell control of pathogen-driven T-cell polarization. Nat. Rev. Immunol. 3:984-993. [DOI] [PubMed] [Google Scholar]
- 25.Karunaweera, N. D., R. Carter, G. E. Grau, and K. Mendis. 1998. Demonstration of anti-disease immunity to Plasmodium vivax malaria in Sri Lanka using a quantitative method to assess clinical disease. Am. J. Trop. Med. Hyg. 58:204-210. [DOI] [PubMed] [Google Scholar]
- 26.Kassa, D., B. Petros, T. Mesele, E. Hailu, and D. Wolday. 2006. Characterization of peripheral blood lymphocyte subsets in patients with acute P. falciparum and P. vivax malaria infections at Wonji Sugar Estate, Ethiopia. Clin. Vaccine Immunol. 13:376-379. [DOI] [PMC free article] [PubMed] [Google Scholar]
- 27.Kurtzhals, J. A. L., V. Adabayeri, B. Q. Goka, B. D. Akanmori, J. O. Oliver-Commey, F. K. Nkrumah, C. Behr, and L. Hviid. 1998. Low plasma concentrations of interleukin 10 in severe malarial anaemia compared with cerebral and uncomplicated malaria. Lancet 351:1768-1772. [DOI] [PubMed] [Google Scholar]
- 28.Langhorne, J., F. M. Ndungu, A. M. Sponaas, and K. Marsh. 2008. Immunity to malaria: more questions than answers. Nat. Immunol. 9:725-732. [DOI] [PubMed] [Google Scholar]
- 29.Langhorne, J., F. R. Albano, M. Hensmann, L. Sanni, E. Cadman, C. Voisine, and A. M. Sponaas. 2004. Dendritic cells, pro-inflammatory responses, and antigen presentation in a rodent malaria infection. Immunol. Rev. 201:35-47. [DOI] [PubMed] [Google Scholar]
- 30.Looareesuwan, S., J. G. Davis, D. L. Allen, S. H. Lee, D. Bunnag, and N. J. White. 1992. Thrombocytopenia in malaria. Southeast Asian J. Trop. Med. Public Health 23:44-50. [PubMed] [Google Scholar]
- 31.McKenzie, F. E., W. A. Prudhomme, A. J. Magill, J. R. Forney, B. Perpanich, C. Lucas, R. A. Gasser, Jr., and C. Wongsrichanalai. 2005. White blood cell counts and malaria. J. Infect. Dis. 192:323-330. [DOI] [PMC free article] [PubMed] [Google Scholar]
- 32.Mendis, K. N., and R. Carter. 1992. The role of cytokines in Plasmodium vivax malaria. Mem. Inst. Oswaldo Cruz 87(Suppl. III):51-55. [DOI] [PubMed] [Google Scholar]
- 33.Minigo, G., T. Woodberry, K. A. Piera, E. Salwati, E. Tjitra, E. Kenangalem, R. N. Price, C. R. Engwards, N. M. Anstey, and M. Plebanski. 2009. Parasite-dependent expansion of TNF receptor II-positive regulatory T cells with enhanced suppressive activity in adults with severe malaria. PLoS Pathog. 4:e10000402. [DOI] [PMC free article] [PubMed] [Google Scholar]
- 34.Oderup, C., L. Cederbom, A. Makowska, C. M. Cilio, and F. Ivars. 2006. Cytotoxic T lymphocyte antigen-4-dependent down-modulation of costimulatory molecules on dendritic cells in CD4+CD25+ regulatory T-cell-mediated suppression. Immunology 118:240-249. [DOI] [PMC free article] [PubMed] [Google Scholar]
- 35.Park, J. W., S. H. Park, J. S. Yeom, A. J. Huh, Y. K. Cho, J. Y. Ahn, G. S. Min, G. Y. Song, Y. A. Kim, S. Y. Ahn, S. Y. Woo, B. E. Lee, E. H. Ha, H. S. Han, K. Yoo, and J. Y. Seoh. 2003. Serum cytokine profiles in patients with Plasmodium vivax malaria: a comparison between those who presented with and without thrombocytopenia. Ann. Trop. Med. Parasitol. 97:339-344. [DOI] [PubMed] [Google Scholar]
- 36.Pichyangkul, S., K. Yongvanitchit, U. Kum-arb, H. Hemmi, S. Akira, A. M. Krieg, D. G. Heppner, V. A. Stewart, H. Hasegawa, S. Looareesuwan, G. D. Shanks, and R. S. Miller. 2004. Malaria blood stage parasites activate human plasmacytoid dendritic cells and murine dendritic cells through a Toll-like receptor 9-dependent pathway. J. Immunol. 172:4926-4933. [DOI] [PubMed] [Google Scholar]
- 37.Price, R. N., N. M. Douglas, and N. M. Anstey. 2009. New developments in Plasmodium vivax malaria: severe disease and the rise of chloroquine resistance. Curr. Opin. Infect. Dis. 22:430-435. [DOI] [PubMed] [Google Scholar]
- 38.Riley, E. M., S. Wahl, D. J. Perkins, and L. Schofield. 2006. Regulating immunity to malaria. Parasite Immunol. 28:35-49. [DOI] [PubMed] [Google Scholar]
- 39.Rissoan, M. C., V. Soumelis, N. Kadowaki, G. Grouard, F. Briere, R. de Waal Malefyt, and Y. J. Liu. 1999. Reciprocal control of T helper cell and dendritic cell differentiation. Science 283:1183-1186. [DOI] [PubMed] [Google Scholar]
- 40.Sakaguchi, S. 2005. Naturally arising Foxp3-expressing CD25+CD4+ regulatory T cells in immunological tolerance to self and non-self. Nat. Immunol. 6:345-352. [DOI] [PubMed] [Google Scholar]
- 41.Sakaguchi, S., T. Yamaguchi, T. Nomura, and M. Ono. 2008. Regulatory T cells and immune tolerance. Cell 133:775-787. [DOI] [PubMed] [Google Scholar]
- 42.Schlotmann, T., I. Waase, C. Jülch, U. Klauenberg, B. Müller-Myhsok, M. Dietrich, B. Fleischer, and B. M. Bröker. 2000. CD4 αβ lymphocytes express high levels of the T lymphocyte antigen CTLA-4 (CD152) in acute malaria. J. Infect. Dis. 182:367-370. [DOI] [PubMed] [Google Scholar]
- 43.Scholzen, A., G. Minigo, and M. Plebanski. 2010. Heroes or villains? T regulatory cells in malaria infection. Trends Parasitol. 26:16-25. [DOI] [PubMed] [Google Scholar]
- 44.Shevach, E. M. 2009. Mechanisms of Foxp3+ T regulatory cell-mediated suppression. Immunity 30:636-645. [DOI] [PubMed] [Google Scholar]
- 45.Snow, R. W., C. A. Guerra, A. M. Noor, H. Y. Myint, and S. I. Hay. 2005. The global distribution of clinical episodes of Plasmodium falciparum malaria. Nature 434:214-217. [DOI] [PMC free article] [PubMed] [Google Scholar]
- 46.Steeg, C., G. Adler, T. Sparwasser, B. Fleischer, and T. Jacobs. 2009. Limited role of CD4+Foxp3+ regulatory T cells in the control of experimental cerebral malaria. J. Immunol. 183:7014-7022. [DOI] [PubMed] [Google Scholar]
- 47.Tangpukdee, N., H. S. Yew, S. Krudsood, N. Punyapradit, W. Somwong, S. Looareesuwan, S. Kano, and P. Wilairatana. 2008. Dynamic changes in white blood cell counts in uncomplicated Plasmodium falciparum and P. vivax malaria. Parasitol. Int. 57:490-494. [DOI] [PubMed] [Google Scholar]
- 48.Urban, B. C., D. Cordery, M. J. Shafi, P. C. Bull, C. I. Newbold, T. N. Williams, and K. Marsh. 2006. The frequency of BDCA3-positive dendritic cells is increased in the peripheral circulation of Kenyan children with severe malaria. Infect. Immun. 74:6700-6706. [DOI] [PMC free article] [PubMed] [Google Scholar]
- 49.Urban, B. C., T. Mwangi, A. Ross, S. Kinyanjui, M. Mosobo, O. Kai, B. Lowe, K. Marsh, and D. J. Roberts. 2001. Peripheral blood dendritic cells in children with acute Plasmodium falciparum malaria. Blood 98:2859-2861. [DOI] [PubMed] [Google Scholar]
- 50.Walther, M., D. Jeffries, O. C. Finney, M. Njie, A. Ebonyi, S. Deininger, E. Lawrence, A. Ngwa-Amambua, S. Jayasooriya, I. H. Cheeseman, N. Gomes-Escobar, J. Okebe, D. J. Conway, and E. M. Riley. 2009. Distinct roles for FOXP3+ and FOXP3− CD4+ T cells in regulating cellular immunity to uncomplicated and severe Plasmodium falciparum malaria. PLoS Pathog. 5:e1000364. [DOI] [PMC free article] [PubMed] [Google Scholar]
- 51.Win, T. T., K. Lin, S. Mizuno, Q. Liu, M. U. Ferreira, I. S. Tantular, S. Kojima, A. Ishii, and F. Kawamoto. 2002. Wide distribution of Plasmodium ovale in Myanmar. Trop. Med. Int. Health 7:231-239. [DOI] [PubMed] [Google Scholar]
- 52.World Health Organization. 2000. Severe falciparum malaria. Trans. R. Soc. Trop. Med. Hyg. 94(Suppl. 1):S1-S90. [PubMed] [Google Scholar]
- 53.Wykes, M. N., and M. F. Good. 2008. What really happens to dendritic cells during malaria? Nat. Rev. Immunol. 6:864-870. [DOI] [PubMed] [Google Scholar]
Associated Data
This section collects any data citations, data availability statements, or supplementary materials included in this article.