Abstract
Murine embryonic stem (ES) cells are defined by continuous self-renewal and pluripotency. A diverse repertoire of protein isoforms arising from alternative splicing is expressed in ES cells without defined biological roles. Sall4, a transcription factor essential for pluripotency, exists as two isoforms (Sall4a and Sall4b). Both isoforms can form homodimers and a heterodimer with each other, and each can interact with Nanog. By genomewide location analysis, we determined that Sall4a and Sall4b have overlapping, but not identical binding sites within the ES cell genome. In addition, Sall4b, but not Sall4a, binds preferentially to highly expressed loci in ES cells. Sall4a and Sall4b binding sites are distinguished by both epigenetic marks at target loci and their clustering with binding sites of other pluripotency factors. When ES cells expressing a single isoform of Sall4 are generated, Sall4b alone could maintain the pluripotent state, although it could not completely suppress all differentiation markers. Sall4a and Sall4b collaborate in maintenance of the pluripotent state but play distinct roles. Our work is novel in establishing such isoform-specific differences in ES cells.
Murine embryonic stem (ES) cells are derived from the inner cell mass (ICM) of early mouse embryos and exhibit two distinguishing features from somatic cells: “pluripotency,” or the ability to differentiate into all three primitive germ layers (endoderm, ectoderm, and mesoderm), and “self-renewal,” or the ability to be propagated indefinitely in an undifferentiated state. At the core of the establishment and maintenance of the pluripotent state are transcription factors that regulate gene expression and alter the epigenetic landscape through interactions with various protein complexes (4, 7, 33, 34). Core pluripotency factors, such as Nanog (6, 30) and Oct4 (31), interact directly and bind many pluripotency loci jointly to form a tight, self-reinforcing regulatory network (8, 18, 21, 42). The pluripotency network coordinates repression of differentiation-promoting genes and the sustained expression of self-renewal factors. Various combinations of pluripotency factors (Oct4, Sox2, and Nanog), plus accessory components (c-Myc and Lin28), are sufficient to induce pluripotency in somatic cells (iPS) (39, 48).
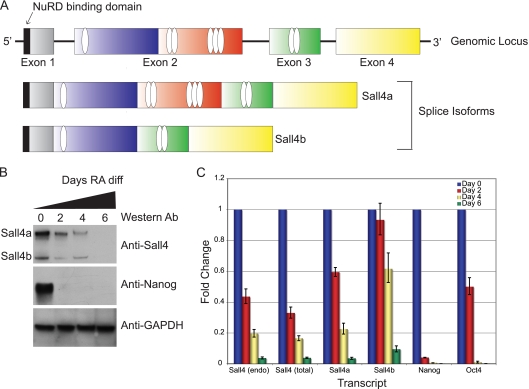
ES cells have other unique properties compared to somatic cells. ES cells transcribe a large number of genes at low levels, which is consistent with “priming” the cells for early differentiation down multiple lineages (12). This can also be seen by the unique histone methylation status referred to as the bivalent mark, in which promoters of transcriptionally silent genes exhibit trimethylation on both H3K27 and H3K4, indicating that these loci are primed for activation once the repressive H3K27me3 mark is demethylated (3). Moreover, ES cells express a large diversity of splice isoforms (24, 47), and recently several splice variants have been shown to play key roles in lineage commitment and differentiation (37). Increased diversity of protein isoforms in ES cells may contribute in as-yet-undefined ways to the pluripotent state. One model is that alternative splicing at a single locus generates isoforms with different protein-protein interactions, thereby allowing a single gene to create multiple regulatory networks. Here, we address the functional significance of splice isoforms for an established pluripotency factor, Sall4, a C2H2-type zinc-finger transcription factor related to the Drosophila spalt gene (22). Sall4 physically interacts with Nanog (42, 45), and two splice isoforms of Sall4 (Sall4a and Sall4b) are generated through an internal splicing event in exon 2 (see Fig. 1A). Targeted inactivation of the locus that eliminates both isoforms is embryonic lethal due to the failure of ICM formation (5, 13, 25, 35, 40, 43, 49). Depletion of both isoforms of Sall4 by si/shRNA leads to differentiation along multiple lineages. Lastly, genomewide location analysis using an antibody that recognizes both isoforms of Sall4 detects binding to many pluripotency loci in ES cells, confirming its participation in the pluripotency network (25).
FIG. 1.
Sall4a and Sall4b share similar regulation. (A) Genomic structure of the Sall4 locus, with the domain structure of the long (Sall4a) and short (Sall4b) isoform of Sall4. Zinc fingers are shown as ovals, and the N-terminal NuRD binding domain is shown as a black rectangle. (B) Differentiation of CJ7 ES cells with retinoic acid. Whole-cell extracts were assayed by Western blotting. The two isoforms are labeled, with the Western blot antibody labeled on the right. Sall4a, Sall4b, and Nanog diminished during differentiation, whereas GAPDH remained unchanged. (C) RNA was harvested from ES cells differentiated with retinoic acid at various time points, and the transcript levels of Sall4a, Sall4b, Nanog, and Oct4 were assessed. Two different primer sets were used to assess total levels of Sall4, Sall4 (endo) that is directed to the 3′ untranslated region of the transcript of both isoforms, and Sall4 (total) that is directed to the coding region of both isoforms.
Mutations of the Sall4 gene in humans lead to an autosomal-dominant condition, Duane-Radial Ray syndrome, characterized by radial abnormalities and agenesis of the VIth cranial nerve along with renal, cardiac, and other malformations. Interestingly, all published mutations affect both isoforms (1, 22, 23). In contrast, overexpression of Sall4b in a transgenic mouse model causes myelodysplastic syndrome and acute myeloid leukemia (AML) (28). In addition, Sall4 has been shown to be overexpressed in human AML samples (10, 28, 46). Lastly, one group has suggested that the two isoforms might have different roles in early embryo patterning, with the short isoform playing a critical role in ICM formation (41). We have explored here the individual contributions of Sall4 isoforms to ES cell pluripotency.
MATERIALS AND METHODS
ES cell culture, differentiation, and cell line generation.
BirA cells were described previously, along with their culture conditions (42). Cells stably expressing a biotinylatable version of either Sall4a or Sall4b were clonally generated by electroporation of a linearized cDNA expression plasmid as described previously (42) and selected in puromycin, and then individual clones were picked and expanded. Positive clones were identified by expression of an appropriately sized biotinylated protein as determined by Western blotting. CJ7 and J1 are 129SvJ-derived ES cell lines. For differentiation, gelatin-adapted CJ7 cells were plated the day before in standard ES cell medium and then changed the subsequent day to ES cell medium without LIF but including 5 μM retinoic acid. Cells underwent daily medium changes and were harvested at the indicated time points, and RNA or protein was prepared. To create immune-mediated versions of Sall4a and Sall4b, standard PCR and cloning techniques were used to generate versions of Sall4a and Sall4b with specific cDNA alterations and a v5 epitope at the C terminus of the protein. The resulting cDNAs were cloned into the pPyCAG iH vector (a gift from I. Chambers and A. Smith), linearized, electroporated into CJ7 cells, and selected with hygromycin, and individual clones were picked and expanded. Positive clones were selected by expression of an appropriately sized protein containing the v5 epitope as determined by Western blotting. To create a wild-type cell line that went through the same clonal selection process, we placed a nonspecific cDNA (yellow fluorescent protein [YFP]) into the same vector, and clones were selected by visual detection of YFP expression. YFP cells are labeled as wild-type (wt) or +Sall4a +Sall4b in the figures. Sall4a was amplified from an IMAGE clone (ID 30106527). The Sall4a sequence was matched with RefSeq at the mRNA (NM_175303.3) and protein (NP_780512.2) level. Sall4b's sequence was created from the IMAGE clone by using overlapping PCR to match the mRNA (NM_201395.2) and protein (NP_958797.2) sequence.
Protein and RNA isolation, Western blotting, and qPCR.
RNA for all downstream analysis was prepared by using TRIzol (Invitrogen). RNA for microarray analysis was further purified by using the SV total RNA isolation kit (Promega) according to the manufacturer's protocols. Whole-cell extracts were prepared from cells by lysis in 50 mM Tris (pH 8.0), 10% glycerol, 0.7% NP-40 substitute (Sigma catalog no. 74385), 0.1 mM EDTA, 250 mM NaCl, 50 mM NaF, and 0.1 mM Na3VO4. SDS-PAGE separation was performed using standard techniques, and the following antibodies or proteins were used for detection: anti-v5 HRP (Invitrogen), streptavidin-HRP (Invitrogen), anti-Flag (Sigma), GAPDH (Santa Cruz, sc-25778), Sall4 (Abcam, ab29112), Nanog (Millipore, ab5731), Oct4 (Abcam, ab19857), laminin B1-1 (Santa Cruz, sc-17810, gene/mRNA name Lamb1). For quantitative reverse transcription-PCR (RT-qPCR), first-strand cDNA synthesis was performed by using iScript (Bio-Rad); 0.25 μM concentrations of each primer were then mixed with diluted cDNA and iSYBR reaction mix (Bio-Rad) and analyzed on a Bio-Rad iCycler machine. The fold changes were calculated by normalizing to actin. For chromatin immunoprecipitation-quantitative PCR (ChIP-qPCR), samples were analyzed under similar conditions, and fold enrichments were calculated by comparing ChIP samples to genomic DNA controls after normalizing them to GAPDH using standard curves for each primer set. All primers used in the present study are listed in Table 1.
TABLE 1.
Primers used in this study
| Gene | Primer sequence (5′-3′) |
Method | Reference | |
|---|---|---|---|---|
| Forward | Reverse | |||
| Nanog | GTCCCCGCTCCTTTTCAGCACTAACCATAC | CGGTTTGAATAGGGAGGAGGGCGTCT | ChIP-qPCR | 45 |
| Sox2 | CGGAATGGTTGGCGAGTGGTTAAACAGAGC | TGCATTTGAGTGGGTTCCCCTCCTCTCCT | ChIP-qPCR | 45 |
| Control 1 | GGTATTTGGAAACGTCCCACACTCACTCG | GATGGAAGATGAAAAAGAAATTGCAAGGATCCC | ChIP-qPCR | 45 |
| Control 2 | GGGCACGTTATACCACTGGTCCTAGTTTCTTTG | TTTTACAGCACCACAGACTCTTTCCATCCTACA | ChIP-qPCR | 45 |
| Control 3 | CTTTGCCACTATTGCCCAGAGGACACAGATT | CGCTCCGTCCCAATTAGCTTGCAACA | ChIP-qPCR | 45 |
| GAPDH | GGTCCAAAGAGAGGGAGGAG | GCCCTGCTTATCCAGTCCTA | ChIP-qPCR | |
| Nanog | CAAGGGTCTGCTACTGAGATGCTCTG | TTTTGTTTGGGACTGGTAGAAGAATCAG | RT-qPCR | 42 |
| Oct4/Pou5f1 | CTCCCGAGGAGTCCCAGGACAT | GATGGTGGTCTGGCTGAACACCT | RT-qPCR | 42 |
| Sall4 (endo) | AGTGATGTGGCTTGTGACCA | AACCCGCTTCTTTCCAAAAT | RT-qPCR | |
| Sall4a | CCCCTCAACTGTCTCTCTGC | CAGGGAGCTGTTTTCTCGAC | RT-qPCR | |
| Sall4b | GCTCGACCAGTCCAAGAAAG | GGCTGTGCTCGGATAAATGT | RT-qPCR | |
| Sall4 (total) | AATGCTGTGCCGAGTTCTTT | GTGCCCAGCTTCTTCAAGTC | RT-qPCR | |
| BMP2 | CGCAGCTTCCATCACGAAGAAG | TGAGAAACTCGTCACTGGGGACAGA | RT-qPCR | 42 |
| Actin | GATCTGGCACCACACCTTCTACAATG | CGTACATGGCTGGGGTGTTGAAG | RT-qPCR | 42 |
| Brachyury | CTGTGACTGCCTACCAGAATGAGGAG | GGTCGTTTCTTTCTTTGGCATCAAG | RT-qPCR | 42 |
| Cdx2 | GCGAAACCTGTGCGAGTGGATG | CGGTATTTGTCTTTTGTCCTGGTTTTCA | RT-qPCR | 42 |
| Fgf5 | CAAAGTCAATGGCTCCCACGAAG | CTACAATCCCCTGAGACACAGCAAATA | RT-qPCR | 42 |
| Isl1 | GGGATGGGAAAACCTACTGTAAAAGAGA | GTCGTTCTTGCTGAAGCCTATGCTG | RT-qPCR | 42 |
| Lamb1 | GCACAAACCAGAGCCCTACTGTATTG | GTTGAGGGTCTCGTGATAAGGGTCTC | RT-qPCR | 42 |
| NM_010288 | GCGCTTTGTCTTGGAGATTC | GGCCTCTCAACTGTGGGTTA | ChIP-qPCR | |
| NM_144953 | GGTTTCATGAAGGACCCTGA | TCCAAAAGGCCCTGTTTATG | ChIP-qPCR | |
| NM_197985 | GCCAGAAGTCACATGGACAA | CATTGTACCGGGACACAAGA | ChIP-qPCR | |
| NM_001005605 | GGGCTCCCACCTTACAATTT | ATCCTCCCCACCCTGTAAAC | ChIP-qPCR | |
| NM_001003953 | TGATCGGTCACCTGATTTGA | TGCTGGAGAAGGTGATCCAT | ChIP-qPCR | |
| NM_015798 | TTTACTGCACGTGCCATTTC | GCCTAGTCCGGTTTGTTTTG | ChIP-qPCR | |
| NM_023755 | TCCCGTCTATGCAAATCACA | CGGGTGACCACAAAACTCTC | ChIP-qPCR | |
| NM_009169 | TCCTCCCGTCTTGAAACAGT | CAGCATGCTCAAGGCTAGGT | ChIP-qPCR | |
| NM_001038635 | GAGGATTAAGTGCGGCTGAG | CCTGCATCGTACCTCTACGC | ChIP-qPCR | |
ChIP and genomewide location analysis.
ChIP reactions were performed similar to a previously described method (21). Briefly, J1 ES cells harboring either BirA alone, biotinylatable Sall4a, or Sall4b were cross-linked for 10 min in 1% formaldehyde and terminated by the addition of 125 mM glycine. Cells were washed, collected, and then resuspended in ChIP dilution buffer (0.1% SDS, 1% Triton X-100, 2 mM EDTA, 20 mM Tris-Cl [pH 8.1], 150 mM NaCl, and protease inhibitors). Cells were fragmented by sonication; shearing was confirmed by agarose gel electrophoresis to have an average size of ca. 0.5 to 1 kb. Samples were centrifuged at 4°C for 10 min, and the supernatants were collected and precleared with prewashed protein A-beads (Roche) at 4°C for 60 min with rotation. The beads were pelleted by centrifugation, and the supernatants were incubated overnight at 4°C with prewashed Dynabead MyOne streptavidin T1 beads (Invitrogen). A sample of the precleared supernatant was saved as a genomic control (input) from the J1 ES cells expressing BirA alone. DNA absorbed beads were washed with buffer I (2% SDS) twice, buffer II (0.1% deoxycholate, 1% Triton X-100, 1 mM EDTA, 1 mM HEPES [pH 7.5], 500 mM NaCl) once, buffer III (250 mM LiCl, 0.5% NP-40, 0.5% deoxycholate, 1 mM EDTA, 10 mM Tris-Cl [pH 8.1]) once, and TE (10 mM Tris [pH 8.1], 1 mM EDTA) twice. All washes were 10 min at room temperature with agitation, and beads were pelleted by using magnetic separation. SDS elution buffer (1% SDS, 10 mM EDTA, 50 mM Tris [pH 8.1]) was added, and the DNAs were eluted off and de-cross-linked overnight at 65°C. The samples were treated with RNase A and proteinase K, extracted with phenol-chloroform-isoamyl alcohol, and precipitated. The samples were then used as either a template in qPCR, or they were amplified for hybridization to microarray.
ChIP samples were amplified by LM-PCR as described previously 27, DNA was subsequently fragmented by DNase I treatment and biotin labeled according to the manufacturer's instructions (Affymetrix). Three biological replicates were hybridized to Affymetrix GeneChIP Promoter 1.0R arrays at the Microarray Core of the Dana Farber Cancer Institute. These arrays, labeled promoter by the manufacturer, contain tiling probes to ∼28,000 mouse genes, spanning a total of ∼10 kb around the transcriptional start site of each gene using 35-bp probes. A model-based analysis-of-tiling array (MAT) was applied to predict the target loci with a P value cutoff of 10−5 (20). For the background (or reference data set), input DNA (sheared genomic DNA precleared with protein A-agarose) was amplified and hybridized in parallel to ChIP samples. Each comparison (BirA versus input, Sall4a versus input, and Sall4b versus input) was made, and MAT assigned the peaks. Peaks found in the BirA expressing cells alone were removed from the list of Sall4a and Sall4b peaks to generate a list of predicted target loci. The predicted target loci were then mapped to the promoter region, which was defined here as the region from 8 kb upstream to 2 kb downstream of a transcription start site (TSS), of the RefSeq annotated genes from NCBI Mouse Genome Assembly Build 36 (mm8). In situations where multiple genes were in close proximity to a binding site, the target gene was selected to be the one whose TSS was the closest.
Biological function classification.
Bound loci of Sall4a/b (i.e., bound by both Sall4a and Sall4b), Sall4a alone, and Sall4b alone were uploaded to DAVID (11, 16). The 10 most enriched terms associated with each subgroup were selected and displayed in Fig. 6A, along with their P values.
Motif discovery and enrichment analysis.
We divided the loci bound by Sall4a or Sall4b into three groups: Sall4a alone, Sall4b alone, and Sall4a and Sall4b together (referred to here as Sall4a/Sall4b). Motif analysis was then performed for each group of target loci. Initially, candidate motifs were detected by using the de novo motif search function Flexmodule_motif in CisGenome suite (19). Then, the relative enrichment of each detected motif among the target loci was calculated by using the function motifmap_matrixscan_genome_summary in CisGenome suite. Finally, the motif with the highest enrichment score was selected (shown in Fig. 6B).
Clustering of transcription factors.
To study the coregulation between Sall4a and Sall4b and additional transcription factors related to pluripotency, we collected the genomewide binding sites of 16 transcription factors from the literature, including the nine transcription factors Nanog, Sox2, Dax1, Nac1, Oct4, Klf4, Zfp281, Rex1, and c-Myc (21); the four transcription factors Esrrb, Smad1, Stat3, and Zfx (8); the two transcription factors Cnot3 and Trim28 (15); and the one additional transcription factor Tcf3 (9). The target loci of these 16 transcription factors, together with the three groups of Sall4 target genes, as defined previously, were clustered based on the degree of overlapping. Hierarchical clustering was done by using the hclust function in the R-package.
Epigenetic analysis.
The genomewide locations of H3K4me3, H3K27me3, and H3K36me3 in mouse ES cells were obtained from the literature (21, 39, 29). Since the original H3K36me3 data was processed using CisGenome (19). A false discovery rate (FDR) cutoff value of 0.1 was used to detect peaks, which were then mapped to the gene promoter (for H3K4me3 and H3K27me3) or the coding regions (for H3K36me3). Bivalent genes were defined as the intersection between the H3K4me3 and H3K27me3 target genes. H3K4me3 and H3K27me3 gene sets were defined by the presence of one signal but the absence of the other. The bivalent marked, H3K27me3, and H3K4me3 gene sets are unique, i.e., there is no overlap between the three.
To obtain the average histone mark profiles over promoter or coding regions, we divided the region around the TSS of each gene into nonoverlapping bins of 200 bp and then calculated the average probe MAT score (H3K4me3 and H3K27me3) or the number of sequencing tags (H3K36me3) in each bin. The H3K27me3 and H3K36me3 profiles were further smoothed by a moving averaging over 5-bin windows. The clustering plots in Fig. 9 were generated as described previously (21) and above. The H3K4me3 and H3K27me3 curves were then smoothed by moving averaging over 50 genes (see Fig. 9A) or 20 genes (see Fig. 9B and C).
GSEA.
We used gene set enrichment analysis (GSEA) (31, 40) to evaluate the gene set level expression changes during ES cell differentiation. Time course gene expression data were obtained from a previous study (GSE 3749 [14]). mRNA expression levels were measured by microarray at 11 time points (days 0, 0.25, 0.5, 0.75, 1, 1.5, 2, 4, 7, 9, and 14) during the ES cell differentiation. Raw data were normalized with the robust multiarray average (RMA) (17) and then applied the time course mode of GSEA to assess gene set enrichment.
293T cotransfection.
293T cells were transfected with plasmids containing an simian virus 40 origin of replication and expressing either Flag tags at the N terminus of the protein or v5 tags of the C terminus of the protein using FuGene 6 (Roche). At 48 h after transfection, the cells were washed and lysed as described above. The whole extracts were precleared with prewashed protein-A agarose for 1 h at 4°C, and then prewashed M2-agarose (Sigma-Aldrich) was added to the samples, followed by incubation overnight at 4°C with rotation. Prior to adding the M2 agarose, an aliquot was removed for use as an input. The next day, the beads were pelleted by centrifugation at 4°C and then washed five times in TBS350 (50 mM Tris [pH 7.5], 350 mM NaCl). Each wash was for 10 min at 4°C with rotation. Samples were then boiled in loading dye, separated by SDS-PAGE, and Western blotted with the appropriate antibodies as described above. For Fig. 2B, whole-cell extracts were obtained from cells that were mock transfected (i.e., empty expression plasmid) or transfected with plasmids expressing Sall4a or Sall4b. Whole-cell extracts were obtained, and defined amounts were separated by SDS-PAGE and Western blotted.
FIG. 2.
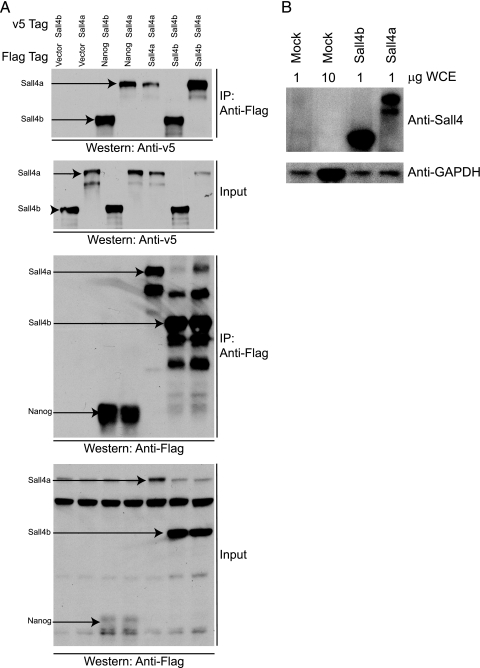
Sall4a and Sall4b interact with Nanog and form dimers. (A) Coimmunoprecipitation was performed with Flag-tagged Nanog, Sall4a, or Sall4b and an anti-Flag antibody upon whole-cell extracts from transiently transfected 293T cells, followed by Western blotting to an antibody against the v5 epitope attached to Sall4a or Sall4b. Nanog interacts with both isoforms of Sall4, and each isoform is able to interact with itself (homodimerization), as well as the other isoform (heterodimerization). Immunoprecipitation (IP) and input are labeled, with each being probed with anti-v5 and anti-Flag antibodies. (B) Western blot with an antibody to Sall4 and GAPDH showing that 293T cells do not express appreciable Sall4 protein. WCE indicates the amount of whole-cell extract loaded.
Lentiviral generation and infection.
Lentivirus vectors were obtained that specifically targeted both isoforms of Sall4 from Open Biosystems (TRCN0000097821) and the empty parental vector pLKO.1 (a generous gift from W. Hahn). Lentivirus was generated according to Broad Institute protocols (http://www.broadinstitute.org/genome_bio/trc/publicProtocols.html) and concentrated by ultracentrifugation, and aliquots were frozen for long-term storage at −80°C. CJ7 cells harboring either YFP (negative control) or Sall4a Imm and Sall4b Imm were split the day before at a density of 1.5 × 10⁶ cells per 10-cm gelatin-adapted TC plate and the next day were infected with concentrated virus in the presence of Polybrene (2.5 μg/ml). The next day, the medium was changed to fresh ES cell medium containing puromycin (2 μg/ml), and the cells were cultured for 48 h, at which point RNA was prepared. For experiments to assess phenotype, 293T cells were transfected as described above, and lentivirus-rich supernatants were collected and used to infect cells over 2 days in the presence of Polybrene (2.5 μg/ml). After the infection, the medium was changed to fresh ES cell medium containing puromycin (2 μg/ml), and the cells were cultured for 96 h, at which point RNA or protein was obtained from the cells, along with images to determine the phenotype.
Transcriptome analysis.
RNA was obtained from the various ES cells at 48 h after lentiviral knockdowns of endogenous Sall4 and amplified at the Microarray Core of the Dana Farber Cancer Institute by using the Nugent approach (http://chip.dfci.harvard.edu/index.php?option=com_content&task=view&id=14&Itemid=28#NuGen). Samples were then biotin labeled, and biological duplicates were hybridized to the Affymetrix Mouse Genome 430 2.0 array. CEL files were obtained and RMA normalized (17) prior to using them in the GSEA. Statistical significance was assigned if the P value was <5% and the FDR was <25%. Gene sets of histone marks were generated as described above in the epigenetic analysis section.
Alkaline phosphatase staining.
A modified version of the protocol supplied by Sigma (86R-1kt) was used. Briefly, plates of infected cells had their media aspirated, were washed with phosphate-buffered saline, and then fixed with citrate-acetone-formaldehyde for 30 s at room temperature. The fixative was aspirated, and the plates were washed with deionized water. Then, a naphthol AS-BI alkaline solution was added to the plates, and they were incubated in the dark at room temperature for 15 min. The plates were washed with deionized water and air dried and then photographed by using an inverted Nikon microscope/camera. Images were adjusted by using Adobe Photoshop.
Data accession.
All microarray data (expression and ChIP on Chip) has been submitted to GEO under accession number GSE21056.
RESULTS
Sall4 isoforms are downregulated on ES cell differentiation and interact with each other and Nanog.
ES cells were differentiated over the course of 6 days using retinoic acid. At the level of protein and RNA (Fig. 1 B and C), both isoforms are detected in undifferentiated cells, with Sall4a expressed at a higher level than Sall4b by Western blotting. Upon differentiation, both isoforms are downregulated and become virtually undetectable by day 6, although both persist at the level of RNA and protein longer than another pluripotency factor, Nanog. Sall4 interacts with Nanog protein (42, 45), and we directly tested whether the isoforms could interact with themselves, each other, and Nanog. We tested these interactions in heterologous 293T cells that do not express endogenous Sall4 protein (Fig. 2 B). This allowed us to determine whether Sall4a and Sall4b individually interact directly with Nanog and each other, without endogenous isoforms of Sall4 causing the formation of a tertiary complex. Upon expression in transiently transfected 293T cells, the isoforms homo- and heterodimerize, and both interact with Nanog (Fig. 2A). These observations suggest that the isoforms may function in multiple states (homodimers of Sall4a, homodimers of Sall4b, and a heterodimer of the two) but are both able to form critical protein-protein interactions required for regulating pluripotency-associated genes.
Sall4 isoforms bind to overlapping and distinct loci in ES cells.
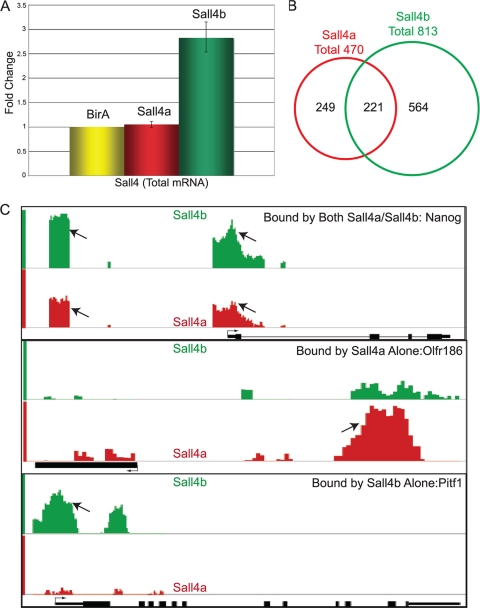
Since the two isoforms of Sall4 are highly similar, antibodies selective for each are not available. Therefore, we used in vivo metabolic biotin labeling to generate tagged versions of Sall4a and Sall4b (21, 42). Using this approach, we generated ES cells harboring tagged Sall4a or Sall4b to allow for isoform-specific chromatin immunoprecipitation (ChIP). Multiple Sall4 isoform-expressing ES clones were characterized, but generally tagged Sall4b was consistently expressed at a higher level than Sall4a and was comparable in expression to wild-type levels of Sall4a (Fig. 3 A and data not shown).
FIG. 3.
Genomewide location analysis reveals Sall4a and Sall4b have overlapping but not identical binding loci. (A) RNA was harvested from ES cells harboring no biotinylatable substrate (BirA alone) or expressing a biotinylatable version of either Sall4a or Sall4b, and the transcript levels were measured by using reverse transcription-PCR. The data were normalized to actin and are shown as the fold change versus BirA, with error bars representing ± the standard errors of the mean (SEM) of technical replicates. (B) Genomewide location analysis was performed using our biotinylatable versions of Sall4a and Sall4b via ChIP, followed by hybridization to a mouse promoter array (described in Materials and Methods). Overlap between the binding sites of Sall4a and Sall4b at well-annotated loci is indicated. (C) Comparison binding data from select loci bound by both Sall4a and Sall4b (Sall4a/b), Sall4a alone, and Sall4b alone, respectively, are displayed the using Affymetrix integrated genome browser. Arrows indicate the binding sites as determined by MAT; the transcriptional start site and the direction are shown as well. The binding of Sall4a is shown in red, and the binding of Sall4b is shown in green.
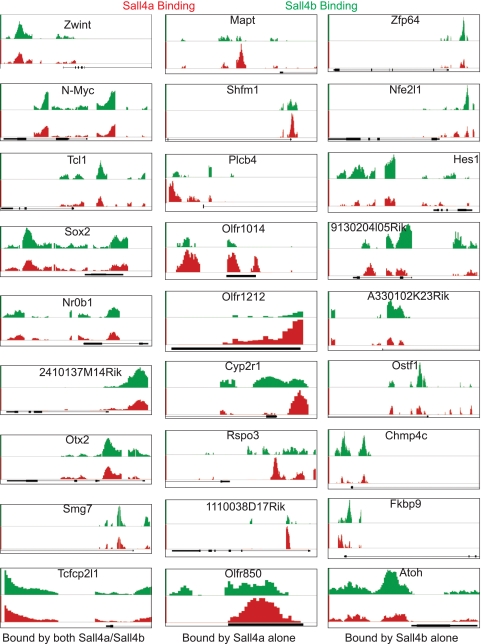
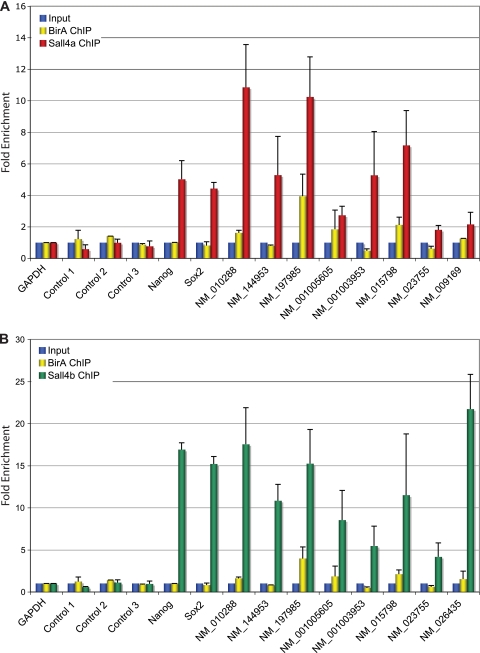
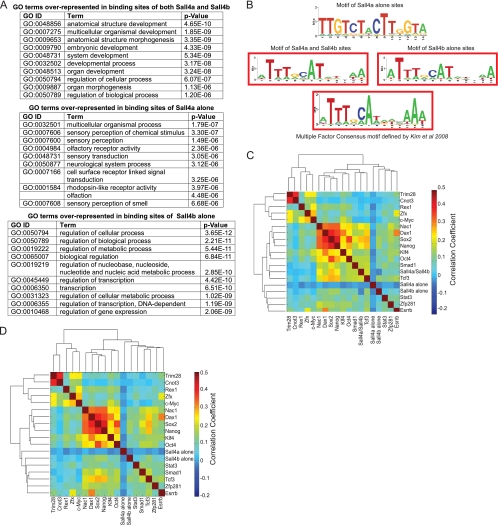
To identify loci bound by Sall4 isoforms, we performed genomewide location analysis using ES cells expressing tagged Sall4a or Sall4b, as detailed in Materials and Methods. Any peaks observed in cells expressing the BirA ligase alone as a control for specificity were subtracted. Viewed in aggregate, the combined binding sites of Sall4a and Sall4b yielded a total of 1,034 peaks (Fig. 3B; see also Tables S1 and S2 in the supplemental material), which is comparable to that previously reported in studies that used an antibody that detects both isoforms (25). Of particular interest, Sall4b bound to substantially more targets than Sall4a (813 compared to 470); >200 of these loci were shared. We next divided binding peaks into three distinct subgroups for further analysis: targets bound by both Sall4a and Sall4b (Sall4a/Sall4b), targets bound by Sall4a alone (and not Sall4b), and targets bound by Sall4b alone (and not Sall4a) (Fig. 3B). To verify that the differences in binding were not simply related to relative abundance, we visualized a total of 10 bound loci using the Affymetrix integrated genome browser to confirm the differential binding for each subgroup (Fig. 3C and Fig. 4). As can be seen in the figures, there were substantial differences in peak heights, but low-level binding of both Sall4a and Sall4b could still often be seen (such as Fig. 4, Olfr850 and Nfe2l1), even though MAT may have identified only one factor as binding to a given locus. This implies that our subgroups (i.e., Sall4a alone and Sall4b alone) are not necessarily exclusive, in that in vivo many of the sites determined by MAT to bind one isoform but not the other may in fact bind them both, with one isoform predominating at certain loci. To validate our data, 10 targets were selected for verification by ChIP-qPCR (Fig. 5); 9/10 of the Sall4a peaks and 10/10 Sall4b peaks showed enrichment compared to the negative control, BirA ChIP (equivalent to an IgG control for standard antibody based ChIP). In addition, we verified that in our bio-ChIP approach neither Sall4a nor Sall4b bound to three loci (controls 1, 2, and 3, Fig. 5), which have been shown to not bind Sall4 using an antibody which recognizes both isoforms (45). To test whether these subgroups were biologically distinct, we used DAVID to map the most common gene ontologies (GO) enriched in each subgroup and found significant differences (Fig. 6 A). Specifically, the binding sites of both Sall4a and Sall4b showed significant enrichment for processes related to organismal development and body patterning, whereas the binding sites of Sall4a alone corresponded to genes implicated in sensory processes. Perhaps most striking was the observation that the binding sites of Sall4b alone were predominantly associated with genes involved in the regulation of other processes, especially transcription. Interestingly, Sall4a alone binding sites were enriched for GO terms related to olfaction and sensory processes, predominantly due to a high number of binding sites within the olfactory cluster. This is surprising given that previous work has shown that this region of the genome has a paucity of binding events for pluripotency factors (21).
FIG. 4.
Binding data for additional loci. Comparison binding data from nine additional loci bound by both Sall4a/Sall4b, Sall4a alone, and Sall4b alone, respectively, are displayed by using the Affymetrix integrated genome browser. The x axis represents the genomic position, with the associated loci shown in black. The y axis is the MAT score, which has been scaled for each locus to allow optimal viewing; however, the same scale is used for both Sall4a and Sall4b.
FIG. 5.
ChIP-qPCR validates predicted targets. Ten positive targets of Sall4a (A) and Sall4b (B) were selected for validation by ChIP-qPCR. Three previously published negative control regions (controls 1, 2, and 3) that do not bind Sall4 are shown. Cells expressing the biotin ligase BirA alone had ChIP performed in parallel as a negative control. Error bars represent the SEM of biological replicates.
FIG. 6.
Sall4a and Sall4b bind to different sites in the genome. (A) DAVID was used to assign GO terms to the binding sites of Sall4a and Sall4b, Sall4a alone, and Sall4b alone, and the top 10 represented GO terms with their respective P values are shown. (B) Consensus motifs were extracted for the binding sites of Sall4a/Sall4b, Sall4a alone, and Sall4b alone. The consensus multiple binding site motif described previously is shown also. (C) The binding sites of Sall4a and Sall4b, Sall4a alone, and Sall4b alone were hierarchically clustered based upon their correlation with the binding sites of other known pluripotency factors from published reports. (D) The binding sites were reclustered as in panel C without the bindings sites of Sall4a/Sall4b.
We next extracted consensus DNA-binding motifs from the peaks identified for each of the three subgroups (Fig. 6B). Sall4a binding sites had a unique consensus motif, whereas the motifs of the Sall4b and Sall4a/Sall4b binding sites were similar and overlapped with the multifactor binding motif defined in earlier work (21). To examine how these subgroups overlap with the binding sites of other pluripotency factors, we performed hierarchical clustering with binding sites from other studies (see Materials and Methods for details). Combined Sall4a/Sall4b sites correlated best with a subgroup of factors (including Nanog, Oct4, and Sox2) that characterize the most critical pluripotency factors (Fig. 6C). Sall4b-alone binding sites fell within another pluripotency subgroup characterized by Zfp281, Stat3, and Esrrb. In contrast, Sall4a-alone binding sites showed negative correlation with any of the other factor binding sites. Removing the binding sites of Sall4a/Sall4b resulted in a similar clustering, in that the binding sites of Sall4a alone and Sall4b alone remained within the same group (Fig. 6D). Taken together, this implies that combined Sall4a/Sall4b and Sall4b-alone binding peaks function as part of the pluripotency machinery, whereas Sall4a-alone binding sites reflect genes more involved in development or processes associated with differentiated cells.
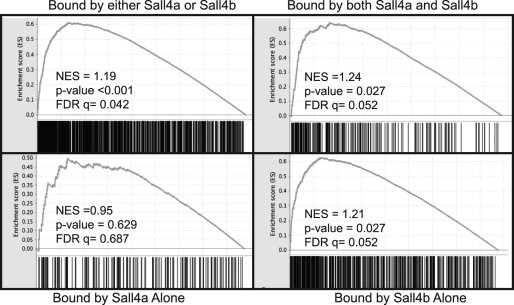
To test this model, we used the binding sites of Sall4a/Sall4b, Sall4a alone, and Sall4b alone binding sites as gene sets in gene set enrichment analysis (GSEA). GSEA tests whether a group of genes (referred to as a gene set) is more highly expressed in either of two phenotypes or, in the case of a continuous time course, at the beginning or end. For expression data, we chose a published data set of ES cells differentiated over 14 days via embryoid body formation, with the data analyzed as a continuous time course (see Materials and Methods for details). When viewed in total, Sall4 binding sites were more highly expressed in pluripotent as opposed to differentiated cells, as seen by a positive normalized enrichment score, a P value of <5%, and an FDR of <25% (Fig. 7). When broken down into subgroups, Sall4a/Sall4b and Sall4b alone revealed slightly greater enrichment in pluripotent versus differentiated cells, implying that these genes are highly expressed in ES cells. In contrast, Sall4a-alone binding sites failed to show statistically significant enrichment in either group, implying that targets of Sall4a alone are expressed equivalently throughout this differentiation process. Taken together, these data suggest that binding sites proximal to transcriptional start sites occupied by Sall4a/Sall4b and sites occupied by Sall4b alone play a key role in regulating pluripotency genes, whereas Sall4a plays a secondary role at these sites.
FIG. 7.
Loci bound by Sall4a/Sall4b and Sall4b alone are highly expressed in pluripotent cells. Microarray data of differentiating ES cells via the embryoid body was located from the literature and subjected to GSEA as described in Materials and Methods. The total targets (Sall4a or Sall4b), and each subgroup were used as gene sets and tested for their enrichment. Shown are NES (normalized enrichment scores), along with their representative P values and false discovery rates (FDR).
Sall4a and Sall4b targets have different epigenetic marks.
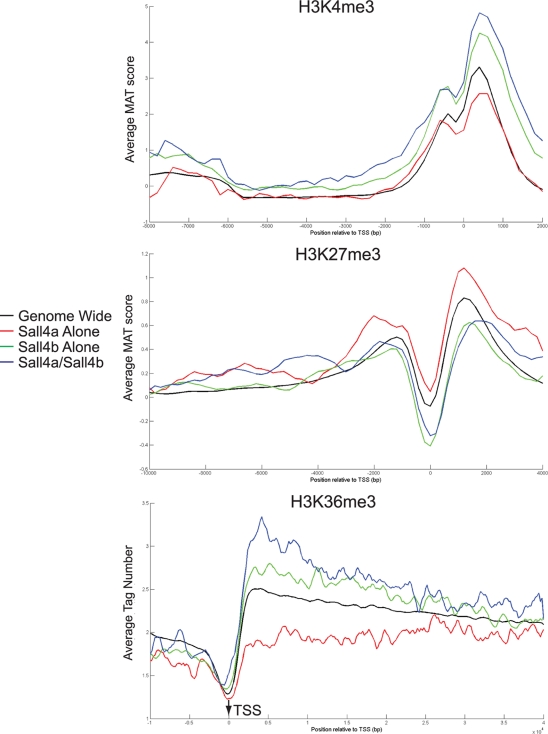
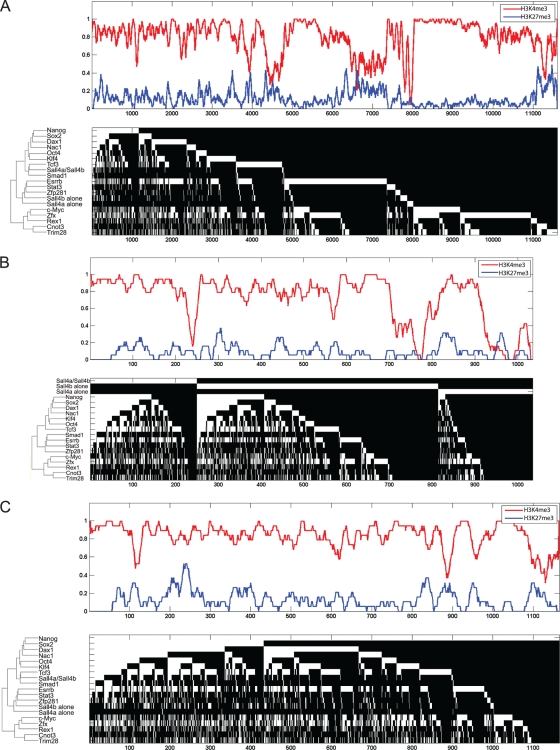
Given the strong differences seen between the individual subgroups, we evaluated histone methylation marks at the binding sites of Sall4a and Sall4b. Specifically, we correlated the binding sites with three epigenetic marks, namely, H3K4 tri-methylation (H3K4me3), which is associated with gene activation and typically enriched around promoters; H3K27 trimethylation (H3K27me3), a repressive mark found around promoters; and H3K36 trimethylation (H3K36me3), which is associated with gene activation but enriched predominantly within transcribed regions of gene bodies (3, 29, 32, 38). Binding sites for Sall4b alone and Sall4a/Sall4b revealed enrichment for the activating marks of H3K4me3 and H3K36me3 and were depleted in H3K27me3 relative to the genome as a whole, whereas the binding sites of Sall4a showed the opposite pattern (Fig. 8). We next assessed how these epigenetic marks changed as Sall4 isoforms bound to the loci in the presence or absence of other members of the core pluripotency network. First, a smoothed average histone modification level for H3K27me3 and H3K4me3 was created at all loci bound by any pluripotency factor (upper panels in Fig. 9). Next, we performed hierarchical clustering of 16 factors and the three subgroups of Sall4 isoforms with binding sites of individual proteins shown in white at the same DNA positions (Fig. 9, lower panels; all loci shown in panel A); we separated out the Sall4 subgroups (Fig. 9B) to better visualize the loci they bound either alone or in combination with other factors. Similar analysis was performed in which only the loci bound by Nanog were shown (Fig. 9C). A dramatic reduction in the levels of H3K4me3 was seen at loci bound only by Sall4 isoforms, in the absence of other pluripotency factors, indicating that these genes were not expressed. In contrast, when Sall4 isoforms bound to loci in combination with other factors, H3K4me3 levels were high, indicating that these genes were poised for transcription or actively expressed. A similar correlation of gene expression with multifactor co-occupancy has been previously described for Nanog and other pluripotency factors (21). Together, this indicates that Sall4 isoforms work in concert with other transcription factors at transcriptionally active loci, but in isolation function predominantly not as activators.
FIG. 8.
Loci bound by Sall4 isoforms have different histone methylation marks. The binding sites of Sall4a/Sall4b, Sall4a alone, and Sall4b alone had the levels for three histone marks (H3K4me3, H3K27me3, and H3K36me3) curated from the literature (detailed in Materials and Methods) and plotted based upon subgroup and distance from the transcriptional start site (TSS).
FIG. 9.
Sall4 isoforms have different epigenetic marks when they bind alone or in combination with other transcription factors. The upper portion for each panel is a smoothed histone modification status for H3K27me3 (blue) and H3K4me3 (red) over all of the DNA loci bound (1 = presence; 0 = absence). The lower portion in each panel is a hierarchical clustering indicating the binding of each factor (in white) or absence of binding (in black) shown to indicate the area(s) bound by single or multiple factors at a given DNA site. (A) All loci are shown. (B) Only loci bound by at least one isoform of Sall4 are shown. The loci bound by Sall4a alone, Sall4b alone, and Sall4a/Sall4b have been removed from the clustering and are shown at the top for emphasis. (C) Only loci bound by Nanog are shown.
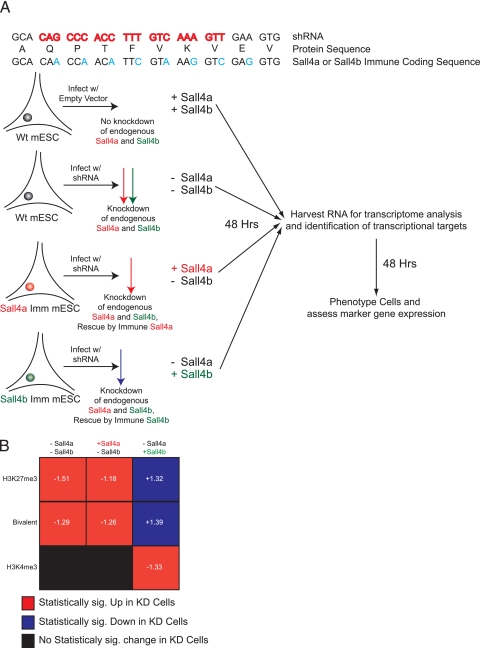
We next sought to assess transcriptional changes from loci with different epigenetic marks expressing a single isoform of Sall4. We knocked down both isoforms of endogenous Sall4 using a lentivirus-based shRNA and rescued the Sall4-depleted cells by constitutive expression of Sall4a or Sall4b cDNAs that were engineered to be immune to the shRNA by mutation of every third base pair in the targeted region (Fig. 10 A). As a control, wild-type cells were infected with the parental shRNA vector not containing an shRNA. This strategy generated cells with four distinct combinations of Sall4 isoforms: Wild-type (wt) or +Sall4 +Sall4b, −Sall4a −Sall4b, +Sall4a −Sall4b, or −Sall4a +Sall4b. At 48 h after infection and selection with puromycin, we observed a profound reduction in the endogenous levels of Sall4 mRNA by ∼80 to 90%, but the immune versions were able to rescue expression to wild-type levels (data not shown). We wanted to know how the expression of genes changed across our four combinations based upon methylation status (H3K27me3-rich, H3K4me3-rich, or bivalent domain) using GSEA. As summarized in Fig. 10B, depletion of both isoforms (−Sall4a −Sall4b) led to an increase in expression of genes with either the bivalent mark or H3K27me3-rich genes compared to +Sall4a +Sall4b. This implies that depletion of Sall4 isoforms is associated with derepression of these genes. No statistically significant change in the expression of genes marked by H3K4me3 was observed. Upon rescue with Sall4a (+Sall4a −Sall4b), no significant change in gene expression with regard to histone methylation status compared to loss of both isoforms was observed, implying that Sall4a alone could not repress gene expression at loci marked by H3K27me3 or the bivalent mark in the absence of Sall4b. In contrast, upon expression of Sall4b alone (−Sall4a +Sall4b), H3K27me3 and bivalent marked loci showed statistically significant lower gene expression compared to the wild type, implying that Sall4b was able to properly repress transcription from these loci in the absence of Sall4a. In addition, rescue by Sall4b led to the enrichment of loci marked by H3K4me3, implying that in the absence of Sall4a, Sall4b alone may drive high expression of genes already marked for activation. Taken together, these data argue for the involvement of both isoforms in gene regulation and that the balance of the two is critical for regulating the pluripotent state, especially at gene loci containing distinct epigenetic marks.
FIG. 10.
Sall4b is necessary to preserve gene expression. (A) Schematic diagram showing our rescue approach using lentivirus-based knockdown of both isoforms of Sall4 in the presence of an immune version of either isoform. Cells were selected for either 48 h after infection (for microarray) or 96 h after infection (for phenotypic characterization). (B) Summary of GSEA data. The groups (−Sall4a −Sall4b, +Sall4a −Sall4b, −Sall4a +Sall4b) were compared to the wild type (+Sall4a +Sall4b) for each individual gene set to determine which phenotype they were enriched in. Statistical significance is a P value of <5% and an FDR of <25%. Normalized enrichment scores (NES) are shown in white for statistically enriched gene sets; negative scores indicate upregulation in the knockdown cells, and positive scores indicate repression in the knockdown cells compared to the wild type.
Sall4b is required to maintain the pluripotent state.
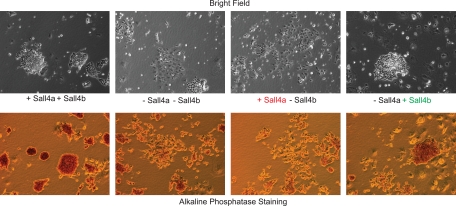
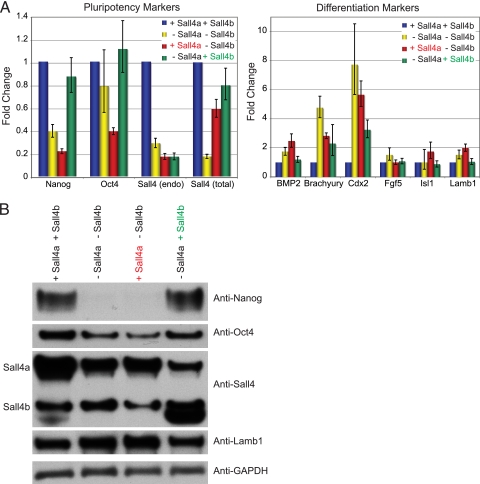
To test further the role of the two isoforms in pluripotency, we assessed the phenotype of rescued cells at longer time points to determine whether each isoform was required for the maintenance of a pluripotent state and/or differentiation along specific lineages. +Sall4a +Sall4b cells infected with empty virus displayed typical compact, three-dimensional ES colonies grown in the absence of feeders and were positive for the pluripotency marker alkaline phosphatase (Fig. 11). In contrast, infection of the wild-type cells with the Sall4 shRNA (−Sall4a −Sall4b) led to diverse colony morphologies and the loss of alkaline phosphatase staining, a finding consistent with differentiation and exit from the pluripotent state. Cells expressing only Sall4a (+Sall4a −Sall4b) displayed no ES cell-like colonies or alkaline phosphatase staining and resembled wild-type cells infected with the shRNA. In contrast, cells expressing Sall4b alone (−Sall4a +Sall4b) partially restored the ES phenotype in that the cultures were mixed, with the presence of some ES cell colonies (by morphology and alkaline phosphatase staining) and other differentiated cell types. To further examine the rescue of pluripotency and suppression of differentiation markers, RNA was harvested and subject to RT-qPCR to examine marker gene expression (Fig. 12 A). Endogenous Sall4 transcript was depleted by the shRNA as previously (∼80%); however, the levels of total Sall4 transcripts (either the exogenous cDNA or endogenous transcripts of either isoform) showed modest rescue, although not quite to wild-type levels. Western blotting (Fig. 12B) showed a similar although perhaps not as dramatic pattern. The expression of Nanog and Oct4 was reduced in −Sall4a −Sall4b cells but rescued by the expression of Sall4b (−Sall4a +Sall4b) but not Sall4a (+Sall4a −Sall4b) at the level of both RNA (Fig. 12A) and protein (Fig. 12B). We next assessed markers of differentiation. Some markers could be suppressed completely (Fgf5, ectoderm) or partially (Brachyury, mesoderm; Cdx, trophectoderm) by either isoform (+Sall4a −Sall4b or −Sall4a +Sall4b); in contrast, other markers could only be suppressed by the expression of Sall4b (−Sall4a +Sall4b, Lamb1, parietal endoderm; BMP2, mesoderm and visceral endoderm). Taken together, these data imply that Sall4b but not Sall4a partially compensates for the loss of both isoforms of Sall4, with rescue of pluripotency and at least partial suppression of some, but not all, differentiation markers.
FIG. 11.
Sall4b but not Sall4a can rescue the loss of both isoforms. The rescue cells were cultured in the presence of puromycin for 96 h postinfection and had their phenotype assayed by microscopy and alkaline phosphatase staining.
FIG. 12.
Sall4b but not Sall4a can rescue expression of pluripotency markers. (A and B) RNA profile (A) and protein profile (B) determined using specific markers of pluripotency and differentiation. For RNA, the data shown are normalized to cells infected with the empty lentivirus and cultured under similar conditions, normalized to actin, and shown along with the SEM of technical replicates.
DISCUSSION
Although ES cells are defined by self-renewal and pluripotency, they possess a number of other unique properties, including a diversity of splice isoforms. Splice isoforms can form distinct protein-protein interactions that may lead to developmental state-specific regulatory networks, thereby increasing the biologic complexity referable to a single locus. For example, Oct4 is expressed as at least two isoforms: the long isoform (Oct4A) is expressed in ES cells, and shorter versions (Oct4B and Oct4B1) are expressed in more differentiated cell types (2), although no clear biological function has been ascribed to the shorter isoforms. Recently, it has been shown that the large repertoire of splice isoforms expressed in ES cells is gradually reduced in absolute number during neural differentiation (44). In addition, during both neural and cardiac differentiation, the specific repertoire of splice isoforms present in the pluripotent versus committed lineages changes (36). These changes in splice isoform repertoire imply that ES cells likely utilize their large and unique set of splice isoforms to sustain a pluripotent state.
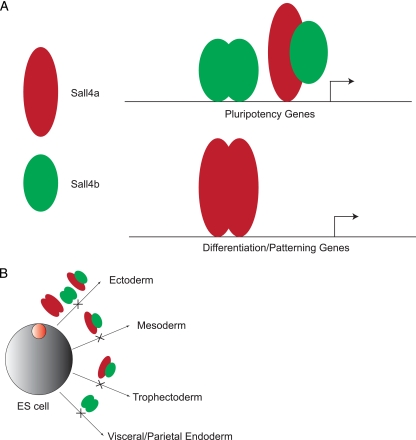
Since assessment of global changes in the quantity or range of splice isoforms is currently not technically feasible, we chose to use the two isoforms of Sall4 in a candidate gene approach. The choice of Sall4 is based on the observations that the locus produces two splice isoforms that are expressed in ES cells, disruption of the locus results in a loss of pluripotency, and overexpression of one of the isoforms (Sall4b) is associated with AML in mouse models. Our data demonstrate that the two isoforms have overlapping but nonidentical binding sites within the ES cell genome. The binding sites of both Sall4a/Sall4b and Sall4b alone are enriched for pluripotency genes, whereas Sall4 alone predominantly binds to differentiation and patterning gene (Fig. 13 A). Differential binding of the two isoforms to different DNA sites has been shown on a small scale by others (26), but the present study is the first genomewide characterization of the binding sites of the individual splice isoforms of a transcription factor. Our ChIP-on-Chip approach cannot determine whether the sites bound by both Sall4a and Sall4b are bound in vivo by a heterodimer of the two or different homodimers (Sall4a/Sall4a and Sall4b/Sall4b) which vary between individual cells. Despite this limitation, given our evidence that the two isoforms form both heterodimers and homodimers, we favor a heterodimer of Sall4a and Sall4b as being the critical species at these loci. Furthermore, while our data suggest that these hetero- and homodimers bind to distinct loci, the possibility exists that in vivo all three species of Sall4 bind to any given locus, although at different ratios, with one species predominating at certain loci. Distinguishing between these models would be challenging in that it would require directly altering in vivo the levels of Sall4a/Sall4b heterodimers and of Sall4a and Sall4b homodimers independently.
FIG. 13.
Model of the differential roles for Sall4a and Sall4b. (A) Sall4a/Sall4b heterodimers and Sall4b homodimers are responsible for regulating pluripotency genes, whereas homodimers of Sall4a are predominantly required for regulating differentiation and/or patterning genes. (B) The role of different isoform species (Sall4a, Sall4b, or Sall4a/Sall4b) in regulating differentiation into multiple early lineages.
Perhaps most surprising is the observation that Sall4b, not Sall4a, partially rescues the pluripotent state caused by depletion of both isoforms by shRNA. One likely explanation is that Sall4b homodimers are able to bind at lower affinity to certain critical loci normally bound by a heterodimer of the two, thereby rescuing some but not all of the cells to a pluripotent state. This is further substantiated by incomplete suppression of differentiation markers (such as Brachyury and Cdx2) by Sall4b. The most likely model posits that the two isoforms work to regulate pluripotency by blocking differentiation along specific lineages (Fig. 13B). In this model, some lineages are suppressed by either isoform (such as ectoderm), while other lineages would require both isoforms for complete suppression (such as mesoderm and trophectoderm), and yet other lineages are blocked by a single isoform (such as visceral and parietal endoderm by Sall4b alone). Further analysis of cells expressing a single isoform will be required to further delineate the role of each isoform in lineage commitment. One of the reasons why these differences were not appreciated in previous work is that the techniques used (antibodies, gene targeting, or RNA interference) detect and/or disrupt both isoforms equally, making it impossible to uncover the differences between the two isoforms.
Although our study does not directly assess the mechanism(s) by which the two isoforms mediate their different effects, one possibility is that each species of Sall4 (homodimers of each and heterodimers of the two) has a unique DNA-binding specificity. However, our data would suggest this is not the case, in that Sall4a/Sall4b and Sall4b alone have virtually identical consensus binding sequences (Fig. 6B) but colocalize with distinct subsets of pluripotency factors (Fig. 6C and D), implying that another mechanism beyond DNA binding specificity alone targets the isoforms to different loci. It is more likely that the difference is predominantly mediated at the level of protein-protein interactions. For example, Sall4a might be recruited away from pluripotency genes toward differentiation-associated loci by an unidentified factor through physical interaction(s) mediated by the domain absent from Sall4b. Preliminary data from our lab suggests that the isoforms of Sall4 form distinct nuclear complexes (data not shown), implying that the two isoforms form distinct protein-protein interactions. Elucidation of proteins that specifically recognize Sall4a may lead to the identification of negative regulators of the pluripotent state.
Supplementary Material
Acknowledgments
S.R. is funded by a Career Development Award from the NHLBI (5K08HL87951). S.H.O. is an investigator of the HHMI. G.Y. is supported by a Claudia Adams Barr Award.
We thank Xiaohua Shen and Jonathan Snow for helpful discussions during preparation of the manuscript. We thank W. Hahn for supplying the empty lentiviral vector pLKO.1 and I. Chambers and A. Smith for providing the pPyCAG vectors used in this study.
Footnotes
Published ahead of print on 13 September 2010.
Supplemental material for this article may be found at http://mcb.asm.org/.
REFERENCES
- 1.Al-Baradie, R., K. Yamada, C. St. Hilaire, W. M. Chan, C. Andrews, N. McIntosh, M. Nakano, E. J. Martonyi, W. R. Raymond, S. Okumura, M. M. Okihiro, and E. C. Engle. 2002. Duane radial ray syndrome (Okihiro syndrome) maps to 20q13 and results from mutations in SALL4, a new member of the SAL family. Am. J. Hum. Genet. 71:1195-1199. [DOI] [PMC free article] [PubMed] [Google Scholar]
- 2.Atlasi, Y., S. J. Mowla, S. A. Ziaee, P. J. Gokhale, and P. W. Andrews. 2008. OCT4 spliced variants are differentially expressed in human pluripotent and nonpluripotent cells. Stem Cells 26:3068-3074. [DOI] [PubMed] [Google Scholar]
- 3.Bernstein, B. E., T. S. Mikkelsen, X. Xie, M. Kamal, D. J. Huebert, J. Cuff, B. Fry, A. Meissner, M. Wernig, K. Plath, R. Jaenisch, A. Wagschal, R. Feil, S. L. Schreiber, and E. S. Lander. 2006. A bivalent chromatin structure marks key developmental genes in embryonic stem cells. Cell 125:315-326. [DOI] [PubMed] [Google Scholar]
- 4.Boheler, K. R. 2009. Stem cell pluripotency: a cellular trait that depends on transcription factors, chromatin state and a checkpoint deficient cell cycle. J. Cell Physiol. 221:10-17. [DOI] [PMC free article] [PubMed] [Google Scholar]
- 5.Bohm, J., A. Buck, W. Borozdin, A. U. Mannan, U. Matysiak-Scholze, I. Adham, W. Schulz-Schaeffer, T. Floss, W. Wurst, J. Kohlhase, and F. Barrionuevo. 2008. Sall1, sall2, and sall4 are required for neural tube closure in mice. Am. J. Pathol. 173:1455-1463. [DOI] [PMC free article] [PubMed] [Google Scholar]
- 6.Chambers, I., D. Colby, M. Robertson, J. Nichols, S. Lee, S. Tweedie, and A. Smith. 2003. Functional expression cloning of Nanog, a pluripotency sustaining factor in embryonic stem cells. Cell 113:643-655. [DOI] [PubMed] [Google Scholar]
- 7.Chambers, I., and S. R. Tomlinson. 2009. The transcriptional foundation of pluripotency. Development 136:2311-2322. [DOI] [PMC free article] [PubMed] [Google Scholar]
- 8.Chen, X., H. Xu, P. Yuan, F. Fang, M. Huss, V. B. Vega, E. Wong, Y. L. Orlov, W. Zhang, J. Jiang, Y. H. Loh, H. C. Yeo, Z. X. Yeo, V. Narang, K. R. Govindarajan, B. Leong, A. Shahab, Y. Ruan, G. Bourque, W. K. Sung, N. D. Clarke, C. L. Wei, and H. H. Ng. 2008. Integration of external signaling pathways with the core transcriptional network in embryonic stem cells. Cell 133:1106-1117. [DOI] [PubMed] [Google Scholar]
- 9.Cole, M. F., S. E. Johnstone, J. J. Newman, M. H. Kagey, and R. A. Young. 2008. Tcf3 is an integral component of the core regulatory circuitry of embryonic stem cells. Genes Dev. 22:746-755. [DOI] [PMC free article] [PubMed] [Google Scholar]
- 10.Cui, W., N. R. Kong, Y. Ma, H. M. Amin, R. Lai, and L. Chai. 2006. Differential expression of the novel oncogene, SALL4, in lymphoma, plasma cell myeloma, and acute lymphoblastic leukemia. Mod. Pathol. 19:1585-1592. [DOI] [PubMed] [Google Scholar]
- 11.Dennis, G., Jr., B. T. Sherman, D. A. Hosack, J. Yang, W. Gao, H. C. Lane, and R. A. Lempicki. 2003. DAVID: database for annotation, visualization, and integrated discovery. Genome Biol. 4:P3. [PubMed] [Google Scholar]
- 12.Efroni, S., R. Duttagupta, J. Cheng, H. Dehghani, D. J. Hoeppner, C. Dash, D. P. Bazett-Jones, S. Le Grice, R. D. McKay, K. H. Buetow, T. R. Gingeras, T. Misteli, and E. Meshorer. 2008. Global transcription in pluripotent embryonic stem cells. Cell Stem Cell 2:437-447. [DOI] [PMC free article] [PubMed] [Google Scholar]
- 13.Elling, U., C. Klasen, T. Eisenberger, K. Anlag, and M. Treier. 2006. Murine inner cell mass-derived lineages depend on Sall4 function. Proc. Natl. Acad. Sci. U. S. A. 103:16319-16324. [DOI] [PMC free article] [PubMed] [Google Scholar]
- 14.Hailesellasse Sene, K., C. J. Porter, G. Palidwor, C. Perez-Iratxeta, E. M. Muro, P. A. Campbell, M. A. Rudnicki, and M. A. Andrade-Navarro. 2007. Gene function in early mouse embryonic stem cell differentiation. BMC Genomics 8:85. [DOI] [PMC free article] [PubMed] [Google Scholar]
- 15.Hu, G., J. Kim, Q. Xu, Y. Leng, S. H. Orkin, and S. J. Elledge. 2009. A genome-wide RNAi screen identifies a new transcriptional module required for self-renewal. Genes Dev. 23:837-848. [DOI] [PMC free article] [PubMed] [Google Scholar]
- 16.Huang da, W., B. T. Sherman, and R. A. Lempicki. 2009. Systematic and integrative analysis of large gene lists using DAVID bioinformatics resources. Nat. Protoc. 4:44-57. [DOI] [PubMed] [Google Scholar]
- 17.Irizarry, R. A., B. Hobbs, F. Collin, Y. D. Beazer-Barclay, K. J. Antonellis, U. Scherf, and T. P. Speed. 2003. Exploration, normalization, and summaries of high density oligonucleotide array probe level data. Biostatistics 4:249-264. [DOI] [PubMed] [Google Scholar]
- 18.Ivanova, N., R. Dobrin, R. Lu, I. Kotenko, J. Levorse, C. DeCoste, X. Schafer, Y. Lun, and I. R. Lemischka. 2006. Dissecting self-renewal in stem cells with RNA interference. Nature 442:533-538. [DOI] [PubMed] [Google Scholar]
- 19.Ji, H., H. Jiang, W. Ma, D. S. Johnson, R. M. Myers, and W. H. Wong. 2008. An integrated software system for analyzing ChIP-chip and ChIP-seq data. Nat. Biotechnol. 26:1293-1300. [DOI] [PMC free article] [PubMed] [Google Scholar]
- 20.Johnson, W. E., W. Li, C. A. Meyer, R. Gottardo, J. S. Carroll, M. Brown, and X. S. Liu. 2006. Model-based analysis of tiling-arrays for ChIP-chip. Proc. Natl. Acad. Sci. U. S. A. 103:12457-12462. [DOI] [PMC free article] [PubMed] [Google Scholar]
- 21.Kim, J., J. Chu, X. Shen, J. Wang, and S. H. Orkin. 2008. An extended transcriptional network for pluripotency of embryonic stem cells. Cell 132:1049-1061. [DOI] [PMC free article] [PubMed] [Google Scholar]
- 22.Kohlhase, J., M. Heinrich, M. Liebers, L. Frohlich Archangelo, W. Reardon, and A. Kispert. 2002. Cloning and expression analysis of SALL4, the murine homologue of the gene mutated in Okihiro syndrome. Cytogenet. Genome Res. 98:274-277. [DOI] [PubMed] [Google Scholar]
- 23.Kohlhase, J., M. Heinrich, L. Schubert, M. Liebers, A. Kispert, F. Laccone, P. Turnpenny, R. M. Winter, and W. Reardon. 2002. Okihiro syndrome is caused by SALL4 mutations. Hum. Mol. Genet. 11:2979-2987. [DOI] [PubMed] [Google Scholar]
- 24.Kunarso, G., K. Y. Wong, L. W. Stanton, and L. Lipovich. 2008. Detailed characterization of the mouse embryonic stem cell transcriptome reveals novel genes and intergenic splicing associated with pluripotency. BMC Genomics 9:155. [DOI] [PMC free article] [PubMed] [Google Scholar]
- 25.Lim, C. Y., W. L. Tam, J. Zhang, H. S. Ang, H. Jia, L. Lipovich, H. H. Ng, C. L. Wei, W. K. Sung, P. Robson, H. Yang, and B. Lim. 2008. Sall4 regulates distinct transcription circuitries in different blastocyst-derived stem cell lineages. Cell Stem Cell 3:543-554. [DOI] [PubMed] [Google Scholar]
- 26.Lu, J., H. W. Jeong, N. Kong, Y. Yang, J. Carroll, H. R. Luo, L. E. Silberstein, Yupoma, and L. Chai. 2009. Stem cell factor SALL4 represses the transcriptions of PTEN and SALL1 through an epigenetic repressor complex. PLoS One 4:e5577. [DOI] [PMC free article] [PubMed] [Google Scholar]
- 27.Lupien, M., J. Eeckhoute, C. A. Meyer, Q. Wang, Y. Zhang, W. Li, J. S. Carroll, X. S. Liu, and M. Brown. 2008. FoxA1 translates epigenetic signatures into enhancer-driven lineage-specific transcription. Cell 132:958-970. [DOI] [PMC free article] [PubMed] [Google Scholar]
- 28.Ma, Y., W. Cui, J. Yang, J. Qu, C. Di, H. M. Amin, R. Lai, J. Ritz, D. S. Krause, and L. Chai. 2006. SALL4, a novel oncogene, is constitutively expressed in human acute myeloid leukemia (AML) and induces AML in transgenic mice. Blood 108:2726-2735. [DOI] [PMC free article] [PubMed] [Google Scholar]
- 29.Mikkelsen, T. S., M. Ku, D. B. Jaffe, B. Issac, E. Lieberman, G. Giannoukos, P. Alvarez, W. Brockman, T. K. Kim, R. P. Koche, W. Lee, E. Mendenhall, A. O'Donovan, A. Presser, C. Russ, X. Xie, A. Meissner, M. Wernig, R. Jaenisch, C. Nusbaum, E. S. Lander, and B. E. Bernstein. 2007. Genome-wide maps of chromatin state in pluripotent and lineage-committed cells. Nature 448:553-560. [DOI] [PMC free article] [PubMed] [Google Scholar]
- 30.Mitsui, K., Y. Tokuzawa, H. Itoh, K. Segawa, M. Murakami, K. Takahashi, M. Maruyama, M. Maeda, and S. Yamanaka. 2003. The homeoprotein Nanog is required for maintenance of pluripotency in mouse epiblast and ES cells. Cell 113:631-642. [DOI] [PubMed] [Google Scholar]
- 31.Nichols, J., B. Zevnik, K. Anastassiadis, H. Niwa, D. Klewe-Nebenius, I. Chambers, H. Scholer, and A. Smith. 1998. Formation of pluripotent stem cells in the mammalian embryo depends on the POU transcription factor Oct4. Cell 95:379-391. [DOI] [PubMed] [Google Scholar]
- 32.Nimura, K., K. Ura, H. Shiratori, M. Ikawa, M. Okabe, R. J. Schwartz, and Y. Kaneda. 2009. A histone H3 lysine 36 trimethyltransferase links Nkx2-5 to Wolf-Hirschhorn syndrome. Nature 460:287-291. [DOI] [PubMed] [Google Scholar]
- 33.Orkin, S. H., J. Wang, J. Kim, J. Chu, S. Rao, T. W. Theunissen, X. Shen, and D. N. Levasseur. 2008. The transcriptional network controlling pluripotency in ES cells. Cold Spring Harbor Symp. Quant. Biol. 23:195-202. [DOI] [PubMed]
- 34.Rao, S., and S. H. Orkin. 2006. Unraveling the transcriptional network controlling ES cell pluripotency. Genome Biol. 7:230. [DOI] [PMC free article] [PubMed] [Google Scholar]
- 35.Sakaki-Yumoto, M., C. Kobayashi, A. Sato, S. Fujimura, Y. Matsumoto, M. Takasato, T. Kodama, H. Aburatani, M. Asashima, N. Yoshida, and R. Nishinakamura. 2006. The murine homolog of SALL4, a causative gene in Okihiro syndrome, is essential for embryonic stem cell proliferation, and cooperates with Sall1 in anorectal, heart, brain, and kidney development. Development 133:3005-3013. [DOI] [PubMed] [Google Scholar]
- 36.Salomonis, N., B. Nelson, K. Vranizan, A. R. Pico, K. Hanspers, A. Kuchinsky, L. Ta, M. Mercola, and B. R. Conklin. 2009. Alternative splicing in the differentiation of human embryonic stem cells into cardiac precursors. PLoS Comput. Biol. 5:e1000553. [DOI] [PMC free article] [PubMed] [Google Scholar]
- 37.Salomonis, N., C. R. Schlieve, L. Pereira, C. Wahlquist, A. Colas, A. C. Zambon, K. Vranizan, M. J. Spindler, A. R. Pico, M. S. Cline, T. A. Clark, A. Williams, J. E. Blume, E. Samal, M. Mercola, B. J. Merrill, and B. R. Conklin. Alternative splicing regulates mouse embryonic stem cell pluripotency and differentiation. Proc. Natl. Acad. Sci. U. S. A. 107:10514-10519. [DOI] [PMC free article] [PubMed]
- 38.Shen, X., Y. Liu, Y. J. Hsu, Y. Fujiwara, J. Kim, X. Mao, G. C. Yuan, and S. H. Orkin. 2008. EZH1 mediates methylation on histone H3 lysine 27 and complements EZH2 in maintaining stem cell identity and executing pluripotency. Mol. Cell 32:491-502. [DOI] [PMC free article] [PubMed] [Google Scholar]
- 39.Takahashi, K., and S. Yamanaka. 2006. Induction of pluripotent stem cells from mouse embryonic and adult fibroblast cultures by defined factors. Cell 126:663-676. [DOI] [PubMed] [Google Scholar]
- 40.Tsubooka, N., T. Ichisaka, K. Okita, K. Takahashi, M. Nakagawa, and S. Yamanaka. 2009. Roles of Sall4 in the generation of pluripotent stem cells from blastocysts and fibroblasts. Genes Cells 14:683-694. [DOI] [PubMed] [Google Scholar]
- 41.Uez, N., H. Lickert, J. Kohlhase, M. H. de Angelis, R. Kuhn, W. Wurst, and T. Floss. 2008. Sall4 isoforms act during proximal-distal and anterior-posterior axis formation in the mouse embryo. Genesis 46:463-477. [DOI] [PubMed] [Google Scholar]
- 42.Wang, J., S. Rao, J. Chu, X. Shen, D. N. Levasseur, T. W. Theunissen, and S. H. Orkin. 2006. A protein interaction network for pluripotency of embryonic stem cells. Nature 444:364-368. [DOI] [PubMed] [Google Scholar]
- 43.Warren, M., W. Wang, S. Spiden, D. Chen-Murchie, D. Tannahill, K. P. Steel, and A. Bradley. 2007. A Sall4 mutant mouse model useful for studying the role of Sall4 in early embryonic development and organogenesis. Genesis 45:51-58. [DOI] [PMC free article] [PubMed] [Google Scholar]
- 44.Wu, J. Q., L. Habegger, P. Noisa, A. Szekely, C. Qiu, S. Hutchison, D. Raha, M. Egholm, H. Lin, S. Weissman, W. Cui, M. Gerstein, and M. Snyder. 2010. Dynamic transcriptomes during neural differentiation of human embryonic stem cells revealed by short, long, and paired-end sequencing. Proc. Natl. Acad. Sci. U. S. A. 107:5254-5259. [DOI] [PMC free article] [PubMed] [Google Scholar]
- 45.Wu, Q., X. Chen, J. Zhang, Y. H. Loh, T. Y. Low, W. Zhang, W. Zhang, S. K. Sze, B. Lim, and H. H. Ng. 2006. Sall4 interacts with Nanog and co-occupies Nanog genomic sites in embryonic stem cells. J. Biol. Chem. 281:24090-24094. [DOI] [PubMed] [Google Scholar]
- 46.Yang, J., L. Chai, F. Liu, L. M. Fink, P. Lin, L. E. Silberstein, H. M. Amin, D. C. Ward, and Y. Ma. 2007. Bmi-1 is a target gene for SALL4 in hematopoietic and leukemic cells. Proc. Natl. Acad. Sci. U. S. A. 104:10494-10499. [DOI] [PMC free article] [PubMed] [Google Scholar]
- 47.Yeo, G. W., X. Xu, T. Y. Liang, A. R. Muotri, C. T. Carson, N. G. Coufal, and F. H. Gage. 2007. Alternative splicing events identified in human embryonic stem cells and neural progenitors. PLoS Comput. Biol. 3:e196. [DOI] [PMC free article] [PubMed] [Google Scholar]
- 48.Yu, J., M. A. Vodyanik, K. Smuga-Otto, J. Antosiewicz-Bourget, J. L. Frane, S. Tian, J. Nie, G. A. Jonsdottir, V. Ruotti, R. Stewart, Slukvin, I. I. and J. A. Thomson. 2007. Induced pluripotent stem cell lines derived from human somatic cells. Science 318:1917-1920. [DOI] [PubMed] [Google Scholar]
- 49.Zhang, J., W. L. Tam, G. Q. Tong, Q. Wu, H. Y. Chan, B. S. Soh, Y. Lou, J. Yang, Y. Ma, L. Chai, H. H. Ng, T. Lufkin, P. Robson, and B. Lim. 2006. Sall4 modulates embryonic stem cell pluripotency and early embryonic development by the transcriptional regulation of Pou5f1. Nat. Cell Biol. 8:1114-1123. [DOI] [PubMed] [Google Scholar]
Associated Data
This section collects any data citations, data availability statements, or supplementary materials included in this article.


