Abstract
The surface layers (S layers) of those bacteria and archaea that elaborate these crystalline structures have been studied for 40 years. However, most structural analysis has been based on electron microscopy of negatively stained S-layer fragments separated from cells, which can introduce staining artifacts and allow rearrangement of structures prone to self-assemble. We present a quantitative analysis of the structure and organization of the S layer on intact growing cells of the Gram-negative bacterium Caulobacter crescentus using cryo-electron tomography (CET) and statistical image processing. Instead of the expected long-range order, we observed different regions with hexagonally organized subunits exhibiting short-range order and a broad distribution of periodicities. Also, areas of stacked double layers were found, and these increased in extent when the S-layer protein (RsaA) expression level was elevated by addition of multiple rsaA copies. Finally, we combined high-resolution amino acid residue-specific Nanogold labeling and subtomogram averaging of CET volumes to improve our understanding of the correlation between the linear protein sequence and the structure at the 2-nm level of resolution that is presently available. The results support the view that the U-shaped RsaA monomer predicted from negative-stain tomography proceeds from the N terminus at one vertex, corresponding to the axis of 3-fold symmetry, to the C terminus at the opposite vertex, which forms the prominent 6-fold symmetry axis. Such information will help future efforts to analyze subunit interactions and guide selection of internal sites for display of heterologous protein segments.
Surface layers (S layers) are the outermost cell wall component in many archaea and bacteria (6, 44). Most S layers are composed of a single protein or glycoprotein species that self-organizes into two-dimensional (2D) lattices of various sizes, usually with square or hexagonal symmetry (7, 14, 43). This geometrical arrangement is almost the only commonality among species, since sequence homology between S-layer proteins is low and functionality differs in many cases. In many archaea, the S layer is the only cell wall component, so it may have a role in shape determination. However, in bacteria such as Caulobacter crescentus, the role is more likely related to protection against a variety of predatorial assaults (8).
One interest in understanding S layers comes from their potential applications in nanotechnology (46) and therapeutic applications, such as anti-HIV microbicide development (37) and cancer therapy (9). The concept is to display heterologous proteins from within the S-layer structure in order to create dense arrays of foreign insertions. Resolving the S-layer organization and structure at high resolution in cells as close to a native state as possible is crucial to understand or predict where proteins are displayed in the array, particularly when more than one foreign peptide is being displayed simultaneously.
A significant limitation has been the difficulty in obtaining an atomic resolution structural analysis for any S layer with standard structural methods, such as X-ray crystallography. It has been assumed that the difficulty in obtaining three-dimensional crystals is the consequence of the propensity for two-dimensional assembly, which prevents the proteins from being sufficiently well behaved for crystallization. Despite that, there are a few examples of limited success for portions of S layers (38, 39). Moreover, many studies have been conducted on isolated in vitro S-layer sheets using negative-stain electron microscopy. This approach removes the interaction of the S layer with other cell wall components, which makes it more difficult to understand how a crystalline structure develops on a growing bacterium. Defects in structure that occur during the introduction of newly secreted subunits or to accommodate covering areas of strong curvature may well not be appreciated in isolated fragments, where rearrangements of the two-dimensional array are likely to occur. This may result in a more regular structure and even assist image analysis methods but does not represent what is occurring on the dynamic cell surface. Quoting Engelhardt (17): “Functional aspects have usually been investigated with isolated S-layer sheets or proteins, which disregards the interactions between S-layers and the underlying cell envelope components.”
Imaging technologies such as freeze-etch and negative-stain microscopy of whole cells (48) can obtain quality images of the S layer directly on the cell. However, each of these techniques presents drawbacks, which would make impossible to extract the conclusions summarized in this paper. For example, it is very difficult to combine freeze-etching with site-specific labeling methods and is impossible with any label in the size range of Nanogold (NG). Moreover, freeze-etch images do not contain three-dimensional (3D) information. Negative staining of S layers on intact cells is difficult and generally can be imaged only on lysed (eviscerated) cells (48). In this case, resolution is hampered by overlying double S layers, membrane debris, and the stain itself. Labeling with the typical 5- to 10-nm colloidal gold probes with either approach is not amenable to averaging techniques designed to localize the labels.
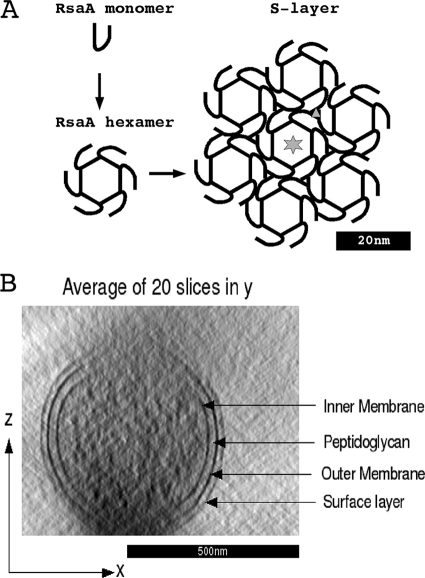
Prior work has shown that C. crescentus, a Gram-negative bacterium, has an S-layer subunit composed of a single highly expressed (27) protein (RsaA), secreted by a type I mechanism, such that there is no cleaved N-terminal signal leader but there is an uncleaved C-terminal secretion signal (4, 11). Six RsaA monomers (12) form the characteristic hexagonal core with p6 symmetry seen by image analysis (47, 48), and the 2D lattice is completed by hexagonal cores connected at junction points with p3 symmetry (Fig. 1 A). Secretion and subsequent self-assembly require calcium (35), and it is assumed that the RTX repeat domain (characteristic of type I secreted proteins) that is located adjacent to the C-terminal secretion signal is responsible for at least some of the calcium interaction; whether there is a second domain to complete subunit-subunit interactions is unknown. The S layer is attached to the outer membrane (OM) surface by interaction of an N-terminal attachment domain of approximately 200 amino acids (18) with the fraction of lipopolysaccharide (LPS) that is modified with an O-polysaccharide (3, 52).
FIG. 1.
(A) Schematic from a previous publication (12) showing how six RsaA monomers build a hexagonal S-layer subunit in C. crescentus. The six-point star shows the center of 6-fold symmetry, and the triangle indicates the center of 3-fold symmetry. The figure is based on results presented previously (35). (B) Cross section of a C. crescentus tomogram to show the cell wall components. The effect of the missing wedge blurring the features on the top and bottom of the cell is obvious.
In this paper, we present a quantitative analysis of the C. crescentus S layer that sheds light on the overall S-layer organization as well as improves our understanding of the structure within the RsaA monomer, in advance of achieving true atomic resolution, by combining cryo-electron tomography (CET) of intact cells with statistical image-processing algorithms. CET is an ideal imaging technology with which to obtain a view of intact prokaryotic cells at molecular resolution (28, 29, 30). This technology allows the visualization of S-layer architecture directly as it exists on the dynamic, growing cell surface. The sample in the microscope is kept close to the native state without staining artifacts, while projections are obtained from different tilt angles to reconstruct a 3D density map of the sample. However, due to low contrast and a generally high sample thickness, CET images have a low signal-to-noise-ratio (SNR). In particular, C. crescentus has a diameter of approximately 600 nm, which is considered close to the thickness limit of CET imaging for these kinds of samples. Statistical image-processing techniques and target samples as thin as possible are needed to overcome the low SNR and to perform quantitative analysis of the S-layer characteristics in situ.
To obtain structural information from within the RsaA monomer, we introduced unique cysteine residues at locations ranging from the N terminus to as close as possible to the C terminus (without disrupting the secretion signal), followed by labeling with maleimide-coupled Nanogold particles. At 1 to 2 nm in size, the Nanogold is not visible in individual CET images of intact cells. However, it is possible to extract thousands of small volumes containing S-layer subunits from CET images and combine them using subtomogram averaging techniques to produce higher-resolution structures. In these averages, we identified locations of high-density areas representing the Nanogold, effectively using the regularity of the S-layer structure to increase the resolution of CET imaging.
In short, we found that the long-range order is substantially lower than we had expected and that there were areas of double layers, especially when RsaA was overexpressed. By comparing the site-specific Nanogold labeling to the 2-nm-resolution structure that is available (47), we have begun to correlate the primary sequence to positions within the averaged hexagonal structure, which represents a significant step toward having a rational basis for site selection for heterologous protein insertions in nanotechnology applications.
MATERIALS AND METHODS
Bacterial strains and growth conditions.
C. crescentus strain CB15 NA1000 (also called CB15N) was used as the wild-type strain in this work (48). C. crescentus strain JS1023 is a CB15 NA1000 derivative, modified by inactivation of rsaA and sapA and introduction of repBAC from the broad-host-range plasmid RSF1010 into xylX. The native sapA and rsaA genes were inactivated by gene replacement with an internal deletion (sapA) or an amber mutation (rsaA353φB). The gene replacements and chromosomal insertion of repBAC were accomplished using pK18mobsacB (41), as described previously (18). Strain JS 1021 is a NA1000 derivative containing only the repBAC insertion (27). Overexpression of rsaA was accomplished by introduction of p4BrsaA600 into JS1021 (27). Escherichia coli strain DH5α (Invitrogen, Carlsbad, CA) was grown at 37°C in LB medium (1% tryptone, 0.5% NaCl, 0.5% yeast extract). C. crescentus strains were grown in PYE medium (0.2% peptone, 0.1% yeast extract, 0.01% CaCl2, 0.02% MgSO4) at 30°C. For growth on solid medium, agar was added at 1.3% (wt/vol). When needed, the media contained chloramphenicol at 20 μg/ml (E. coli) or 2 μg/ml (C. crescentus). Electroporation of C. crescentus was performed as described previously (20). Plasmid DNA was isolated using a Gene Jet miniprep plasmid isolation kit (Fermentas, Burlington, Ontario, Canada).
Introducing unique cysteines into rsaA.
The oligonucleotides JN CYS N-1 (5′-GATCGTCATGCGCTAGCC-3′) and JN CYS N-2 (5′-GATCGGCTAGCGCATGAC-3′), when they were annealed and ligated into a BamHI site, destroyed the original BamHI site and, in the correct orientation, coded for the amino acids SSCASR. This segment was cloned into the unique BamHI sites that were previously installed in rsaA at positions corresponding to amino acids 277 and 353 (10). Similarly, oligonucleotides CYS10F (5′-TCATGTACAG-3′) and CYS10R (5′-TCCTGTACAT-3′), encoding the amino acids SCTG, were annealed and ligated into a BamHI site corresponding to amino acid 944. All introductions were confirmed by DNA sequencing. A BglII site was introduced into rsaA at a position corresponding to amino acid 2 by utilizing an EcoN1 site 45 bp 3′ to the ATG start codon. The oligonucleotide included the EcoN1 site and the 5′ sequence of rsaA, except that the 2nd and 3rd codons were altered to create a BglII site and the codons were changed from Ala-Tyr to Arg-Ser. Use of this oligonucleotide and an oligonucleotide matching the sequence 5′ to an upstream EcoRI site for PCR amplification resulted in a product that could be substituted for native sequence as an EcoRI/EcoN1 segment. The annealed JN CYS N-1 and JN CYS N-2 oligonucleotides were then ligated into the BglII site. The modified versions of rsaA were transferred to p4A as EcoRI/HindIII segments (36). The resulting plasmids were introduced into JS1023 by electroporation. Throughout, these constructs will be referred to as Cys2, Cys277, Cys353, and Cys944.
Protein isolation.
Native and modified RsaA proteins were recovered from the cell surface by low-pH extraction, as described previously (53). Proteins were visualized using sodium dodecyl sulfate-polyacrylamide gel electrophoresis (SDS-PAGE) and 7.5% gels and were stained with Coomassie brilliant blue R.
Nanogold labeling.
Cells were grown in PYE medium to an optical density of approximately 0.4 to 0.6 at 620 nm. The cell number was estimated to be about 108 cells/ml, and because of the Caulobacter life cycle, they were a mix of swarmer and stalked cells. Considering the C. crescentus cell as a cylinder of 600 nm in diameter and 1,500 nm in average length to calculate the total S-layer area and assuming a distance of 22.8 nm between S-layer hexagonal cores, we can approximate the total number of RsaA monomers in a single cell to be 45,000. Using these calculations, monomaleimido NG labeling reagent (Nanoprobes, Inc., Yaphank, NY) was dissolved in 1 ml of double-distilled water. One hundred microliters of the NG suspension was mixed with 900 μl of the whole-cell culture, and then the combination was thoroughly mixed with a pipetter several times for approximately 30 min each time. The resulting sample with a 10-fold excess of NG to S-layer monomers was cryo-plunged, as described below.
Cryo-electron microscopy specimen preparation.
Aliquots of 5 μl were taken directly from the cultures and placed onto lacey carbon grids (01881; Ted Pella) that were pretreated by glow discharge. The Formvar support was not removed from the lacey carbon. The grids were manually blotted and plunged into liquid ethane by a compressed air piston and then stored in liquid nitrogen. For CET, fresh sample aliquots were deposited onto support grids preloaded with 10-nm colloidal gold particles.
Cryo-electron tomography.
Images were acquired on a JEOL3100 electron microscope equipped with a field emission gum (FEG) electron source operating at 300 kV, an Omega energy filter, a Gatan 795 2,048-by-2,048 charge-coupled-device (CCD) camera, and cryo-transfer stage. The stage was cooled to 80 K using liquid nitrogen. Approximately 10% of the data were acquired using a modified Gatan 795 4Kx4K CCD camera with 15-μm pixels mounted at the exit of an electron decelerator (15). The decelerator was operated at 248 kV, resulting in images formed by a 52-kV electron beam at the CCD. A total of 52 tomographic tilt series were acquired under low-dose conditions using the program Serial-EM (31), typically over an angular range between +62° and −62°, ±2° with increments of 1° or 2°. Tilt series of whole-cell images were acquired using a magnification of ×25,000 at the 2Kx2K CCD, giving a pixel size of 1.2 nm at the specimen. Tilt series of stalk images were acquired using a magnification of ×40,000, giving pixel sizes of 0.373 nm at the 4Kx4K decelerator-coupled CCD and of 0.685 nm at the 2Kx2K CCD. The data acquired on the 4Kx4K CCD were subsequently binned by a factor of 2. Underfocus values ranged from 3.6 μm ± 0.5 μm to 12 μm ± 0.5 μm, depending on the goal of the data set, and energy filter widths ranged from 22 eV to 28 eV, also depending on the data set. For all data sets, the maximum dose used per complete tilt series was approximately 140 e−/Å2, with typical values being approximately 100 e−/Å2.
All the tilt series alignments were performed with the RAPTOR program (1) using gold fiducial markers, and the reconstructions were performed with the weighted-back projection provided by the IMOD program (32). Thirty percent of the tilt series were not well aligned by RAPTOR, and the alignment was improved by manually correcting the positions of some gold beads tracked incorrectly. After reconstruction, the tomograms were visually inspected to select the ones where the surface layer was more visible. On the basis of this criterion, 6 whole-cell tomograms and 11 stalk tomograms were selected to perform the various quantitative analyses presented in this paper.
S-layer detection.
In order to extract the structural information presented in this paper, a pipeline was set up to process each data set. After alignment and reconstruction, the S layer was identified and parameterized in each tomogram in order to visualize its arrangement and to extract individual S-layer units for subtomogram averaging. For whole-cell tomograms, the BLASTED program (34) was used to automatically detect the outer membrane. For C. crescentus stalks, the contours were manually segmented using IMOD (26) capabilities. Once the location of the OM in each tomogram was established, we parameterized the surface using cylindrical coordinates and bicubic B splines (33). Using the surface parameterization, the location of S-layer subunits was refined in each tomogram, as described elsewhere (21).
Subtomogram averaging and classification.
Thresholded constrained cross-correlation (TCCC) (2) was used to calculate dissimilarity scores between subtomograms, and the iterative approach presented elsewhere (19) was used to obtain averages of each structure. Specifically, 3,777 boxes of size 76 nm by 76 nm by 76 nm were extracted from six different data sets containing the entire bacterium in the field of view. Each subtomogram was multiplied by a cylindrical mask perpendicular to the outer membrane containing a single hexagonal subunit. The mask is 1 inside the cylinder and 0 outside, and we apply a Gaussian blurring to avoid edge effects. We obtained an initial low-resolution template by averaging 200 boxes selected manually by visual inspection from the extracted surface in one data set.
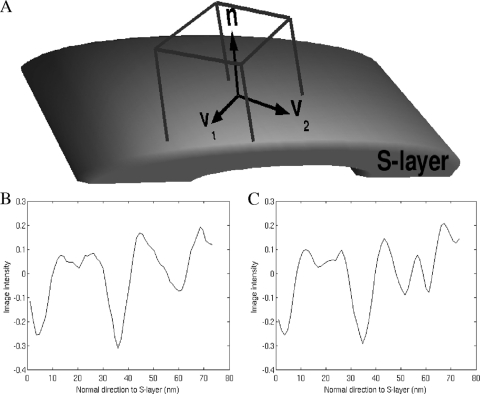
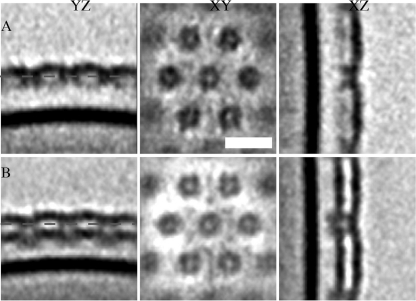
The selection criteria were the overall appearance and location around the cell to uniformly cover missing wedge orientations. Then, we cross-correlated the template along the extracted S-layer surface using the TCCC metric to select points where the dissimilarity score had local minima. The detected boxes were classified into single versus double S layers using the following procedure: we defined a local system of coordinates for each box, where V1 is tangential to the bacterium surface and follows one of the axes of 6-fold symmetry, n̂ is normal to the surface, and V2 is the vector tangential to the surface resulting from the cross product of n̂ × V1 (see Fig. 4A). Using these local coordinates, we summed the intensities along the V1 and V2 axes for each box, effectively generating one-dimensional (1D) density profiles perpendicular to the cell wall with a high SNR (see Fig. 4B and C). In these profiles, it is easy to visualize one or two dips and classify the particles according to single or double S layer. Using this classification procedure, 2,089 boxes contained double S layers and 1,688 had single S layers. Partial results of this analysis to verify the averaging methodology were presented previously (2).
As detailed above, four C. crescentus constructs with specific maleimide NG-reactive sites were produced to identify sites in the primary sequence within the S-layer structure, and tomograms of stalks from the different constructs were obtained at ×40,000 to visualize NG. The procedure to detect, align, and average the S layers in these tomograms was identical to the procedure used for tomograms of the entire cell. In total, we extracted 879 boxes for the wild-type strain, 450 boxes for Cys2, 619 boxes for Cys944, 196 boxes for Cys277, and 199 boxes for Cys353 stalk tomograms.
S-layer visualization.
The SNR in cryo-tomograms is generally too low to use isosurface rendition for informative display of the S layer, and visualization of the whole S layer at once by the use of standard tools that display slices through the volume is not possible. We developed a customized code to generate visualization tool kit (VTK) files (42) that can be displayed by use of Paraview software (23). The main purpose was to triangulate the parameterized S-layer surface and assign an interpolated value of the closest density in the 3D volume to each triangle to render the surface.
RESULTS
S-layer lattice arrangement.
In the first part of this study, we focused on global properties of the S-layer lattice organization by comparing two populations, the wild type and a construct with added copies of rsaA that accumulates 30 to 35% more RsaA on the cell surface (27). The objective was to understand how excess RsaA was stored, with one possibility being that extra protein was more fully populating a lattice that was not saturated with monomers.
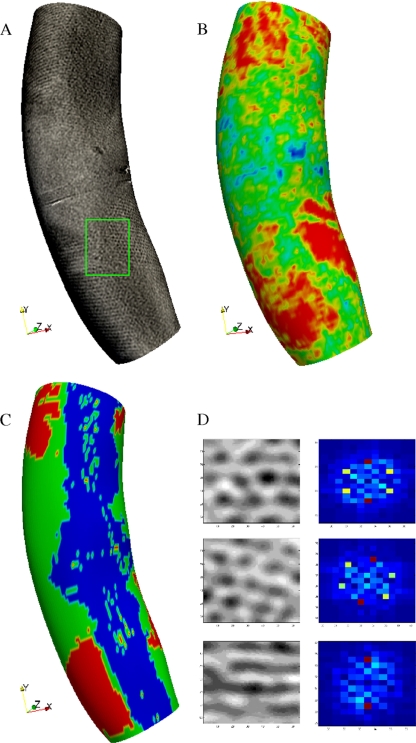
Figure 2 A shows a typical visualization of the rendered S layer for a whole cell: even though it is known that the S layer covers the entire C. crescentus surface (49), we often saw gaps where the hexagonal pattern was not present. Thus, even when RsaA was present across the surface of the bacterium, it did not form a regular hexagonal 2D lattice in all regions. In order to quantify this phenomenon, we generated a heat map of the template-matching score between each point on the surface and the expected hexagonal pattern. The red areas in Fig. 2B indicate a high level of agreement with the expected pattern, and they do not cover the whole surface. Figure 2D shows how the expected pattern needs to be adapted according to the orientation of the surface due to the blurring effect caused by the missing wedge effect. In particular, patches on the top and bottom of the cell wall showed the typical hexagonal pattern, but patches on the side showed only a striped pattern in the direction of the cell axis. Modifying the expected pattern allowed us to search for S-layer patches across the whole bacterium surface. We also rendered sequential extrusions of the surface (see Fig. S1 in the supplemental material), which confirmed that we were not missing any part of the S layer due to the detection algorithm.
FIG. 2.
S-layer visualization for C. crescentus wild-type strain. (A) Rendering of S-layer surface from intersection of the surface with the 3D density values of the tomogram. Patches of S layer are visible on the surface, but no long-range hexagonal coherence is apparent in any region of the surface. The green rectangle indicates a ridge between two areas containing the typical hexagonal S-layer pattern. The horizontal stripe across the middle of the cell is part of the Formvar film used during the sample preparation. In this case, the cell was resting on the Formvar, and the surface rendering displays this fact. (B) Heat map of template-matching scores on the same surface looking for a hexagonal pattern. Red indicates a high correlation, and blue indicates a low correlation. The heat map agrees with the visualization to show that a regular hexagonal pattern is not present in the entire surface. The ridge between two areas growing hexagonal S-layer subunits is apparent at the bottom part of the cell where the green divides two large red areas. These ridges might indicate areas where two growing areas of S layer meet. It is known that the S layer covers the entire bacterial surface (49). However, here we see that it does not arrange in a hexagonal pattern over the entire surface. (C) Spatial distribution of areas with single S layer (green) versus areas with double S layer (red). In some areas (blue), the classification was not possible due to the missing wedge effect. (D) The left column shows examples of hexagonal S-layer patches, and the right column presents the amplitude of the Fourier transform for each patch. The hexagonal pattern is represented by 6 peaks in Fourier space (red and yellow dots) in all except the bottom row, where it is not seen due to the blur caused by the missing wedge. These patterns were used in the template-matching procedure to generate the heat map in panel B.
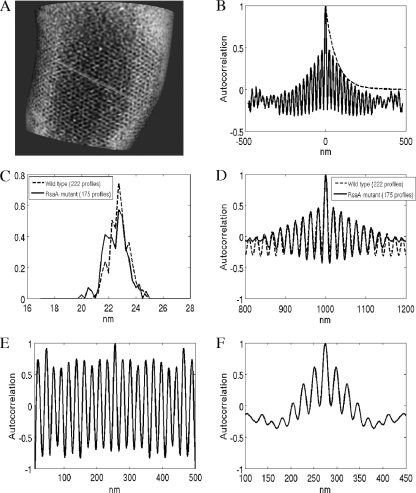
Contrary to expectations (47), closer analysis of the surface regions where the hexagonal pattern was present showed a lack of long-range order. We drew intensity profiles along the axes of the unit cell (Fig. 3 A) to measure periodicity and autocorrelation functions directly on the surface. Figure 3B shows the averaged autocorrelation for 222 intensity profiles from three different wild-type data sets with periodic peaks and an exponential decay of the envelope, which indicates short-range order. In particular, if we fit an exponential decay, e−x/τ (where x is the distance along the surface and τ is the decay constant), to the envelope of the autocorrelation function (dashed line in Fig. 3B), we obtain a τ value of 66.66 nm. Thus, on average, every three periods we find a perturbation (phase shift) in the lattice that breaks the possibility of long-range order. Figure 3C and D shows a comparison of the range order and the periodicity between wild-type cells and the RsaA-overexpressing construct (using 177 profiles from three different data sets). Results from both cases are almost indistinguishable. Also, the S-layer periodicity presents a distribution with a mean of 22.8 nm and a standard deviation of ±2 nm, which again shows a more amorphous structure than was previously observed in different isolated S-layer sheets.
FIG. 3.
(A) Example of line profiles (green line) obtained from the rendered S layer. (B) Averaged autocorrelation function across 222 profiles on wild-type cells. The autocorrelation decays exponentially (τ = 66 nm), showing short-range order. The dashed line represents the envelope with exponential decay. (C) Histogram of S-layer periodicity extracted from line profiles for the wild type (dashed line) and the RsaA-overexpressing construct (continuous line). Both present a peak at 22.8 nm and a standard deviation of ±2 nm, showing the elasticity of the S layer. (D) Comparison of averaged autocorrelation function between the wild type (dashed line) and rsaA mutant (continuous line). Both present the same short-range order. (E) Autocorrelation function for an individual profile showing long-range order. (F) Autocorrelation function for an individual profile showing very-short-range order.
Layers of S layer.
Since the global lattice arrangement between the wild type and an RsaA-overexpressing construct did not show significant differences, we focused on the organization under the outer surface to search for differences. For each tomogram, we selected hundreds of boxes containing S-layer subunits (Fig. 4) to obtain better resolution of the subunit structure using subtomogram averaging and classification techniques (5). We compared average structures from different tomograms, and all had a structure compatible with the existing 2-nm-resolution structure from in vitro studies (47). However, some of the averages presented a single S layer, while others presented two S layers (double) built one on top of the other (Fig. 5). In order to classify each individual S-layer subunit between single and double, we generated 1D profiles along the surface normal, as described in Materials and Methods (Fig. 4B and C). These profiles clearly show the inner membrane high-density dip, the outer membrane dip, and one or two dips on the S-layer location. Classifying and averaging S-layer subunits from different tomograms allowed us to obtain the two different structures shown in Fig. 5, where the single versus double S-layer feature is clearly visible.
FIG. 4.
(A) Schematic showing local coordinates for boxes on S-layer surface. Local coordinates are defined as follows: V1 is tangential to the bacterium surface and follows one of the S-layer unit cell axes, n is normal to the surface following the p6 axis, and V2 is a vector tangential to the surface resulting from the cross product of n|Ax × V1. (B and C) Single dip (B) and double dip (C). The profiles are the result of adding intensity values along V1 and V2 in a single subtomogram. In the profiles we can see the inner membrane dip at 4 nm, the OM dip at 35 nm, and the S-layer dip between 50 nm and 65 nm. These profiles help classify each subtomogram into a single or double S layer for subtomogram averaging. The zero point in panels B and C was set arbitrarily to be able to display the main three features of the C. crescentus cell wall: OM, inner membrane, and S layer.
FIG. 5.
(A) Average structure of single S layer and outer membranes using 1,688 boxes; (B) average structure of double S layer and outer membrane using 2,089 boxes combining data from the wild type and the RsaA-overexpressing construct. The structural difference between panels A and B is clear. YZ, XY, and XZ, perpendicular planes used to display the results of the 3D density maps; white bar, 20 nm; dashed lines in the YZ plane, the location of the XY plane shown in the figure.
Figure 2C shows the location of each single and double S-layer subunit in one of the C. crescentus tomograms. In this case, the missing wedge blurring effect erases the single or double S-layer feature completely in some regions (Fig. 1B). Thus, we restricted our analysis to regions of the surface in the ±60o range, since it was not possible to adapt the classification in order to extend the analysis further like we did with the pattern-matching case. Analyzing this kind of visualization for each tomogram, it was clear that the areas with single and double S layers were spatially separated and that there was more surface with a double S layer in the construct overexpressing RsaA. In particular, for the wild-type data sets, 47% of the surface covered with a hexagonal pattern contained a single S layer, while 53% contained a double layer. On the other hand, for the RsaA-overexpressing construct, 36% of the subtomograms demonstrated a single S layer, whereas 64% had a double S layer. This percent difference implies an increase of 11% in the total amount of RsaA present in the S layer of the RsaA-overexpressing construct, suggesting that the double-S-layer regions are the primary explanation for where excess RsaA monomers accumulated.
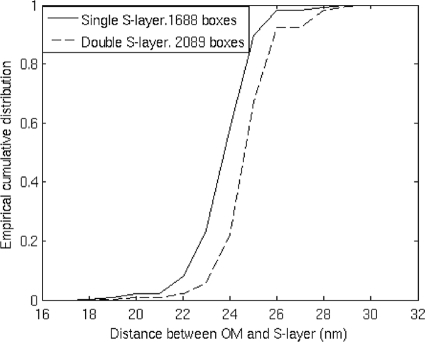
Using the 1D profiles, we can also measure the distance between the OM and the outermost S layer in each class (Fig. 6). For the double S layer, the mean relative distance between the OM and the outermost S layer was 25.3 nm and the standard deviation was 1.3 nm, while for the single S layer, the mean was 24.2 nm and the standard deviation was 1.4 nm. Moreover, the distance between the two layers of S layer, measured from the distance between dips in Fig. 4C, had a mean of 8.7 nm and a standard deviation of 1.7 nm.
FIG. 6.
Empirical cumulative distribution of the distance between outermost S layer of an OM for single (continuous line) and double (dashed line) S-layer cases measured from the 1D high-SNR profiles shown in Fig. 4. The single S layer is closer than the outermost double S layer.
Location of N and C termini by Nanogold labeling.
In order to effectively increase the resolved information content of CET images, we combined subtomogram averaging, maleimide-derivatized NG labeling, and the positioning of single cysteines at known positions in RsaA (Cys2, Cys277, Cys353, and Cys944) to obtain information about the S-layer structure. For this part of the work, the stalk regions of the stalked cells were selected for imaging because the resolution in these thinner parts of the cells was substantially higher. If the NG binds specifically to the cysteine sites in each construct, we can determine their approximate positions within the RsaA monomer. Moreover, examination of the cysteine-modified rsaA constructs showed that all were expressed and surface assembled at levels comparable to the level for the wild-type S layer, and there was no indication of higher levels of shed protein compared to the level for the wild-type S layer (Fig. 7). This result suggests that no major modification of S-layer structure occurred as a consequence of the addition of these short sequences to rsaA.
FIG. 7.
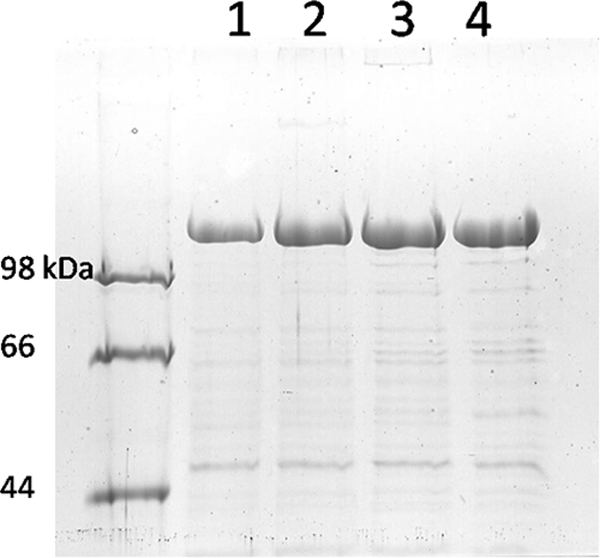
SDS-PAGE of S-layer proteins. Normalized quantities of cells were extracted by low-pH treatment, and equal volumes of S-layer protein extract were loaded for electrophoresis. Lane 1, CB15 NA1000 (wild type); lane 2, Cys2; lane 3, Cys277; lane 4, Cys944.
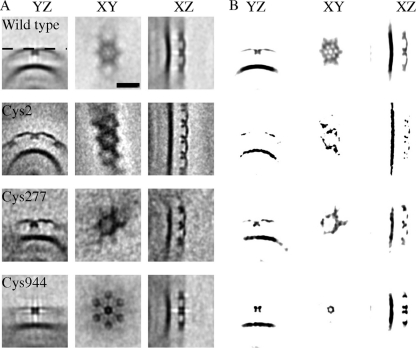
The NG label was not apparent on visual inspection of the tomograms (see Fig. S2 in the supplemental material). However, aligning and averaging multiple subunits sufficiently improved the SNR that the labels were quite evident. Figure 8 shows the results of subtomogram averaging of the different constructs, with high-density spots being seen in different locations of the S-layer structure. For each average, we show a balanced gray-scale volume and a saturated version of the same image to bring attention to the dark spots representing high-density elements. The positions of the different dark spots indicate the average binding location of the NG to the cysteine. Using the schematic in Fig. 1A as a guide, the label on the Cys944 construct indicates that the C terminus was located near the center of the hexagonal core (near the p6 symmetry axis) and the label on the Cys2 construct suggests that the N terminus was located in the links between S-layer subunits (near the p3 symmetry axis), while the label on Cys277 indicates a position intermediate between the two extremes. The dark spots in Fig. 8B for Cys277 are more similar to the Cys2 labeling than the Cys944 labeling, confirming the hypothesis of the location for the N terminus. At the same time, it also suggested that the resolution limit of the Nanogold labeling with subtomogram averaging technique might be the space occupied by 200 to 300 amino acids.
FIG. 8.
(A) Comparison between averages from different C. crescentus constructs showing localization of NG from high-magnification (×40,000) tomograms of stalks. The wild type was obtained using 879 boxes. Cys2, Cys277, and Cys944 were obtained using 450, 196, and 619 boxes, respectively. Difference maps and 6-fold symmetry cannot be computed due to changes in the high curvature between stalks of difference tomograms. (B) Same images as in panel A but with enhanced contrast to visualize high-density spots. The OM present in all the images serves as a reference to compare relative densities between averages. Cys277 concentrates the high-density spots between hexagonal cores, while Cys944 concentrates them in the hexagonal core itself. YZ, XY, and XZ, three different perpendicular planes used to visualize the 3D average; dashed line in the YZ plane of the wild-type strain in panel A, location of the XY planes shown in the figure; black bar, 20 nm.
These results support the view that the U-shaped RsaA monomer proceeds from the N terminus at one vertex to the C terminus at the opposite vertex. Similar processing of the wild-type S-layer tomograms without NG labeling demonstrated that the high-density spots do not appear. Moreover, the presence of the OM as a high-density element in all averages was useful as an internal reference to compare relative density between average structures. Even though we were able to collect a similar amount of subtomogram data for the Cys353 construct as for the other constructs, the S-layer subunits did not present enough local regularity in the hexagonal pattern to obtain a clear average structure (data not shown). Thus, it was not possible to locate clearly defined dense regions in the final reconstruction to identify the binding site of the NG.
DISCUSSION
Leveraging several image analysis techniques to process large amounts of data, including visualizing curved surfaces from 3D density data and averaging similar structures in low-SNR scenarios, to enhance information content enabled us to create high-resolution images of an S layer in close to its native state on intact cells. This analysis presents a different picture from the structural analysis performed on isolated S layers shed from the cells. In particular, the CET data sets show an S layer with limited long-range order rather than a highly crystalline lattice structure. Considering that the S-layer subunits are affected by two interactions, subunit to subunit and subunit to OM, and that isolated S layers present properties of self-assembly into 2D crystalline lattices, the anchoring of the S layer to the cell wall may be impeding this process either as a result of the dynamic growth of this layer or by generating various dislocations, disclinations, and other packing defects that allow it to follow the surface curvature. Finally, one has to keep in mind that the analysis presented here represents average statistics. For example, Fig. 3E and F shows individual profiles in a region with a nearly perfect periodic pattern and individual profiles with very-short-range orders, respectively.
Moreover, the fact that hexagonal structures were not observed in the entire surface, even though RsaA covers the entire cell surface, reinforces the idea of a dynamic process to create new S layer (40). Figure 2 shows several ridges on the S-layer surface where different growth areas may have merged. Our quantitative analysis confirmed the qualitative inference by Smit et al. (48) (Fig. 6), which presents images from the C. crescentus CB15 S layer using freeze-etching techniques and states: “In this typical view, there are indications of a periodic structure on the surface, but the impression of precise, long-range order was not seen.” While Smit et al. offered several possibilities for the unexpected lack of long-range order, such as a surface polysaccharide penetrating the S layer or technical problems with platinum shadowing, to justify why good order was not seen when it was expected, the present study with CET avoided most of the technical problems and added computational analysis that definitively explains that the lack of long-range order is a valid hypothesis. In addition, one advantage of our surface parameterization using bicubic splines in cylindrical coordinates is that we can measure in 3D distances along paths on the surface; we do not need to physically flatten the S-layer shape to perform quantitative analysis in intact cells.
We knew from previous work (27) that when RsaA was overexpressed a significant fraction of additional protein remained associated with the cell surface. It was predicted that the reason for the lack of long-range order could be due to an underpopulated array matrix, which might be improved by the overexpression and the improved quality of array formation detected by CET. However, overexpression did not result in a denser or more regular S layer. Instead, the results showed that C. crescentus accumulated extra RsaA as a second S layer. Layers of S layers, one on top of the other, have been reported (45, 50) for other S-layer-producing bacteria, though in those cases it is the result of two different S-layer proteins each forming a distinct S layer. Here we show for the first time in situ in C. crescentus that single- and double-layered regions form, even with normal RsaA expression levels. It is unlikely that this phenomenon could be detected by any method other than the CET methods described here.
Smit et al. (47) showed that the C. crescentus S layer can form a double layer when it is assembled apart from the cell, but in a particular way: the bottoms of each S layer face each other. The proof of that was the loss of handedness when the averaged image was reconstructed. In this case, handedness refers to how each RsaA monomer in the hexamer unit (Fig. 1A) is bent in one direction. If they are overlaid as a back-to-back double layer, the bend is lost during the projection process because each layer has the opposite handedness. Therefore, the fact that two layers can stack on the bacterium poses the following problem. If one argues that a surface-associated double layer is like shed S layer, then one must explain why they remain attached to the cell (when the attaching surface is inside the double layer). If one argues the opposite, one can conclude that there are apparently two stable stacking possibilities for this S layer. Unfortunately, we cannot provide a definite answer for which has occurred, because the CET subtomogram averaging was not able to resolve the handedness in our subtomograms. In order to achieve the resolution needed to visualize the links between hexagonal cores formed by RsaA monomers, we will need to average thousands of motifs imaged with low defocus in order to avoid the resolution limits imposed by the contrast transfer function. While this is, in principle, feasible, it is beyond the scope of the current work. However, our results provide guidance for further efforts aimed at resolving this question.
Aside from the classification between single and double S layers, the S-layer subunit structures found in the previous in vitro study (47) and our in situ study are comparable. Thus, we used the structure resolved to 2-nm resolution obtained by negative-stain electron tomography on isolated S-layer sheets as a reference for comparison. The previously measured periodicity between subunit cores was 22 nm. Figure 3 shows a mean of 22.8 nm, but it also displays a distribution of possible periodicities, which represents the elasticity in the S-layer links between subunits. Our observations of hydrated, native-state environments and native proteins show an average thickness of 8.7 nm, which deviates from estimates of 7 nm presented earlier (47), although the measured standard deviation of 1.7 nm makes that number feasible, given the elasticity of the S layer.
Combining NG labeling and subtomogram averaging, we were able for the first time to establish a correlation between linear protein sequence and the available structure, suggesting the approximate locations of the N and C termini in each RsaA protein forming the S layer of C. crescentus. In the absence of information linking linear protein sequence with structure, such things as estimation of where surface attachment (via the smooth LPS and the N-terminal domain) was located in the structure or where the RTX motif mediated calcium binding was located was largely speculative. Figure 9 shows an isosurface rendering of an S-layer subunit obtained from subtomogram averaging using CET of intact cells with a comparison to the previous surface rendition obtained from negative-stain images (48). Comparing the isosurface with the results shown in Fig. 8 and the schematic in Fig. 1A, we can now estimate the locations of the N and C termini in each RsaA monomer. Though far less than atomic resolution, with this new information we can begin to analyze the S-layer structure in the context of functional regions. For example, in examining Fig. 9B, knowing that the C terminus is located at the axis of 6-fold symmetry and that the RTX calcium binding domains are located adjacent to the C terminus, we can now propose that the hexagonal doughnut shape is formed by direct interaction of the RTX motifs in each monomer (via divalent calcium bridging). This may be the only region involved in the requirement of calcium for S-layer formation; the N-terminal axis of 3-fold symmetry may result from interaction with the smooth LPS.
FIG. 9.
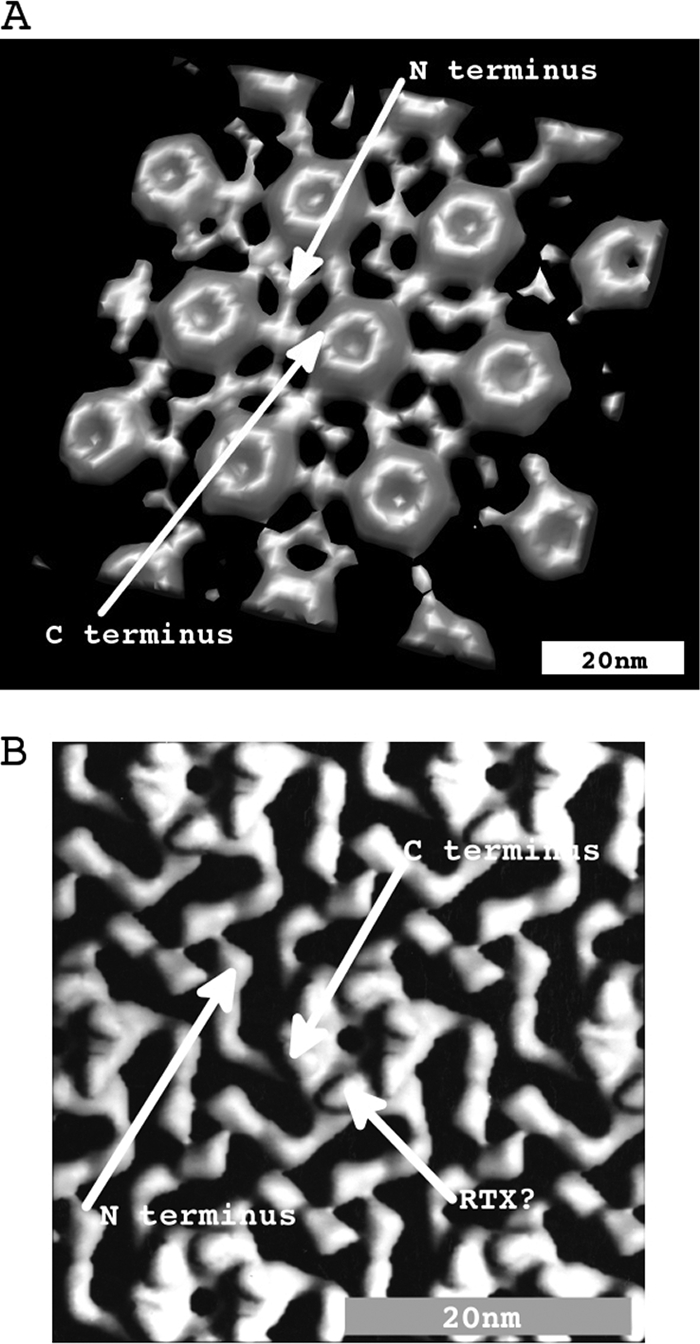
(A) Isosurface of the C. crescentus S-layer hexagon obtained with subtomogram averaging and imposing 6-fold symmetry to improve SNR. According to the results in Fig. 8, the N terminus of rsaA monomers corresponds to the 3-fold symmetry connection point between RsaA monomers and the C terminus corresponds to the points of 6-fold symmetry. (B) Isosurface of the C. crescentus S-layer hexagon obtained with subtomogram averaging of negative-stain-isolated S-layer sheets. The figure was adapted from reference 47. We use this existing structure as a reference to correlate the primary sequence to positions within the U-shaped RsaA monomers. The structures in panels A and B are compatible with each other.
This structural orientation is also useful for design of S layers with heterologous insertions, since the region around each terminus shows different local symmetry (p3 or p6); by insertion of segments at different positions along the length of the gene, we will be able to better estimate the average distance between copies of the heterologous insertions.
Presumably, the methodology shown in this paper to determine gene position relative to structure position in different lattice arrangements could be applied to S layers from other bacteria and archaea, particularly since many S-layer proteins are devoid of cysteine residues (45). However, as pointed out in the introduction, one of the main limiting factors in CET imaging is the sample thickness. The user has to choose an appropriate target organism. In our case, the fact that C. crescentus elaborates a stalk of about 0.2 μm diameter during certain stages of the cell cycle was crucial to obtain higher-resolution images in order to visualize Nanogold labeling. If one attempts to image whole cells of C. crescentus at ×40,000 magnification, the cell diameter alone would introduce a significant defocus error that limits the final achievable resolution. Moreover, the electron dose limit required to avoid structural damage will also reduce the achievable SNR at such magnifications.
Supplementary Material
Acknowledgments
This work was supported by grants from the U.S. Department of Energy Office of Basic Research Grants under contract number DE-AC02-05CH11231 to Harley McAdams and K.H.D. and from the Natural Sciences and Engineering Research Council of Canada to J.S.
We thank Lucy Shapiro and Harley McAdams of Stanford for their support. F.A. thanks Cristina Siegerist for guidance with the Paraview software.
Footnotes
Published ahead of print on 10 September 2010.
Supplemental material for this article may be found at http://jb.asm.org/.
REFERENCES
- 1.Amat, F., L. R. Comolli, F. Moussavi, J. Smit, K. H. Downing, and M. Horowitz. 2010. Subtomogram alignment by adaptive Fourier coefficient thresholding. J. Struct. Biol. 171:332-344. [DOI] [PMC free article] [PubMed] [Google Scholar]
- 2.Amat, F., F. Moussavi, L. R. Comolli, G. Elidan, K. H. Downing, and M. Horowitz. 2008. Markov random field based automatic image alignment for electron tomography. J. Struct. Biol. 161:260-275. [DOI] [PubMed] [Google Scholar]
- 3.Awram, P., and J. Smit. 2001. Identification of lipopolysaccharide O antigen synthesis genes required for attachment of the S-layer of Caulobacter crescentus. Microbiology 147:1451-1460. [DOI] [PubMed] [Google Scholar]
- 4.Awram, P., and J. Smit. 1998. The Caulobacter crescentus paracrystalline S-layer protein is secreted by an ABC transporter (type I) secretion apparatus. J. Bacteriol. 180:3062-3069. [DOI] [PMC free article] [PubMed] [Google Scholar]
- 5.Bartesaghi, A., and S. Subramaniam. 2009. Membrane protein structure determination using cryo-electron tomography and 3D image averaging. Curr. Opin. Struct. Biol. 19:402-407. [DOI] [PMC free article] [PubMed] [Google Scholar]
- 6.Beveridge, T. J. 1979. Surface arrays on the wall of Sporosarcina ureae. J. Bacteriol. 139:1039-1048. [DOI] [PMC free article] [PubMed] [Google Scholar]
- 7.Beveridge, T. J., and L. L. Graham. 1991. Surface layers of bacteria. Microbiol. Mol. Biol. Rev. 55:684-705. [DOI] [PMC free article] [PubMed] [Google Scholar]
- 8.Beveridge, T. J., P. H. Pouwels, M. Sára, A. Kotiranta, K. Lounatmaa, K. Kari, E. Kerosuo, M. Haapasalo, E. M. Egelseer, I. Schocher, U. B. Sleytr, L. Morelli, M. Callegari, J. F. Nomellini, W. H. Bingle, J. Smit, E. Leibovitz, M. Lemaire, I. Miras, S. Salamitou, P. Béguin, H. Ohayon, P. Gounon, M. Matuschek, K. Sahm, H. Bahl, R. Grogono-Thomas, J. Dworkin, M. J. Blaser, R. M. Woodland, D. G. Newell, M. Kessel, and S. F. Koval. 1997. Functions of S-layers. FEMS Microbiol. Rev. 20:99-149. [DOI] [PubMed] [Google Scholar]
- 9.Bhatnagar, P. K., A. Awasthi, J. F. Nomellini, J. Smit, and M. R. Suresh. 2006. Anti-tumor effects of the bacterium Caulobacter crescentus in murine tumor models. Cancer Biol. Ther. 5:485-491. [DOI] [PubMed] [Google Scholar]
- 10.Bingle, W. H., J. F. Nomellini, and J. Smit. 1997. Cell-surface display of a Pseudomonas aeruginosa strain K pilin peptide within the paracrystalline S-layer of Caulobacter crescentus. Mol. Microbiol. 26:277-288. [DOI] [PubMed] [Google Scholar]
- 11.Bingle, W. H., J. F. Nomellini, and J. Smit. 2000. Secretion of the Caulobacter crescentus S-layer protein: further localization of the C-terminal secretion signal and its use for secretion of recombinant proteins. J. Bacteriol. 182:3298-3301. [DOI] [PMC free article] [PubMed] [Google Scholar]
- 12.Bingle, W., J. Nomellini, and J. Smit. 1997. Linker mutagenesis of the Caulobacter crescentus S-layer protein: toward a definition of an N-terminal anchoring region and a C-terminal secretion signal and the potential for heterologous protein secretion. J. Bacteriol. 179:601-611. [DOI] [PMC free article] [PubMed] [Google Scholar]
- 13.Reference deleted.
- 14.Claus, H., E. Akça, T. Debaerdemaeker, C. Evrard, J. Declercq, J. R. Harris, B. Schlott, and H. König. 2005. Molecular organization of selected prokaryotic S-layer proteins. Can. J. Microbiol. 51:731-743. [DOI] [PubMed] [Google Scholar]
- 15.Downing, K. H., and P. E. Mooney. 2008. A charge coupled device camera with electron decelerator for intermediate voltage electron microscopy. Rev. Sci. Instrum. 79:043702. [DOI] [PMC free article] [PubMed] [Google Scholar]
- 16.Reference deleted.
- 17.Engelhardt, H. 2007. Are S-layers exoskeletons? The basic function of protein surface layers revisited. J. Struct. Biol. 160:115-124. [DOI] [PubMed] [Google Scholar]
- 18.Ford, M. J., J. F. Nomellini, and J. Smit. 2007. S-layer anchoring and localization of an S-layer-associated protease in Caulobacter crescentus. J. Bacteriol. 189:2226-2237. [DOI] [PMC free article] [PubMed] [Google Scholar]
- 19.Förster, F., O. Medalia, N. Zauberman, W. Baumeister, and D. Fass. 2005. Retrovirus envelope protein complex structure in situ studied by cryo-electron tomography. Proc. Natl. Acad. Sci. U. S. A. 102:4729-4734. [DOI] [PMC free article] [PubMed] [Google Scholar]
- 20.Gilchrist, A., and J. Smit. 1991. Transformation of freshwater and marine caulobacters by electroporation. J. Bacteriol. 173:921-925. [DOI] [PMC free article] [PubMed] [Google Scholar]
- 21.Gould, S., F. Amat, and D. Koller. 2009. Alphabet SOUP: a framework for approximate energy minimization, p. 903-910. Proc. Conf. Comput. Vision Pattern Recog.
- 22.Reference deleted.
- 23.Henderson, A. 2004. The paraview guide: a parallel visualization application. Kitware Inc., Clifton Park, NY.
- 24.Reference deleted.
- 25.Reference deleted.
- 26.Kremer, J. R., D. N. Mastronarde, and J. R. McIntosh. 1996. Computer visualization of three-dimensional image data using IMOD. J. Struct. Biol. 116:71-76. [DOI] [PubMed] [Google Scholar]
- 27.Lau, J. H. Y., J. F. Nomellini, and J. Smit. 2010. Analysis of high-level S-layer protein secretion in Caulobacter crescentus. Can. J. Microbiol. 56:501-514. [DOI] [PubMed] [Google Scholar]
- 28.Li, Z., and G. J. Jensen. 2009. Electron cryotomography: a new view into microbial ultrastructure. Curr. Opin. Microbiol. 12:333-340. [DOI] [PMC free article] [PubMed] [Google Scholar]
- 29.Liu, J., T. Lin, D. J. Botkin, E. McCrum, H. Winkler, and S. J. Norris. 2009. Intact flagellar motor of Borrelia burgdorferi revealed by cryo-electron tomography: evidence for stator ring curvature and rotor/C-ring assembly flexion. J. Bacteriol. 191:5026-5036. [DOI] [PMC free article] [PubMed] [Google Scholar]
- 30.Lucic, V., F. Forster, and W. Baumeister. 2005. Structural studies by electron tomography: from cells to molecules. Annu. Rev. Biochem. 74:833-865. [DOI] [PubMed] [Google Scholar]
- 31.Mastronarde, D. N. 2005. Automated electron microscope tomography using robust prediction of specimen movements. J. Struct. Biol. 152:36-51. [DOI] [PubMed] [Google Scholar]
- 32.Mastronarde, D. N. 1997. Dual-axis tomography: an approach with alignment methods that preserve resolution. J. Struct. Biol. 120:343-352. [DOI] [PubMed] [Google Scholar]
- 33.Meyling, R. H. J. G., and P. R. Pfluger. 1987. B-spline approximation of a closed surface. IMA J. Numer. Anal. 7:73-96. [Google Scholar]
- 34.Moussavi, F., G. Heitz, F. Amat, L. R. Comolli, D. Koller, and M. Horowitz. 2010. 3D segmentation of cell boundaries from whole cell cryogenic electron tomography volumes. J. Struct. Biol. 170:134-145. [DOI] [PubMed] [Google Scholar]
- 35.Nomellini, J., S. Kupcu, U. Sleytr, and J. Smit. 1997. Factors controlling in vitro recrystallization of the Caulobacter crescentus paracrystalline S-layer. J. Bacteriol. 179:6349-6354. [DOI] [PMC free article] [PubMed] [Google Scholar]
- 36.Nomellini, J. F., G. Duncan, I. R. Dorocicz, and J. Smit. 2007. S-layer-mediated display of the immunoglobulin G-binding domain of streptococcal protein G on the surface of Caulobacter crescentus: development of an immunoactive reagent. Appl. Environ. Microbiol. 73:3245-3253. [DOI] [PMC free article] [PubMed] [Google Scholar]
- 37.Nomellini, J. F., C. Li, D. Lavallee, I. Shanina, L. A. Cavacini, M. S. Horwitz, and J. Smit. 2010. Development of an HIV-1 specific microbicide using Caulobacter crescentus S-layer mediated display of CD4 and MIP1α. PLoS One 5:e10366. [DOI] [PMC free article] [PubMed] [Google Scholar]
- 38.Norville, J. E., D. F. Kelly, T. F. Knight, Jr., A. M. Belcher, and T. Walz. 2007. 7 Å projection map of the S-layer protein sbpA obtained with trehalose-embedded monolayer crystals. J. Struct. Biol. 160:313-323. [DOI] [PMC free article] [PubMed] [Google Scholar]
- 39.Pavkov, T., E. M. Egelseer, M. Tesarz, D. I. Svergun, U. B. Sleytr, and W. Keller. 2008. The structure and binding behavior of the bacterial cell surface layer protein SbsC. Structure 16:1226-1237. [DOI] [PubMed] [Google Scholar]
- 40.Pum, D., P. Messner, and U. B. Sleytr. 1991. Role of the S-layer in morphogenesis and cell division of the archaebacterium Methanocorpusculum sinense. J. Bacteriol. 173:6865-6873. [DOI] [PMC free article] [PubMed] [Google Scholar]
- 41.Schäfer, A., A. Tauch, W. Jäger, J. Kalinowski, G. Thierbach, and A. Pühler. 1994. Small mobilizable multi-purpose cloning vectors derived from the Escherichia coli plasmids pK18 and pK19: selection of defined deletions in the chromosome of Corynebacterium glutamicum. Gene 145:69-73. [DOI] [PubMed] [Google Scholar]
- 42.Schroeder, W., K. Martin, and B. Lorensen. 1997. The visualization toolkit: an object-oriented approach to 3-D graphics, 2nd ed. Prentice-Hall, Englewood Cliffs, NJ.
- 43.Seltmann, G. 2010. The bacterial cell wall. Springer, Berlin, Germany.
- 44.Sleytr, U. B. 1978. Regular arrays of macromolecules on bacterial cell walls: structure, chemistry, assembly, and function. Int. Rev. Cytol. 53:1-62. [DOI] [PubMed] [Google Scholar]
- 45.Sleytr, U. B., and P. Messner. 1983. Crystalline surface layers on bacteria. Annu. Rev. Microbiol. 37:311-339. [DOI] [PubMed] [Google Scholar]
- 46.Sleytr, U. B., C. Huber, N. Ilk, D. Pum, B. Schuster, and E. M. Egelseer. 2007. S-layers as a tool kit for nanobiotechnological applications. FEMS Microbiol. Lett. 267:131-144. [DOI] [PubMed] [Google Scholar]
- 47.Smit, J., H. Engelhardt, S. Volker, S. H. Smith, and W. Baumeister. 1992. The S-layer of Caulobacter crescentus: three-dimensional image reconstruction and structure analysis by electron microscopy. J. Bacteriol. 174:6527-6538. [DOI] [PMC free article] [PubMed] [Google Scholar]
- 48.Smit, J., D. A. Grano, R. M. Glaeser, and N. Agabian. 1981. Periodic surface array in Caulobacter crescentus: fine structure and chemical analysis. J. Bacteriol. 146:1135-1150. [DOI] [PMC free article] [PubMed] [Google Scholar]
- 49.Smit, J., and N. Agabian. 1982. Cell surface patterning and morphogenesis: biogenesis of a periodic surface array during Caulobacter development. J. Cell Biol. 95:41-49. [DOI] [PMC free article] [PubMed] [Google Scholar]
- 50.Smith, S. H., and R. G. E. Murray. 1990. The structure and associations of the double S-layer on the cell wall of Aquaspirillum sinuosum. Can. J. Microbiol. 36:327-335. [DOI] [PubMed] [Google Scholar]
- 51.Reference deleted.
- 52.Walker, S. G., D. N. Karunaratne, N. Ravenscroft, and J. Smit. 1994. Characterization of mutants of Caulobacter crescentus defective in surface attachment of the paracrystalline surface layer. J. Bacteriol. 176:6312-6323. [DOI] [PMC free article] [PubMed] [Google Scholar]
- 53.Walker, S. G., S. H. Smith, and J. Smit. 1992. Isolation and comparison of the paracrystalline surface layer proteins of freshwater caulobacters. J. Bacteriol. 174:1783-1792. [DOI] [PMC free article] [PubMed] [Google Scholar]
Associated Data
This section collects any data citations, data availability statements, or supplementary materials included in this article.


