

Abstract
Purinergic nucleotides, including ATP and adenosine, are important neuromodulators of peripheral auditory and visual sensory systems (Thorne and Housley, 1996). ATP released by the olfactory epithelium (OE) after noxious stimuli provides a physiological source for a neuromodulatory substance independent of efferent innervation. Here we show that multiple subtypes of purinergic receptors are differentially expressed in olfactory receptor neurons and sustentacular support cells. Activation of purinergic receptors evoked inward currents and increases in intracellular calcium in cultured mouse olfactory receptor neurons. A mouse olfactory epithelial slice preparation and confocal imaging were used to measure changes in intracellular calcium in response to odors, purinergic receptor (P2R) agonists, or combined odor + P2R agonists. Pharmacological studies show that both P2Y and P2X receptor activation by exogenous and endogenous ATP significantly reduces odor responsiveness. Moreover, purinergic receptor antagonists increase the odor-evoked calcium transient, providing direct evidence that endogenous ATP modulates odor sensitivity via activation of multiple purinergic receptor subtypes in olfactory receptor neurons. Odor activation of G-protein-coupled receptors results in increased cAMP production, opening of cyclic nucleotide-gated channels, influx of Ca2+ and Na+, depolarization of the membrane, and activation of voltage- and Ca2+-gated ion channels. On-cell current-clamp recordings of olfactory receptor neurons from neonatal mouse slices revealed that ATP reduced cyclic nucleotide-induced electrical responses. These data also support the idea that ATP modulates odor sensitivity in mammalian olfactory neurons. Peripheral ATP-mediated odor suppression is a novel mechanism for reduced olfactory sensitivity during exposure to olfactotoxins and may be a novel neuroprotective mechanism.
Keywords: olfactory receptor neuron, sustentacular cell, ATP, olfactory system, modulation, purinergic receptor
Introduction
Extracellular ATP plays an important role in cellular signaling and acts as a cotransmitter or neuromodulator in sensory systems (Thorne and Housley, 1996). Physiological and pathological sources of extracellular ATP have been clearly elucidated (Neary et al., 1996; Ralevic and Burnstock, 1998; Burnstock, 1997; Bodin and Burnstock, 2001). In the olfactory system, ATP may be released from synaptic vesicles in trigeminal afferents that innervate the olfactory epithelium (OE) and detect noxious chemicals (Finger et al., 1990; Getchell and Getchell, 1992) or via plasma membrane nucleotide transport proteins (Roman et al., 1997). Furthermore, ischemic, stressed, and injured cells release ATP in large amounts. A recent study showed that [ATP]i significantly decreased when the OE was damaged by noxious fumes, presumably through release by injured cells (Kilgour et al., 2000). In addition to toxic chemicals, prolonged exposure to concentrated odors will damage olfactory receptor neurons (ORNs) and induce expression of stress indicators (heat-shock proteins) in sustentacular support cells (Carr et al., 2001). Therefore, both toxic and odorous stimulation may lead to the release of extracellular ATP in OE.
Very low concentrations of ATP activate the two subtypes (P2X and P2Y) of purinergic receptors (0.1-10 μm) (Ralevic and Burnstock, 1998; Schwiebert and Kishore, 2001). Through either of these receptor subtypes, ATP is able to stimulate an increase in [Ca2+]i (Ralevic and Burnstock, 1998; Illes et al., 2000; Koshimizu et al., 2000). P2X receptors form Ca2+-permeable nonselective cation channels. Most of the eight functional P2Y receptors identified to date act via G-protein coupling to activate phospholipase C, leading to production of inositol triphosphates (IP3) and mobilization of Ca2+ from internal stores (Dubyak and el-Moatassim, 1993); however, a few P2Y receptors couple to adenylate cyclase and increase the production of cAMP (Ralevic and Burnstock, 1998). All of the components of both the IP3 and cAMP transduction pathways have been identified in ORNs (Schild and Restrepo, 1998).
ORNs respond to odorants with G-protein-mediated increases in intracellular cAMP and/or IP3, which activate calcium-permeable conductances and increase [Ca2+]i. Calcium plays an important role as a third messenger in olfactory transduction: Ca2+ can either potentiate or attenuate the signal. Clearly, action of bioactive compounds, such as ATP, that affect calcium homeostasis in ORNs could modulate odor sensitivity.
Although purines are odorants for aquatic vertebrates (Kang and Caprio, 1995) and invertebrates (Carr et al., 1987), this is the first comprehensive study of extracellular purinergic nucleotides and their receptors in mammalian OE. Here we report that sustentacular support cells express P2Y receptors and that ORNs express both P2X and P2Y receptors. Differential distribution of purinergic receptors suggests that extracellular ATP may have multiple roles in the peripheral olfactory system. Furthermore, we show that exogenous and endogenous ATP modulates the odor responsiveness of ORNs. The predominantly suppressive effect of ATP on odor responses could play a role in the reduced odor sensitivity that occurs during acute exposure to noxious fumes and may be a novel neuroprotective mechanism.
Materials and Methods
Materials. All chemicals were obtained from Sigma (St. Louis, MO), unless otherwise indicated.
Animals. All animal procedures were approved by the University of Utah Institutional Animal Care and Use Committee, and all applicable guidelines from the National Institutes of Health Guide for Care and Use of Laboratory Animals were followed. We initiated this study using adult male Simonsen (Gilroy, CA) albino rats (∼200 gm) and performed both calcium imaging of primary cultures and reverse transcription (RT)-PCR of isolated OE and bulbs. However, after these preliminary experiments, we switched to the Swiss Webster mouse (Simonsen, Gilroy, CA) because gene targeting and transgenic technology is a powerful research tool and the mouse is the species in which this technology is by far the most developed.
RT-PCR. Total RNA was isolated from adult rat OE using Trizol (Invitrogen, Carlsbad, CA). Polyadenylated mRNA was selected using a cellulose oligo(dT) matrix (QuickPrep Micro mRNA purification kit; Amersham Biosciences, Arlington Heights, IL). First-strand cDNA was prepared from 40 ng of mRNA using SuperScript II RNase H- RT according to the manufacturer's (Invitrogen) procedures. A control reaction omitting the reverse transcriptase was included to confirm the absence of genomic contamination. First-strand cDNA was amplified using PlatinumTaqDNA polymerase (Invitrogen). Primers for detection of P2X2 transcripts were 756-775 sense and 1537-1558 antisense oligonucleotides (GenBank accession no. U14414) (Brake et al., 1994), primers for P2Y2 transcripts were 1288-1307 sense and 1931-1950 antisense oligonucleotides (GenBank accession no. U09402), primers for β-actin transcripts (Lopez-Candales et al., 1995) were 1038-1067 sense and 1875-1905 antisense oligonucleotides and primers for neuron specific enolase were 348-368 sense and 1101-1123 antisense oligonucleotides (GenBank accession no. M11931). All the primer pairs (100 μm) were used with a 30-cycle profile performed as follows: 94°C denaturation (2 min), 96°C denaturation (45 sec), 60°C annealing (1 min), and 72°C extension (1.5 min). PCR products were separated and visualized using ethidium bromide-stained agarose gels (1%). A semi-nested PCR protocol was used for detection of the P2X2 receptor transcript. PCR products were excised from the gel and reamplified for 28 cycles using the same antisense primer and a sense primer corresponding to position 1059-1078. PCR products were sequenced at the University of Utah Sequencing Center.
Immunohistochemistry. OE from postnatal day 4 (P4) mice was dissected and postfixed for 2 hr and then cryoprotected, oriented in Tissue Tek OCT compound (Sakura Finetek, Torrence, CA) and quickly frozen. Cryostat sections (14 μm) were permeabilized with 0.3% Triton X-100 in PBS, blocked with 10% normal donkey serum. Double-labeling was performed by simultaneously incubating slices in goat anti-olfactory marker protein (OMP) (1:10K; gift from F. Margolis, University of Maryland, Balitmore, MD) and either rabbit anti-P2X1, P2X2, P2X4, P2Y2 (all 1:100; Alomone Labs, Jerusalem, Israel), or P2X2 (3 mg/ml; Oncogene Research Products, Boston, MA) overnight followed by a 30 min incubation in tetramethylrhodamine isothiocyanate (TRITC)-conjugated donkey anti-goat immunoglobulin secondary antibody plus FITC-conjugated donkey anti-rabbit immunoglobulin secondary antibody (1:100) (both from Jackson ImmunoResearch, West Grove, PA). Sections were mounted in Vectashield (Vector Laboratories, Burlingame, CA) mounting media and visualized on a Zeiss (Thornwood, NY) confocal laser scanning microscope LSM510 argon-krypton laser scanner attached to an upright Zeiss Axioskop 2FS microscope. FITC dye was excited at 488 nm and filtered at 505 nm, and TRITC dye was excited at 568 nm and filtered at 585 nm. Sequential scans with separate excitation and collection were performed to minimize bleedthrough. For preabsorption controls, P2 antibodies were incubated with a saturating amount of peptide immunogen (10×) for 1-2 hr and visualized as above.
OE slices and primary cultures. To prepare OE slices, neonatal mice (P0-P6) were quickly decapitated, and the skin and lower jaw were removed. Tissue was mounted in ice-cold Ringer's solution containing the following (in mm: 140 NaCl, 5 KCl, 1 MgCl2, 2 CaCl2, 10 HEPES, and 10 glucose, pH 7.4, 330 mOsm) onto a vibratome cutting block, and 300 μm coronal slices were made. Primary cultures of mouse ORNs were made using the same protocol and culture conditions as described for rat olfactory receptor neurons (Vargas and Lucero, 1999a). Briefly, tissue was placed in divalent cation-free Ringer's solution containing 10 mg/ml bovine serum albumin, 1 mg/ml deoxyribonucleaseII and 44 U/ml dispase, incubated at 37°C for 45 min. The tissue was washed, triturated, and filtered through a 53 μm mesh, and 200 ml of cell suspension was plated onto concanavalin A-coated coverslips and allowed to settle for 20 min. An additional 1.5 ml of culture medium was added (DMEM supplemented with 100 mm ascorbic acid, 1× insulin-transferrin-selenium X (Invitrogen), 2 mm glutamine, 100 U/ml penicillin G, and 100 mg/ml streptomycin.
Nystatin perforated-patch voltage-clamp recordings. We used the nystatin perforated-patch technique (Horn and Marty, 1988) to examine cells under voltage clamp. Electrodes (2-5 MΩ) were pulled from thick-walled (0.64 mm) borosilicate filament glass (Sutter Instruments, Novato, CA) on a Flaming/Brown (Sutter Instruments) P87 puller and were filled with trimethylamine N-oxide (TMA-oxide) internal solution containing the following (in mm): 62.5 TMA oxide, 62.5 KH2PO4, 15 KCl, 5 MgCl2, 11 EGTA, 10 HEPES, 1 glutathione, and 5 TEA and 0.03% pluronic acid F-127, 0.3% DMSO, 150 mg/ml nystatin, pH 7.2, 330 mOsm. All internal solutions were kept on ice throughout the experiments. Fresh nystatin internal solution was made every 2 hr; nystatin stock was remade every 5 hr. Gentle suction was applied to form a gigaohm seal. Recordings were made ∼5-20 min after seal formation. External bath solution was superfused through the recording chamber at a rate of 1-2 ml/min. Test solutions were delivered with an SF-77 rapid solution changer (Warner Instruments, Hamden, CT). The application of test solutions was calibrated with an open pipette. There was a delay of ∼90 msec between the beginning of the electronic stimulus and the current recorded by the open pipette. We did not correct the data for this delay. Data was acquired with an Axopatch 200B amplifier, a Digidata 1320A interface (Axon Instruments, Foster City, CA) and a Gateway (Poway, CA) personal computer. Data were filtered at 5 kHz, digitized, and sampled at 50 kHz using pClamp 8 software. The bath solution was grounded with a 3 m KCl agar bridge to a silver chloride wire.
Electro-olfactogram and on-cell recordings. Slices of P0-P6 mouse OE were prepared as described above and mounted in a perfusion chamber with a bath flow of 3 ml/min. Test chemicals were introduced using a rotary injection valve (Rheodyne, Cotati, CA). The electro-olfactogram (EOG) recording electrode (3 m NaCl in 1% agar; tip diameter, 5-10 μm) was positioned along the dorsal portion of the nasal septum. The differential electrode (identical to the recording electrode) was positioned over skull cartilage and an Ag2+/AgCl2 ground electrode was connected to the bath solution via a 3 m KCl agar bridge. Responses to test agents were amplified (5000 × gain) and filtered (2 kHz) by a low-noise differential DC amplifier. Data was digitized (100 Hz) using Axoscope 8.0 software (Axon Instruments).
For the noninvasive on-cell recordings (Chiu et al., 1997), the same electronics were used as described for nystatin-patch experiments. The recording electrode (5-8 MΩ resistance) contained Ringer's solution. Test solutions were selected using a rotary valve and delivered for 30 sec using gravity flow. The time course of solution delivery was determined by placing an electrode in a slice and switching from Ringer's solution to distilled water. There was a 3 sec delay to initial electrical response, which peaked at 10 sec. The shaded region in Figure 8 shows the 30 sec window of when the valve was switched on and off. During a recording, the electrode was lowered into the dorsal septal region of the slice and a seal (0.5-1 GΩ) was made in voltage-clamp before switching to current-clamp with zero applied current. Only cells with a stable baseline were used. There was a 7 min wash between each test application. Experiments were conducted on 65 cells in 42 slices obtained from 14 P0-P6 mice from three litters. Only three cells survived long enough to complete the recovery portion of the >27 min protocol.
Figure 8.

ATP suppresses cyclic nucleotide-evoked membrane responses in OE slices. A, Representative EOG responses from OE slices attributable to Ringer's solution, odor, and a cyclic nucleotide mixture (100 μm IBMX, 50 μm CPT-cAMP, and 50 μm 8-Br-cGMP). Filled triangles correspond to the time of loop injection of the test solutions. B, Representative on-cell current-clamp recording from an ORN in an OE slice. Various test solutions were superfused onto the slice for 30 sec, indicated by the shaded region. The cell was allowed to recover for 7 min after each test application. Note that the coapplication of ATP (10 μm) and the mixture suppressed the evoked membrane potential changes. C, The electrical activity from each ORN was integrated from baseline, normalized to the initial cyclic nucleotide mixture response, and averaged (means + SEM). *p < 0.05, Newman-Keuls post hoc test. n = 3 ORNs from three slices, also indicated in each column.
Confocal calcium imaging. [Ca2+]i was determined using confocal imaging of fluo-4-AM-loaded cells and slices. Slices were loaded with 18 μm fluo-4 AM (Molecular Probes, Eugene, OR) for 90 min at 25°C. A stock solution of fluo-4 AM was prepared in DMSO containing 20% pluronic F-127. Ringer's solution was added to this stock solution for a final concentration of 18 μm fluo-4 AM, 0.04% pluronic F-127, and 0.4% DMSO. Cells or slices were placed in a laminar flow chamber (Warner Instruments) and perfused continuously with Ringer's solution at a flow rate of 15-20 ml/min; 500 μm probenicid and 400 nm tetrodotoxin were added to the Ringer's solution. Ca2+-free Ringer's was the same as Ringer's, with the omission of 2 mm CaCl2 and the addition of 4 mm EGTA.
A Zeiss LSM510 confocal laser scanning system was used for data collection and analysis. The system consists of a krypton-argon ion laser used for fluorescence excitation. The total laser power was 25 mW. To reduce dye bleaching and to protect slices from possible photo damage, the excitation wavelength transmission was <5% of the total power. Fluorescence emissions were long-pass-filtered at 510 nm. The laser intensity and scale was adjusted so that basal fluorescence intensity in arbitrary units was 35-50 on a scale with a maximum of 255 to avoid saturation during responses. Using this experimental paradigm, cells that were odor- or purinergic-responsive had very low fluorescence intensities and, hence, low levels of basal calcium. Moreover, cells that had elevated levels of basal fluorescence were not included in the data set, because elevated calcium could indicate that the cells were injured, dead, or dying.
Test solutions were applied using bath exchange and a small volume loop injector (200 μl). Our perfusion system exchanges the bath in ∼7-10 sec, and traces were not corrected for this delay. An odor mixture of 10 μm r-carvone and 10 μm amyl acetate was made fresh daily and is referred to as “odor” throughout. Purinergic solutions were made fresh daily from frozen stock solutions. Recordings were made at distances between 50 and 100 μm below the surface of the slice to avoid damaged cells. The concentrations of odors and purinergic agonists that actually reach the cells at the recording depth in the slice are unknown. However, when fluorescein was loop-injected under the same conditions as drugs or odors, there was a 90% reduction in fluorescence intensity at the recording depth compared with bath, suggesting that the concentration of applied drugs that reaches the level of recording is similarly reduced. Time-series experiments were performed collecting 1400 × 700 pixel images at 0.2-0.4 Hz. Test solutions were superfused 10 sec after the start of image acquisition. Images were collected for 70-120 sec, during which time most calcium levels return to baseline. Test solutions were superfused every 5-7 min, which was sufficient to allow full recovery back to basal calcium levels. Peak amplitudes of either odor-evoked or purinergic-evoked calcium transients do not differ significantly when individually applied every 5-20 min, suggesting that odor adaptation is not occurring and that purinergic receptors are not inactivated or desensitized.
Imaging data analysis. Fluo-4 AM is not a ratiometric indicator; thus, changes in [Ca2+]i levels could not be expressed as changes in absolute Ca2+ concentrations. Instead, the relative fluorescence change, ΔF/F, was determined as (F - F0)/F0, where F0 is calculated from the linear rate of decay during the 15 sec before each odor or purinergic application (F0 = mX + b). Thus, the baseline was zeroed before each calcium response.
We considered increases in fluorescence >10% above baseline fluctuations to be responses. We made a concerted effort to optimize conditions so that both odor and purinergics evoked Ca2+ transient amplitudes with equal peak amplitudes. However, regardless of the concentration of odor (500 nm to 10 μm) or purinergic agonist (10-200 μm) used, or the order of application, for the majority of cells the purinergic-agonist-evoked Ca2+ transient was smaller than the odor-evoked response (39 of 55 cells; 76 ± 10% of normalized odor-evoked transient). Therefore, for the majority of experiments, we used 10 μm concentrations of both odor and P2 agonists, unless otherwise noted. Ten micromolar odor falls in the linear range of the dose-response relationship measured for our slice preparation (see Fig. 5C). The decay phase of the calcium transient was variable; thus, we also integrated the calcium transients to obtain the amount of mobilized calcium. Within a given cell, the integrated results were similar to peak amplitude measurements. Therefore, only peak amplitudes are reported.
Figure 5.

ATP suppresses odor responses. A, Reduction of [Ca2+]i caused by the coapplication of ATP and odors compared with the summed response of ATP and odor. Shown are responses to 10 μm ATP, odor, coapplication of odor + ATP from a mouse ORN in a fluo-4-AM-loaded OE slice. Breaks in traces correspond to 5 min when images were not collected. B, Responses to individual application of ATP and odor were normalized to the sum of each response and averaged (stacked columns). The responses to the coapplication of ATP and odor were normalized to the summed individual responses and averaged (black columns). The recoveries, obtained after coapplication, were also normalized to the initial summed response. Bar graphs depict normalized peak Ca2+ transient amplitudes (means + SEM). n = 26 ORNs; *p = 0.001. C, Dose-response relationship for odor-evoked calcium transients measured in fluo-4-AM-loaded OE slices. Three concentrations of odor were superfused, in varying order, onto slices, and peak amplitudes were measured. Shown is the mean ± SEM; n is indicated next to each data point. Curve was fit by a Boltzmann function using Origin 6.0 software (Microcal Software, Northampton, MA). Note that data from B have been correlated to the odor dose-response relationship and plotted onto the dose-response relationship, slightly offset for clarity. For instance, because 10 μm odor is 0.35 U on the normalized odor dose-response relationship, the 10 μm odor from B is scaled to 0.35. The ATP response and the observed and predicted coapplication responses were also scaled appropriately.
All modulation experiments were performed by sequentially obtaining (1) initial control purinergic-evoked and/or odor-evoked calcium transients, (2) calcium transients evoked by coapplication of odors and purinergic agonists or antagonists, and (3) recovery purinergic-evoked and/or odor-evoked calcium transients. Furthermore, to be included in our data set, the peak amplitude of the recovery Ca2+ transient had to be at least 80% of the initial transient amplitude. All data were normalized to the initial odor-evoked Ca2+ transient. To determine if there were treatment effects, we performed a linear regression on the peak amplitude of the control and recovery odor responses, and if applicable, a second linear regression on the control and recovery purinergic responses for every ORN. Using the linear regressions, predicted peak amplitudes for a second odor and/or purinergic agonist response were calculated and summed to obtain the predicted coapplication peak amplitude. Paired Student's t tests were used to determine significance (p < 0.05) between the predicted peak amplitude and the observed peak amplitude, and independent Student's t tests were used to compare mean peak amplitudes across groups.
Results
Localization of purinergic receptors in the peripheral olfactory system
Using RT-PCR and immunohistochemical methods, we found ionotropic P2X2 and G-protein-coupled P2Y2 receptor expression in both OE and olfactory bulb. RT-PCR analysis revealed mRNA expression for the P2Y2 receptor and two isoforms of the P2X2 receptor; P2X2-1 (Brake et al., 1994) and P2X2-2 (Brandle et al., 1997) (Fig. 1A). To identify the cell type and subcellular distribution of purinergic receptors in OE and olfactory bulb, we used antibodies against P2X1, P2X2, P2X4, and P2Y2 receptors, and OMP, which is found in the cytoplasm of mature ORNs. OMP-positive ORNs showed specific punctate immunoreactivity (IR) to P2X1 and P2X4 antibodies on the cell soma and axons (Fig. 1B,C) and P2Y2-IR on the dendrites, somas, and axons (Fig. 1D). At higher magnification, we observed that P2X4- (Fig. 1E-G), P2X1-, and P2Y2-IR (data not shown) were localized to the plasma membrane near the supranuclear region of the ORN cell soma. Both P2X- and P2Y-IR was absent from dendritic knobs and cilia of ORNs. Immature OMP-negative ORNs and basal cells (olfactory stem cells) also showed specific P2X- and P2Y-IR. Sustentacular cells and Bowman's glands showed strong P2Y2-IR but only faint nonspecific P2X-IR (Fig. 1B-D). In the olfactory bulb, there was P2X1, P2X2, P2X4, and P2Y2 receptor IR in the olfactory nerve layer, the glomerular layer, and the mitral cell layer (data not shown). There was no P2X2-IR in the olfactory neuroepithelium; however, there was punctate P2X2-IR on blood vessels just below the basal cells (data not shown). Thus, the underlying blood vessels are the likely source of P2X2 mRNA identified by our RT-PCR studies of the OE. Preabsorption of the primary antibody with peptide antigen (Fig. 1H) or omission of the primary antibody (data not shown) blocked the specific purinergic receptor staining. Identification of regionally localized purinergic receptors in mammalian OE suggests that extracellular ATP plays multiple roles in the peripheral olfactory system.
Figure 1.

Identification of purinergic receptors in the OE. A, RT-PCR analysis of P2X2 and P2Y2 mRNA in rat OE and bulb. The 643 bp product represents the P2Y2 isoform; the 499 bp product represents the P2X2-1 isoform, and the 292 bp product is the P2X2-2 isoform. Control β-actin (867 bp) and neuron-specific enolase (NSE; 753 bp) RT-PCR reactions are shown. +, Reverse-transcribed mRNA; -, omission of reverse transcriptase. B, C, Neonatal mouse OE showing punctate P2X1- and P2X4-IR (green) in OMP-positive (red) axons and ORNs (filled arrowheads) and in OMP-negative ORNs (open arrowheads) and basal cells (arrow). SC, Sustentacular cell layer; BC, basal cell layer; NL, nerve layer; C, cribriform plate; NB, nerve bundle. D, Neonatal mouse P2Y2 receptor-IR (green) occurs in ORNs (filled arrowheads), in the sustentacular cell layer (open arrowhead), and in a Bowman's gland (BG, *). E-G, High-power projection of P2X4-IR (green, F-G) on OMP-positive ORNs (red, E, G). Note the localization of P2X4-IR to the plasma membrane, particularly in the supranuclear region of the ORNs (filled arrowheads). The projection was created by stacking 20 confocal images taken every 1.32 μm in the z-axis direction. H, P2X1 receptor antibody preabsorption. LP, Lamina propria. Scale bars: A-D, H, 20 μm; E-G, 10 μm.
Purinergic receptors are functional in cultured olfactory receptor neurons
We examined the physiological activation of purinergic receptors in cultured adult mouse ORNs using both nystatin perforated-patch voltage-clamp recordings (Fig. 2A), and calcium imaging (Fig. 2B-E). ATP (10 μm) evoked inward currents in 39% (27 of 69 ORNs) of the perforated-patch mouse ORNs during brief (1-10 sec) applications (Fig. 2A). In 48% of the responding cells a distinct, long latent period suggestive of slowly activating G-protein-coupled P2Y receptors was observed (Fig. 2A, cell 1, inset) (13 of 27 cells; latency, 1140 ± 236 msec; Imax = -29 ± 8 pA). Rapid activation of inward current that closely followed the ATP stimulus profile with little or no desensitization was also observed in 52% of the cells, suggesting involvement of nondesensitizing ionotropic P2X receptors (P2X4 and/or P2X7; Ralevic and Burnstock, 1998) (Fig. 2A, cell 2) (14 of 27 cells; latency, 81 ± 15 msec, Imax = -235 ± 74 pA). The rapidly activating currents were larger than the ATP-evoked currents with a slower latency (Imax = -235 ± 74 pA vs -29 ± 8 pA). In cells with large sustained currents, it was difficult to distinguish the slower activating, smaller current evoked by ATP through a G-protein-coupled P2Y receptor; however, we observed three cells (Fig. 2, cell 2) in which both slow (P2Y) and fast (P2X) receptors were activated by ATP. These electrophysiological results support our immunohistochemical evidence of expression of both purinergic receptor subtypes in ORNs.
Figure 2.

ATP evokes inward currents and increases intracellular Ca2+ in cultured mouse ORNs. A, Current responses to 10 μm ATP in two nystatin-patched ORNs held at -110 mV. Bottom trace shows the ATP stimulus profile recorded separately with an open electrode. Inset, Enlarged, compressed view of current from cell 1. B, Confocal images from fluo-4-AM-loaded ORNs taken before (left) and during (right) superfusion of 5 μm ATP. Scale bars, 50 μm. C, Representative fluorescence (F) increases from cell a in B in response to ATP (1-10 μm), Ringer's solution, 100 mm K+ Ringer's solution, and fluorescein (to show time course of solution delivery). D, Dose-response relationship for maximum % ΔF/F increases, relative to 10 μm ATP (mean ± SEM; n = 44 ORNs for each concentration). Curve was fitted by a Boltzmann equation, and the EC50 value of 1.4 μm was calculated by a nonlinear, least squares curve-fitting algorithm. Open square, Control 0 μm ATP (mean ± SEM). E, Representative traces from an ORN that responded to ATP (10 μm; arrowhead) in normal Ca2+and in 0 Ca2+ + EGTA (open bar).
Extracellularly applied ATP evoked a rapid transient increase in [Ca2+]i (Fig. 2B, C) (76 of 84 ORNs). On average, ATP (10 μm) induced a 151 ± 12% ΔF/F increase in [Ca2+]i (n = 76; range, 13-398%). Averaged dose-response relationships for ATP-induced [Ca2+]i increases in cultured mouse ORNs gave EC50 values of 1.4 μm (n = 44), comparable with previous reports for brain P2X receptors (Fig. 2D) (North and Barnard, 1997; Ralevic and Burnstock, 1998; North and Surprenant, 2000). To test for P2Y-receptor-mediated increases in intracellular calcium, we applied ATP in the absence of added external Ca2+. ATP-induced calcium transients in Ca2+-free solution (Fig. 2E) (n = 19). The increase in fluorescence intensity in the absence of Ca2+ suggests that part of the signal results from the release from intracellular Ca2+ stores, implicating P2Y receptor activation. We next used our neonatal OE slice preparation to further examine the source of intracellular calcium increases. In slices, ATP (10 μm) evoked transient increases in calcium in the presence and absence of external calcium (n = 40 ORNs, two slices), whereas the selective P2X receptor agonist βγ-methylene ATP evoked calcium transients only in the presence of extracellular calcium (n = 8 ORNs, two slices) and never in the absence of calcium (n = 4 slices), and the P2Y agonist ADP-βS evoked calcium transients in the presence and absence of extracellular calcium (n = 6, three slices). These slice data confirm immunohistochemical evidence that ORNs express both P2X and P2Y receptors. Collectively, electrophysiology and Ca2+ imaging show that purinergic receptors are functional in primary cultures of adult mouse ORNs and in slices of neonatal mouse OE.
Confocal imaging of OE slices
To study the effects of ATP on odor responses, we used acutely prepared slices of mouse OE. Confocal imaging of fluo-4-AM-loaded OE slices allows simultaneous recording from identified structures within the OE: i.e., both ORNs and sustentacular cells. In these and all subsequent experiments we used a mixture of two odors (10 μmn-amyl acetate + 10 μmr-carvone). Reproducible odor-evoked Ca2+ transients were obtained in a subset of ORNs when imaging >100 μm below the surface of the slice. The average peak amplitudes for three applications of odors superfused 10 min apart were, in ΔF/F, 7.93 ± 0.53, 7.47 ± 0.79, and 7.63 ± 0.50 and the average normalized peak calcium transients were 1.00 ± 0.00, 0.95 ± 0.08, and 0.97 ± 0.02 (n = 36 ORNs from 14 slices). Reproducible purinergic-evoked Ca2+ transients were also obtained from ORNs. For example, the average peak amplitudes for three applications of P2Y agonists ADP-βS superfused 10 min apart were, in ΔF/F, 16.39 ± 6.45, 19.33 ± 6.69, and 17.17 ± 7.14; the average normalized peak calcium transients were 1.00 ± 0.00, 1.2 ± 0.17, and 1.00 ± 0.05 (n = 4 ORNs from four slices). The frequency of response for βγ-methylene ATP and ADP-βS was lower than either ATP or odor. Peak amplitudes of calcium transients to any of the purinergic agonists did not vary by >20% across repeated applications. There was considerable variability in amplitudes of odor-evoked and purinergic-evoked calcium transients. For example, in one slice the mean amplitude of ATP-evoked calcium transients was 12.09 ± 1.94 (range, 2.65-31.65; n = 22) and the mean amplitude of odor-evoked calcium transients was 10.59 ± 2.69 (range, 2.18-48.73; n = 22).
Figure 3 shows an example of odor- and purinergic-evoked calcium transients from one OE slice. The dynamic changes in [Ca2+]i are even more apparent in the Web-based animations (see supplementary information, available at http://medstat.med.utah.edu/physio/hegg/). In this particular slice, odor-evoked Ca2+ transients rapidly activated and returned to basal levels within 125.7 ± 11.1 sec (Fig. 3A)(n = 11 ORNs). Superfusion of ATP (10 μm) onto this slice evoked Ca2+ transients from all 11 ORNs previously identified by their response to odors, although the responses to ATP (Fig. 3B1-B4) are less obvious than the odor responses (Fig. 3, compare A2, B2). The difference in robustness may be caused by poor access to the ATP stimulus: odorant receptors are on the cilia of the ORNs, which extend beyond the outer edge of the OE, whereas purinergic receptors are located deeper within the slice of OE. ATP also evoked Ca2+ transients from sustentacular cells, identified by their location, morphology, and lack of response to odor (Fig. 3B3). The latency of activation for the ATP-evoked Ca2+ transient was shorter in the ORN (Fig. 3B2, filled upward-pointing arrowhead) than in sustentacular cells (Fig. 3B3, open downward-pointing arrowhead). Collectively, this suggests that the ORNs in this field of view express the faster P2X receptors, and the sustentacular cells express the slower G-protein-coupled P2Y receptors.
Figure 3.

Odor and purinergic receptor (P2R) agonists evoke increases in [Ca2+]i. See also supplementary information (available at http://medstat.med.utah.edu/physio/hegg/). A1-D4, Confocal images from a fluo-4-AM-loaded mouse OE slice during application of odors (10 μmn-amyl acetate + 10 μm r-carvone) (A), 10 μm ATP (B), 10 μm βγ-methylene ATP (βγ-MeATP) (C), or 10 μm UTP (D). Scale bar, 10 μm. A5-D5, Time course of odor- and P2R-agonist-evoked Ca2+ transients. Time points indicated by black triangles correspond to frame numbers in A1-D4. Representative odor-responsive ORNs are indicated by filled triangles (A1-A4; 6/11 ORNs marked) and as solid lines in A5. One odor-responsive ORN (filled triangle in B1-D4) and one SC (open triangle in B1-D4) are shown in the time course (B5-D5).
To further test whether functional purinergic receptor subtypes are differentially expressed in olfactory epithelial cell types, purinergic receptor agonists were used. Because there are no completely specific purinergic receptor agonists (Ralevic and Burnstock, 1998), we designate agonists as “P2X-selective” or “P2Y-selective” in the broadest of terms. The P2X-selective agonist βγ-methylene ATP was superfused onto the slice (Fig. 3C). Only the ORNs, and not the sustentacular cells, responded to βγ-methylene ATP with an increase in [Ca2+]i (Fig. 3C5). The P2Y-selective agonist UTP evoked Ca2+ transients in both ORNs and sustentacular cells (Fig. 3D). However, compared with the nonselective agonist ATP, the peak amplitudes were smaller in the ORNs and the latency of activation in the ORNs was longer, and equivalent to the latency of activation in the sustentacular cells (Fig. 3, compare D2,5, B2,5). These data suggest that the identified ORN expressed P2X and, to a lesser extent, P2Y receptors, and that the sustentacular cells expressed only P2Y receptors. They also confirm our immunohistochemical and electrophysiological evidence for differential expression of purinergic receptors in mammalian OE.
A variety of nonselective purinergic receptor agonists (ATP, ATPγS, AMP), P2Y-selective agonists (UTP, ADP, MeS-ADP), P2X-selective agonists (βγ-methylene ATP) (Fig. 4A,B), and an adenosine receptor-selective agonist (adenosine) were superfused onto olfactory epithelial slices, and the change in [Ca2+]i was measured. We never observed adenosine- or AMP-evoked Ca2+ transients (data not shown). ORNs responded with approximately equal frequency to P2Y and P2X receptor agonists, whereas sustentacular cells responded primarily to P2Y receptor agonists. The general nonspecific purinergic receptor antagonists suramin and pyridoxalphosphate-6-azophenyl-2′,4′-disulfonic acid (PPADS) were used to further confirm that purinergic-evoked Ca2+ transients were mediated via purinergic receptors. In ORNs shown previously to respond to both ATP and UTP, suramin (100 μm) reversibly blocked both ATP- and UTP-evoked Ca2+ transients by 88 ± 2 and 72 ± 6% (n = 9). PPADS (25 μm) also reversibly blocked the ATP- and UTP-evoked Ca2+ transients by 87 ± 5 and 92 ± 3% (n = 5). Purinergic receptor antagonists also reversibly blocked purinergic nucleotide-evoked Ca2+ transients in sustentacular cells. Suramin blocked ATP- and UTP-evoked Ca2+ transients by 90 ± 1 and 89 ± 1% (n = 37) and PPADS blocked the transients by 82 ± 2 and 76 ± 2%, respectively (n = 30). Collectively, our data show that the ATP-evoked Ca2+ transients were mediated by P2X and P2Y receptors.
Figure 4.

Frequency of response to purinergics in ORNs and sustentacular cells. Shown are the percentages of ATP-sensitive ORNs (A; identified by odor responsiveness; n = 14) and SCs (B; identified by location and lack of odor response; n = 122) that also had increases in [Ca2+]i evoked by nonselective purinergic receptor agonists (ATP, ATPγS), P2Y-selective agonists (UTP, ADP, MeSADP), and P2X-selective agonists (βγ-MeATP). The concentration for all purinergics was 10 μm.
ATP modulates odor responses
Calcium is an important intracellular messenger during odor transduction, affecting signal amplification (Lowe and Gold, 1993) and adaptation (Zufall et al., 1991). Our data indicate that purinergic nucleotides evoke robust increases in intracellular calcium; thus, we were interested in whether ATP could alter the odor-induced Ca2+ transients in ORNs. We sequentially superfused odors and ATP and then coapplied odors and ATP onto our OE slice preparation (Fig. 5A). On average, the coapplication-evoked Ca2+ transient was significantly smaller (24 ± 6%) than the sum of the odor-evoked Ca2+ transient and ATP evoked Ca2+ transient (Fig. 5B)(p = 0.001, n = 26). Exclusion of the 10 cells that did not show >20% suppression revealed a significant mean suppression of 43 ± 4% (p < 0.001; n = 16). The observed decrease caused by coapplication was not the result of rundown because post-coapplication responses both to ATP and to odors were ±10% of pre-coapplication (Fig. 5A). Moreover, the observed decrease caused by coapplication was not the result of fluo-4 dye saturation or nonlinearities in Ca2+ responses. To verify that Ca2+ responses obtained under our experimental conditions were in the linear range, we correlated the normalized averaged peak amplitudes from the ATP-odor modulation data (Fig. 5B) to our odor dose-response relationship (Fig. 5C). The dose-response relationship clearly shows that 10 μm odor was not a saturating concentration. Note that both the actual coapplication peak amplitude and the predicted peak amplitude (assuming a summation of the individual responses to odor and ATP) from Figure 5B fall well within in the linear range of the dose-response relationship, indicating that under our experimental conditions we could detect linear increases in fluorescence. Thus, ATP significantly reduced odor-induced calcium transients in the majority of ORNs.
Activation of specific purinergic receptor subtypes modulates odor sensitivity
Our electrophysiological and imaging data suggest that in individual ORNs, either one or both classes of purinergic receptors can be activated by ATP. In addition, we found that in OE slices, the P2X agonist βγMeATP caused entry, whereas P2Y agonist ADPβS led to the release of calcium from intracellular stores. We examined the effect of P2X and P2Y agonists on odor responses to determine whether the source of calcium (intracellular vs extracellular) is important to odor suppression. We sequentially superfused odors, various selective purinergic receptor agonists and coapplied odors and purinergic receptor agonists onto our slice preparation. We found that the coapplication of the P2X agonist βγ-methylene ATP (10 μm) and odor suppressed the amplitude of Ca2+ transients by 25 ± 11% compared with the summed amplitudes (Fig. 6A,B) (n = 16 cells; p < 0.04). When the four ORNs that did not show 20% suppression were excluded, the odor response was reduced by 42 ± 5% (n = 12; p < 0.001). Coapplication of the P2Y agonist ADPβS (10 μm) and odor suppressed the Ca2+ transient amplitude by 41 ± 4% compared with the summed amplitudes (Fig. 6C,D) (n = 15; p < 0.001). Thus, the P2Y agonist ADPβS significantly reduced the odor responsiveness of ORNs in all cells tested.
Figure 6.
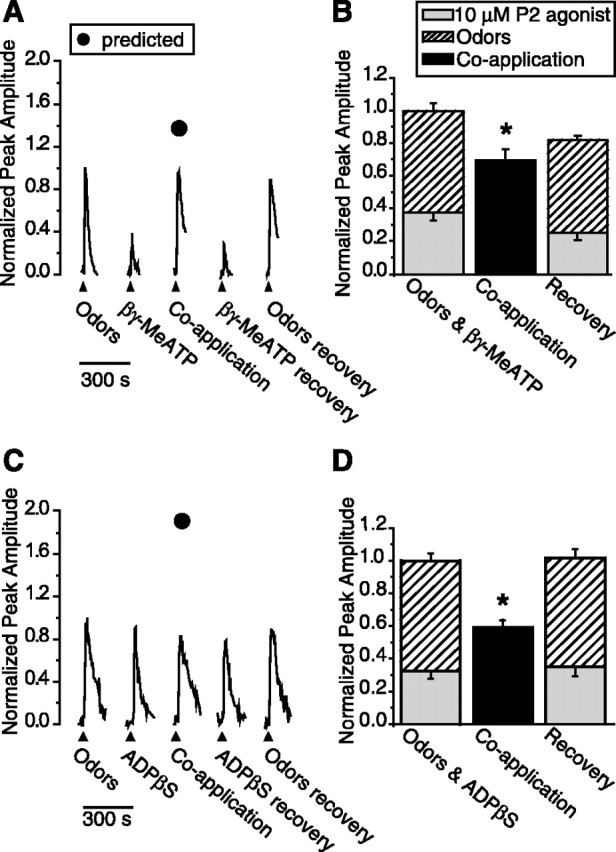
Activation of specific purinergic receptor subtypes suppresses odor responses. A, C, Representative calcium transients in response to odor, 10 μm purinergic receptor (P2) agonists, or coapplication of odor + P2 agonists from individual mouse ORNs in fluo-4 AM-loaded OE slices. Filled triangles correspond to the time of loop injection of the odors or P2 agonists. Filled circles correspond to the predicted peak amplitude of coapplication (obtained by adding the control odor and P2 agonist values; refer to data analysis section for details). B, D, Responses to individual applications of P2 agonists and odor were normalized to the sum of each response and averaged (stacked columns). The responses to coapplication of P2 agonists and odor were normalized to the summed individual responses and averaged (black columns). The recoveries, obtained after coapplication, were also normalized to the initial summed response. Bar graphs depict normalized peak Ca2+ transient amplitudes (means + SEM). *p < 0.04, 0.001, respectively. A, B, Coapplication of P2X agonist (10 μm βγ-MeATP) and odor suppressed the calcium transient amplitude in 16 ORNs from six slices. C, D, Coapplication of P2Y agonist (10 μm ADPβS) and odor reduced the calcium transient amplitude in 15 ORNs from five slices.
Despite considerable effort, we were unable to reliably obtain odor- and P2-agonist-evoked calcium transients of equal amplitude. The P2-agonist-evoked Ca2+ transient was smaller than the odor-evoked transient in 39 of 55 ORNs (Fig. 6A), although in 29% of the cells, we were able to obtain equal peak amplitudes (16 of 55 ORNs) (Fig. 6C). When the P2-agonist-evoked transient is smaller than the odor-evoked transient, the possibility arises that coapplication suppresses the purinergic-evoked Ca2+ transient, rather than the odor-evoked calcium transient. However, when the odor- and P2-agonist-evoked transients were equal, we observed that the coapplication-evoked transient could be lower than each individual response (Fig. 6C). This suggests that either the odor response or the P2 agonist response is completely inhibited, or more likely, that both responses are partially inhibited. These data reveal the possibility of reciprocal suppression by odor and P2 agonists. Additional experiments will be necessary to determine the exact contributions of each to the total suppression. Collectively, these data indicate that activation of either P2X or P2Y receptors produces a significant reduction in odor responses.
Purinergic receptor antagonists potentiate odor sensitivity
We hypothesized that if the predominant role of endogenous ATP is to reduce odor sensitivity, then addition of purinergic receptor antagonists should potentiate odor responses. Control experiments in which we applied odors at 5-8 min intervals revealed a small linear increase in the peak amplitude of the odor-induced Ca2+ transient (Fig. 7A,C). A linear regression between the first and last odor application was performed, and the predicted amplitude of the middle response was calculated. Based on linear regressions, the actual amplitude of the middle odor application was not significantly different from the predicted amplitude, both in the single cell shown in Figure 7A and in the average of 30 cells in Figure 7C (n = 30; -3 ± 4% difference; paired Student's t test, p = 0.47). In contrast, when the middle odor application was preceded by and concomitant with perfusion of purinergic receptor antagonists (100 μm suramin + 25 μm PPADS), we observed a significant increase in the Ca2+ transient amplitude such that the mean observed response was 14 ± 5% larger than the predicted response (n = 22; paired Student's t test, p = 0.02). The differences between predicted and observed were also statistically different when the control group was compared with the purinergic receptor agonist-treated group (independent Student's t test, p = 0.01). The enhancement of odor-evoked calcium transients in the presence of purinergic receptor antagonists suggests that endogenous extracellular ATP is present and tonically reducing ORN odor sensitivity.
Figure 7.

Purinergic receptor antagonists potentiate odor-evoked calcium transients. A, B, Representative normalized calcium transients in response to odor in the absence (A) or presence (B) of P2 receptor antagonists (100 μm suramin + 25 μm PPADS) from individual mouse ORNs in fluo-4-AM-loaded OE slices. Filled triangles correspond to the time of loop injection of the odors. Slices were pretreated for 3 min with Ringer's solution or P2 receptor antagonists (open columns). C, Average peak calcium transient amplitudes are shown (means + SEM), as are the predicted peak amplitudes (filled circles) for the second application (n = 30 ORNs from seven slices for control and n = 22 ORNs from 12 slices for P2 receptor antagonists). The asterisk indicates a significant increase in [Ca2+]i in the observed compared with predicted (p = 0.024, paired Student's t test). D, Representative traces depicting basal fluorescence levels when bath is switched at 10 sec (open column) from Ringer's solution to either P2 receptor antagonists (solid lines) or Ringer's solution (dotted lines). The fluorometric signals shown are expressed as relative fluorescence change, ΔF/F = (F - F0)/F, where F0 is calculated from the linear rate of decay during the first 15 sec of the recording (F0 = mX + b). Thus, values of 0 represent no change in fluorescence and calcium levels, negative values represent decreases in calcium, and positive values represent increases in basal calcium levels.
The application of purinergic receptor antagonists alone did not evoke calcium transients (Fig. 7B, second trace), but did elicit a significant decrease in the basal calcium levels (Fig. 7D). During control experiments (Fig. 7A,D) there was little change in fluorescence (ΔF/F) after the bath switch from Ringer's solution to Ringer's solution (mean ΔF/F =-1.2 ± 0.5, n = 30). In contrast, a bath switch from Ringer's solution to purinergic receptor antagonists (100 μm suramin + 25 μm PPADS) induced a significant decrease in fluorescence (Fig. 7D) (mean ΔF = -5.3 ± 1.7, n = 22; p = 0.01, independent Student's t test). This suggests that endogenous ATP acts on purinergic receptors to elevate intracellular calcium tonically. Collectively, our data show that both endogenous and exogenous ATP reduces the amplitude of odor-evoked calcium transients through purinergic receptors, suggesting that ATP modulates ORN sensitivity.
ATP reduces cyclic nucleotide-induced electrical responses
Odor activation of G-protein-coupled receptors results in increased cAMP production, opening of cyclic nucleotide-gated channels, influx of Ca2+ and Na+, depolarization of the membrane, and activation of voltage- and Ca2+-gated ion channels (for review, see Schild and Restrepo, 1998). Based on our calcium imaging data, we hypothesize that purinergics would reduce the odor-evoked electrical activity of ORNs. Recording odor-evoked membrane responses from single ORNs has a low probability of success because each ORN expresses only one or a few odorant receptors (Buck and Axel, 1991). Thus, we used a mixture of cyclic nucleotide modulators to record membrane responses: IBMX (100 μm), a phosphodiesterase inhibitor that prevents the breakdown of cAMP, CPT-cAMP (50 μm), and 8-Br-cGMP (50 μm), both membrane-permeant analogs of cAMP and cGMP, respectively. This cyclic nucleotide mixture was tested initially to verify that it evoked membrane potential changes in our OE slice preparation. The EOG measures field potential changes across the OE after stimulation. We obtained similar EOG responses from both odor (10 μm) and the cyclic nucleotide mixture (Fig. 8A), validating the replacement of odor with the mixture in subsequent recordings. Next we performed on-cell current-clamp recordings of ORNs from neonatal mouse slices. We sequentially superfused the cyclic nucleotide mixture, the mixture + ATP, a second application of the mixture, and ATP onto our slice preparation and measured membrane potential changes (Fig. 8B). We found that the coapplication of ATP and the cyclic nucleotide mixture suppressed the cyclic nucleotide-induced electrical responses. The membrane response from each ORN was integrated from baseline and normalized to the initial cyclic nucleotide mixture response. The presence of ATP reduced the electrical activity of the ORN by 67 ± 2% (Fig. 8C)(n = 3 cells; p < 0.01, Newman-Keuls post hoc test). These data also support the idea that ATP modulates odor sensitivity in mammalian olfactory neurons.
Discussion
Localization of purinergic receptors
Our findings indicate that purinergic receptor subtypes are differentially expressed in ORNs and sustentacular cells, and that ORNs express multiple purinergic receptor subtypes. In other cell types, the expression of more than one type of purinergic receptor allows for regulation of multiple effectors, and provides a mechanism for rapid and local fine tuning of agonist-evoked responses at the cellular level (Ralevic and Burnstock, 1998). Our immunohistochemical studies showed a notable absence of purinergic receptors in the dendritic knobs and cilia, the site of odor transduction, whereas both P2X and P2Y receptors are located on the cell soma and other regions. This suggests that purinergic receptor activation is unlikely to affect initial odor-induced receptor potentials, but may shape the final integrated output of the cell.
Trophic actions of purinergics
Interestingly, we observed the presence of both P2X- and P2Y receptors on basal cells (olfactory stem cells). Extracellular purine nucleotides have been reported to exert multiple trophic actions in the CNS (Neary et al., 1996). The olfactory neuroepithelium is constantly exposed to airborne pollutants and microbes; consequently, it continuously regenerates, giving rise to neurons in various stages of development, including birth, maturation, and programmed cell death or apoptosis (Graziadei and Monti-Graziadei, 1978; Cowan and Roskams, 2002). ATP released by acutely injured cells could stimulate localized regeneration caused by the mitogenic and growth-promoting effects of purinergic receptor activation. Growth promotion can be mediated by P2Y receptors, located on basal stem cells, which, like other growth factor receptors, induce a cascade of intracellular events that trigger cell proliferation (Neary et al., 1996). In addition, our data showing physiological responses of sustentacular cells to a neuromodulator are completely novel and open up the possibility of a new pathway to be explored for signaling injury-induced regeneration of OE.
Suppression of odor responsiveness by purinergics
A longstanding dogma, that odor sensitivity is not modulated at the level of the OE, is based on anatomical studies showing absence of efferent synapses on ORNs (Graziadei, 1971; Getchell, 1986). A recent study showing release of ATP in the OE after noxious stimuli (Kilgour et al., 2000) demonstrated an in situ source for a neuromodulatory substance that does not require efferent innervation. Although a few studies have provided indirect evidence that neurotransmitters should modulate odor sensitivity at the level of the ORN (Frings, 1993; Kawai et al., 1999; Vargas and Lucero, 1999b; Eisthen et al., 2000; Wetzel et al., 2001; Park et al., 2003), this is the first report with direct evidence that a neuromodulator, ATP, can alter the odor responsiveness of mammalian ORNs.
We found that exogenous ATP or specific activation of P2X and P2Y receptors suppressed odor sensitivity. These data suggest that the overall increase in intracellular calcium mediates the reduction in sensitivity, regardless of the source of calcium. The mechanism of purinergic-evoked suppression of odorant responses is not known. However, the initial site of odor transduction is in the cilia, where activation of ORNs by an odorant results in a slow and graded depolarization that generates a receptor potential and activates voltage-gated conductances that are encoded into a train of action potentials that travel to the olfactory bulb. Activation of Na+ channels and subsequent activation of high-threshold calcium channels, situated at the cell soma and proximal dendrite, results in localized calcium influx and subsequent activation of calcium-activated K+ channels thought to be colocalized with high-threshold calcium channels (Schild and Restrepo, 1998; Kawai, 2002). The membrane is repolarized via (1) activation of Ca2+-activated K+ channels, (2) activation of delayed rectifier K+ conductances, and (3) inactivation of Na+ channels. Activation of either subtype of purinergic receptor, also localized on the proximal dendrites and cell somas, increases calcium. Calcium can modulate a number of receptors, enzymes, and channels involved in odorant signal transduction; thus, purinergic alteration of calcium homeostasis has the potential to alter odor sensitivity. Additional studies are needed to compare acute versus chronic purinergic receptor activation on odor responses. Overall, suppression of odor-induced calcium transients during exposure to noxious fumes in mature ORNs would prevent overstimulation both in the periphery and at the olfactory bulb.
Physiological relevance of the purinergic signaling pathway
Perhaps the strongest evidence for a physiological role of ATP as an endogenous modulator of odor sensitivity comes from our purinergic receptor antagonist studies. Superfusion of P2X and P2Y receptor antagonists (suramin + PPADS) reduced basal calcium levels, suggesting that low levels of endogenous ATP tonically elevates [Ca2+]i. We also observed an enhanced sensitivity to odors in the presence of purinergic receptor antagonists, suggesting that low-level endogenous ATP normally reduces odor responsiveness.
What is the physiological role for purinergic receptors in the peripheral olfactory system? Purinergic receptors appear to play an integral role in signaling acute damage to OE. Damaged cells release ATP, thereby activating purinergic receptors on neighboring sustentacular cells, ORNs, and basal cells and initiating a cascade for neuroprotection and regeneration. Indeed, our recent preliminary studies show that the induction of heat-shock proteins by noxious odor damage can be prevented by the in vivo administration of purinergic receptor antagonists (Hegg et al., 2003). The predominantly suppressive effect of ATP on odor responses could play a role in the reduced odor sensitivity that occurs during acute exposure to noxious fumes (Callender et al., 1993) and may be a novel neuroprotective mechanism for future study.
Footnotes
This work was supported by National Institute on Deafness and Other Communication Disorders Grants DC04953 (C.C.H.), DC02994 (M.T.L.), and DC01418 (William C. Michel). We thank Tu Dang and Kathleen Davis for technical assistance and Dr. Larry Stensaas for suggestions on this manuscript.
Correspondence should be addressed to Dr. Colleen C. Hegg, 410 Chipeta Way, Room 155, Salt Lake City, UT 84108-1297. E-mail: c.hegg@m.cc.utah.edu.
Copyright © 2003 Society for Neuroscience 0270-6474/03/238291-11$15.00/0
References
- Bodin P, Burnstock G ( 2001) Purinergic signalling: ATP release. Neurochem Res 26 : 959-969. [DOI] [PubMed] [Google Scholar]
- Brake AJ, Wagenbach MJ, Julius D ( 1994) New structural motif for ligand-gated ion channels defined by an ionotropic ATP receptor. Nature 371 : 519-523. [DOI] [PubMed] [Google Scholar]
- Brandle U, Spielmanns P, Osteroth R, Sim J, Surprenant A, Buell G, Ruppersberg JP, Plinkert PK, Zenner HP, Glowatzki E ( 1997) Desensitization of the P2X(2) receptor controlled by alternative splicing. FEBS Lett 404 : 294-298. [DOI] [PubMed] [Google Scholar]
- Buck L, Axel R ( 1991) A novel multigene family may encode odorant receptors: a molecular basis for odor recognition. Cell 65 : 175-187. [DOI] [PubMed] [Google Scholar]
- Burnstock G ( 1997) The past, present and future of purine nucleotides as signalling molecules. Neuropharmacology 36 : 1127-1139. [DOI] [PubMed] [Google Scholar]
- Callender TJ, Morrow L, Subramanian K, Duhon D, Ristovv M ( 1993) Three-dimensional brain metabolic imaging in patients with toxic encephalopathy. Environ Res 60 : 295-319. [DOI] [PubMed] [Google Scholar]
- Carr VM, Menco BP, Yankova MP, Morimoto RI, Farbman AI ( 2001) Odorants as cell-type specific activators of a heat shock response in the rat olfactory mucosa. J Comp Neurol 432 : 425-439. [DOI] [PubMed] [Google Scholar]
- Carr WE, Ache BW, Gleeson RA ( 1987) Chemoreceptors of crustaceans: similarities to receptors for neuroactive substances in internal tissues. Environ Health Perspect 71 : 31-46. [DOI] [PMC free article] [PubMed] [Google Scholar]
- Chiu P, Lynch JW, Barry PH ( 1997) Odorant-induced currents in intact patches from rat olfactory receptor neurons: theory and experiment. Biophys J 72 : 1442-1457. [DOI] [PMC free article] [PubMed] [Google Scholar]
- Cowan CM, Roskams AJ ( 2002) Apoptosis in the mature and developing olfactory neuroepithelium. Microsc Res Tech 58 : 204-215. [DOI] [PubMed] [Google Scholar]
- Dubyak GR, el-Moatassim C ( 1993) Signal transduction via P2-purinergic receptors for extracellular ATP and other nucleotides. Am J Physiol 265 : C577-C606. [DOI] [PubMed] [Google Scholar]
- Eisthen HL, Delay RJ, Wirsig-Wiechmann CR, Dionne VE ( 2000) Neuromodulatory effects of gonadotropin releasing hormone on olfactory receptor neurons. J Neurosci 20 : 3947-3955. [DOI] [PMC free article] [PubMed] [Google Scholar]
- Finger TE, St. Jeor VL, Kinnamon JC, Silver WL ( 1990) Ultrastructure of substance P- and CGRP-immunoreactive nerve fibers in the nasal epithelium of rodents. J Comp Neurol 294 : 293-305. [DOI] [PubMed] [Google Scholar]
- Frings S ( 1993) Protein kinase C sensitizes olfactory adenylate cyclase. J Gen Physiol 101 : 183-205. [DOI] [PMC free article] [PubMed] [Google Scholar]
- Getchell ML, Getchell TV ( 1992) Fine structural aspects of secretion and extrinsic innervation in the olfactory mucosa. Microsc Res Tech 23 : 111-127. [DOI] [PubMed] [Google Scholar]
- Getchell TV ( 1986) Functional properties of vertebrate olfactory receptor neurons. Physiol Rev 66 : 772-818. [DOI] [PubMed] [Google Scholar]
- Graziadei PPC ( 1971) The olfactory mucosa of vertebrates. In: Handbook of sensory physiology (Beidler LM, ed), pp 27-58. Berlin: Springer.
- Graziadei PPC, Monti-Graziadei GA ( 1978) Continuous nerve cell renewal in the olfactory system. In: Handbook of sensory physiology (Jacobson M, ed), pp 55-83. New York: Springer.
- Hegg CC, Davis K, Lucero MT ( 2003) Inhibition of heat-shock protein induction in mouse OE by in vivo administration of purinergic receptor antagonists. Chem Senses 28 : A110. [Google Scholar]
- Horn R, Marty A ( 1988) Muscarinic activation of ionic currents measured by a new whole-cell recording method. J Gen Physiol 92 : 145-159. [DOI] [PMC free article] [PubMed] [Google Scholar]
- Illes P, Klotz KN, Lohse MJ ( 2000) Signaling by extracellular nucleotides and nucleosides. Naunyn Schmiedebergs Arch Pharmacol 362 : 295-298. [DOI] [PubMed] [Google Scholar]
- Kang J, Caprio J ( 1995) In vivo responses of single olfactory receptor neurons in the channel catfish, Ictalurus punctatus. J Neurophysiol 73 : 172-177. [DOI] [PubMed] [Google Scholar]
- Kawai F ( 2002) Ca2+-activated K+ currents regulate odor adaptation by modulating spike encoding of olfactory receptor cells. Biophys J 82 : 2005-2015. [DOI] [PMC free article] [PubMed] [Google Scholar]
- Kawai F, Kurahashi T, Kaneko A ( 1999) Adrenaline enhances odorant contrast by modulating signal encoding in olfactory receptor cells. Nat Neurosci 2 : 133-138. [DOI] [PubMed] [Google Scholar]
- Kilgour JD, Simpson SA, Alexander DJ, Reed CJ ( 2000) A rat nasal epithelial model for predicting upper respiratory tract toxicity: in vivo-in vitro correlations. Toxicology 145 : 39-49. [DOI] [PubMed] [Google Scholar]
- Koshimizu TA, Van Goor F, Tomic M, Wong AO, Tanoue A, Tsujimoto G, Stojilkovic SS ( 2000) Characterization of calcium signaling by purinergic receptor-channels expressed in excitable cells. Mol Pharmacol 58 : 936-945. [DOI] [PubMed] [Google Scholar]
- Lopez-Candales A, Scott MJ, Wickline SA ( 1995) Cholesterol feeding modulates spatial expression of TGF-beta 1 and beta 2 in aortas of Watanabe rabbits. Cytokine 7 : 554-561. [DOI] [PubMed] [Google Scholar]
- Lowe G, Gold GH ( 1993) Nonlinear amplification by calcium-dependent chloride channels in olfactory receptor cells. Nature 366 : 283-286. [DOI] [PubMed] [Google Scholar]
- Neary JT, Rathbone MP, Cattabeni F, Abbracchio MP, Burnstock G ( 1996) Trophic actions of extracellular nucleotides and nucleosides on glial and neuronal cells. Trends Neurosci 19 : 13-18. [DOI] [PubMed] [Google Scholar]
- North RA, Barnard EA ( 1997) Nucleotide receptors. Curr Opin Neurobiol 7 : 346-357. [DOI] [PubMed] [Google Scholar]
- North RA, Surprenant A ( 2000) Pharmacology of cloned P2X receptors. Annu Rev Pharmacol Toxicol 40 : 563-580. [DOI] [PubMed] [Google Scholar]
- Park D, Zawacki SR, Eisthen HL ( 2003) Olfactory signal modulation by molluscan cardioexcitatory tetrapeptide (FMRFamide) in axolotls (Ambystoma mexicanum). Chem Senses 28 : 339-348. [DOI] [PubMed] [Google Scholar]
- Ralevic V, Burnstock G ( 1998) Receptors for purines and pyrimidines. Pharmacol Rev 50 : 413-492. [PubMed] [Google Scholar]
- Roman RM, Wang Y, Lidofsky SD, Feranchak AP, Lomri N, Scharschmidt BF, Fitz JG ( 1997) Hepatocellular ATP-binding cassette protein expression enhances ATP release and autocrine regulation of cell volume. J Biol Chem 272 : 21970-21976. [DOI] [PubMed] [Google Scholar]
- Schild D, Restrepo D ( 1998) Transduction mechanisms in vertebrate olfactory receptor cells. Physiol Rev 78 : 429-466. [DOI] [PubMed] [Google Scholar]
- Schwiebert EM, Kishore BK ( 2001) Extracellular nucleotide signaling along the renal epithelium. Am J Physiol Renal Physiol 280 : F945-F963. [DOI] [PubMed] [Google Scholar]
- Thorne PR, Housley GD ( 1996) Purinergic signalling in sensory systems. Semin Neurosci 8 : 233-246. [Google Scholar]
- Vargas G, Lucero MT ( 1999a) A method for maintaining odor-responsive adult rat olfactory receptor neurons in short-term culture. Chem Senses 24 : 211-216. [DOI] [PubMed] [Google Scholar]
- Vargas G, Lucero MT ( 1999b) Dopamine modulates inwardly rectifying hyperpolarization-activated current (Ih) in cultured rat olfactory receptor neurons. J Neurophysiol 81 : 149-158. [DOI] [PubMed] [Google Scholar]
- Wetzel CH, Spehr M, Hatt H ( 2001) Phosphorylation of voltage-gated ion channels in rat olfactory receptor neurons. Eur J Neurosci 14 : 1056-1064. [DOI] [PubMed] [Google Scholar]
- Zufall F, Shepherd GM, Firestein S ( 1991) Inhibition of the olfactory cyclic nucleotide gated ion channel by intracellular calcium. Proc R Soc Lond B Biol Sci 246 : 225-230. [DOI] [PubMed] [Google Scholar]