

Summary
The diverse functions of microtubules require stiff structures possessing sufficient lateral flexibility to enable bending with high curvature. We used cryo-electron microscopy to investigate the molecular basis for these critical mechanical properties. High-quality structural maps were used to build pseudo-atomic models of microtubules containing 11 to 16 protofilaments, representing a wide range of lateral curvature. Protofilaments in all these microtubules were connected primarily via inter-protofilament interactions between the M loops, and the H1′-S2 and H2-S3 loops. We postulate that the tolerance of the loop-loop interactions to lateral deformation provides the capacity for high-curvature bending without breaking. On the other hand, the local molecular architecture that surrounds these connecting loops contributes to the overall rigidity. Inter-protofilament interactions in the seam region are similar to those in the normal helical regions, suggesting that the existence of the seam does not significantly affect the mechanical properties of microtubules.
Introduction
Microtubules (MTs) are one of the three major types of cytoskeleton filaments. They play critical roles in the eukaryotic cell cycle, particularly when high compressive strength is required. Biophysical measurements have demonstrated that MTs are relatively rigid structures in vitro, with a Young's modulus of 1-2 GPa (comparable to Plexiglas), thus making them over 100 times stiffer than actin filaments (Felgner et al., 1996; Gittes et al., 1993; Kurachi et al., 1995; Schaap et al., 2006; Venier et al., 1994). Despite this rigidity, MTs are seen to bend with high curvature both in vitro and in vivo (Amos and Amos, 1991; Bicek et al., 2009; McIntosh and Porter, 1967; Poole et al., 1985; Roth et al., 1988; Schwartz et al., 1997). In cells, MTs are subject to mechanical stresses, including axial compression, tension, and lateral forces: their mechanical response, such as bending, must be functionally appropriate. Their response can be modulated by various microtubule-associated proteins (MAPs) and small ligands such as Taxol (Dye et al., 1993; Felgner et al., 1997). It is evident that the mechanical properties of MTs are precisely tuned for MTs' proper functioning in cells, and there has been great interest in characterizing the structural basis of these properties in order to achieve a better understanding of how these functions of MTs are supported (Kasas and Dietler, 2007; Tuszynski et al., 2005).
Microtubules are constructed from laterally connected protofilaments (PFs) that are composed of repeating α/β tubulin heterodimers. The structure of tubulin dimers has been determined both in straight PFs, by electron crystallography (Lowe et al., 2001; Nogales et al., 1998), and in curved tubulin complexes, by x-ray crystallography (Ravelli et al., 2004). Although the atomic structures of α- and β-tubulins are very similar, they interact differently with GTP and often with MAPs (Nogales et al., 1998; Sindelar and Downing, 2007). Disassembly or dissociation of MTs often occurs with splaying and curling of PFs into stable rings and spirals, reflecting the fact that longitudinal interactions are stronger than those between PFs. Thus, PFs are considered to be building blocks of MTs, and inter-PF interactions play a critical role in defining the stability and mechanical properties of MTs.
Although most of the MTs in cells contain 13 PFs (Ledbetter and Porter, 1964); (Tilney et al., 1973), MTs with PF numbers ranging from 8 to 20 have been observed both in vitro and in vivo (Bohm et al., 1984; Chretien and Wade, 1991; Dallai et al., 2006; Dallai and Afzelius, 1990). Structural differences between α- and β-tubulin are generally not detected by electron microscopy (EM) below 8 Å resolution (Li et al., 2002), and it is customary to describe structural types of MTs with PF numbers associated with the monomer pitch per helical turn. For example, the common MTs with 13 PF and a 3-start helix will be referred to as MT 13-3. Based on theoretical calculations of the surface lattice distortion required for different PF and start numbers, possible structural types have been proposed for MTs with PF numbers from 10 to 17 (Chretien and Wade, 1991). While experimental data confirmed the theoretical lattice prediction for the MTs of 10, 13, 14, and 16 PFs (Hirose et al., 1997; Hirose et al., 1995; Kikkawa et al., 1995), EM study suggested that 15-PF MTs display a 4-start structure more often than 3 (Lanzavecchia et al., 1994; Sosa et al., 1997; Sosa and Milligan, 1996). It was not clear whether MTs with 11 and 12 PFs have a 2-start or a 3-start helical structure.
The apparent ease of adoption of different lateral curvatures among MTs with a range of PF numbers is in line with lateral deformability of the MT wall. In fact, lateral deformation of MTs has been visualized in isolated MT doublets from flagellar axonemes by cryo-electron tomography (Sui and Downing, 2006), as well as in intact axonemes (Bui et al., 2009; Heuser et al., 2009). Since the main interaction between PFs involves loop regions of the tubulin monomers, it has been assumed that the change in curvature is accommodated by changes in these loops. In principle, the loops could also provide some degree of lateral shear. The shear seems to be limited to something on the order of 1 Å under normal conditions (Chretien et al., 1998). On the other hand, observation of a length dependence of MT flexibility has been interpreted to indicate that, for small displacements, the shear resistance is up to six order of magnitude lower than the compressibility of the protein (Pampaloni and Florin, 2008). Perhaps the most compelling evidence for the ability of the inter-PF interaction to allow shear is the observation of a shift of approximately 6 Å between the PFs in zinc-induced crystals and macrotubes (Wolf et al., 1993).
Another factor that could affect mechanical properties of MTs is the seam in some types of MTs. The seam arises because MTs with an odd start number assemble so as to produce a discontinuity, where the true heterodimer helical lattice is interrupted and lateral interactions occur between neighboring α- and β-tubulin monomers (Mandelkow et al., 1986; McEwen and Edelstein, 1980). In the helical structures of 2-start or 4-start MTs, lateral interactions only occur between two neighboring α-tubulins or two β-tubulins from adjacent PFs. For the 3-start MTs, the seam has often been assumed to be relatively unstable, i.e. a candidate region for where disassembly of MTs originates and assembly completes (Chretien et al., 1995; Mandelkow et al., 1986; Simon and Salmon, 1990; Wang and Nogales, 2005). However, there is little direct experimental evidence to support that assumption. Thus, the seam's impact on MT mechanical properties remains unclear.
In order to better understand the structural basis of the lateral deformability and mechanical properties of MTs, we have obtained relatively high-resolution maps for MTs containing 11-16 PFs. Pseudo-atomic models of these structures derived from the density maps have revealed important details about inter-PF interactions. In particular, these interactions are highly conserved through a wide range of lateral curvatures. The results provide insights into the mechanical properties and deformation mechanisms of MTs. Our structural analysis indicates that the seam region should have little impact on inter-PF interactions, and thereby mechanical properties of MTs.
Results
Structural type distribution of polymerized microtubules
Purified tubulin protein in PIPES buffer was polymerized with or without 20% DMSO, followed by addition of Taxol or Taxotere (paclitaxel or docetaxel respectively) to stabilize the MTs. Frozen-hydrated samples were prepared within 1 h of polymerization and examined by cryo-EM. Figure 1a displays the typical morphology of the samples imaged at high defocus. For both polymerization conditions, the samples were mixtures of MTs with various diameters.
Figure 1.
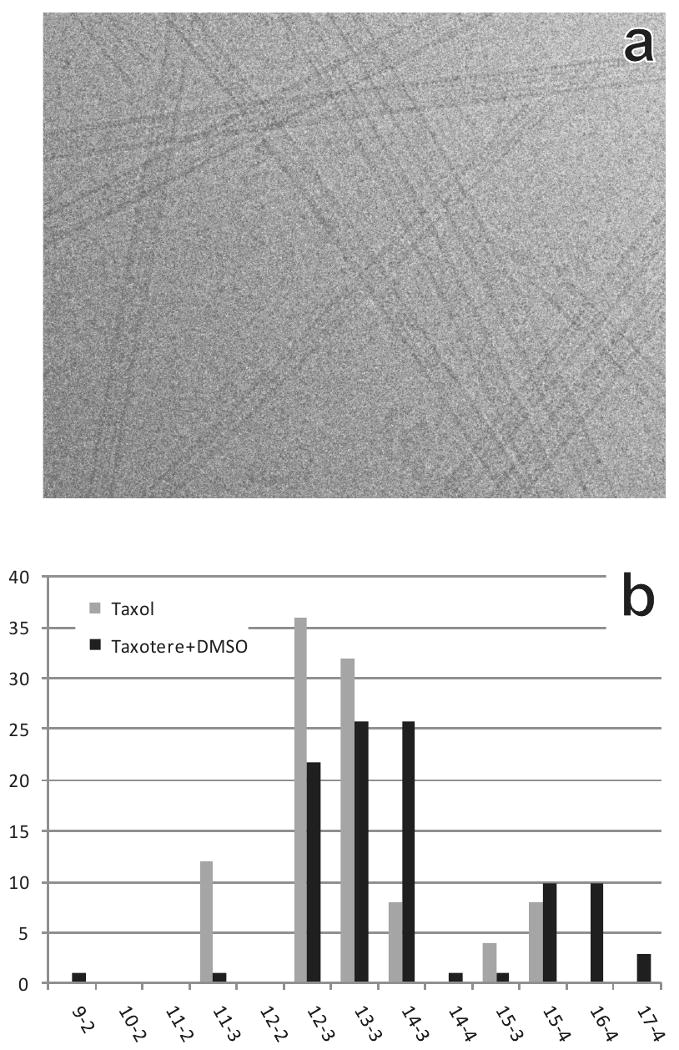
Microtubule mixtures of various structural types: (a) Typical morphology of frozen hydrated MTs obtained by polymerization of purified tubulin. A high defocus (∼ -7μm) was used in this picture to enhance the contrast for visualization. Diameter differences are obvious, demonstrating that the polymerized MTs are a mixture of multiple structural types. (b) Distribution of structural types for MTs polymerized with added Taxol (grey bars), or with 20% DMSO and added Taxotere (black bars).
The structural difference between α- and β-tubulin is minor and is essentially invisible at resolutions ∼8 Å, typical for structural studies by cryo-EM. Thus, plain MTs can be treated as true helical objects at moderate resolution where the difference between α and β tubulin can be ignored. This approximation has been used in a previous structural study which revealed details of secondary structure of the 13-PF MT and allowed precise docking of the tubulin crystal structure into the density map (Li et al., 2002). We followed the general strategy of (Li et al., 2002) for processing the images and generating 3-D reconstructions. In order to obtain relatively high resolution maps, low defocus values (0.6 - 2.8 μm) were used for data collection. As reported in early studies, Moiré patterns, produced by superposition of PFs from the top and bottom of MTs, are easily visible at high defocus and have often been used for visual identification of MT types (Chretien and Wade, 1991). However, Moiré patterns are not sufficiently clear for identifying MT types in the images at low defocus without the use of Fourier filtering. Therefore, we developed a reference-based classification strategy in which data from each MT were compared against an initial set of projections from reference models of the possible structural types, based on theoretical calculations (Chretien and Wade, 1991). Each raw MT image was boxed into a series of segments, which were then processed as a group within the data set. When most of the images in a given group were classified to one structural type, all of the images in this group were assigned to that type. This strategy proved to be successful for selection of good MT images and identification of the helical lattice type.
Figure 1b shows the structural type distributions for MTs polymerized under the two conditions used in this work. Previous work has shown that Taxol and Taxotere affect the PF number differently (Andreu et al., 1994). Taxol stabilization in the absence of DMSO promotes the formation of MTs with smaller PF numbers, and we found about equal numbers of 12-3 and 13-3 MTs. An additional 10% were 11-3. Taxotere plus DMSO promotes formation of MTs with higher PF numbers, producing comparable numbers of 12-3, 13-3, and 14-3 MTs, along with about 10% each for 15-4 and 16-4.
Theoretical calculations suggested the most energetically favorable start numbers for MTs with various PF numbers (Chretien and Wade, 1991). The prediction has been shown to match very well for MTs with 10, 13, 14, and 16 PFs (Chretien and Wade, 1991; Hirose et al., 1997; Hirose et al., 1995; Kikkawa et al., 1995; Lanzavecchia et al., 1994), and our results are compatible with the earlier results. For the 15-PF MTs, the predicted distortions were about equal for the 3- and 4-start lattices, suggesting that similar numbers of the two types should be expected. Experimental data, though, have suggested a preference for the 15-4 structural type (Lanzavecchia et al., 1994; Sosa et al., 1997; Sosa and Milligan, 1996). For MTs with 11 or 12 PFs, it had been unclear what the most common structural types are in vitro. Our study shows that MTs of 11, 12, 13, and 14 PFs all favor 3-start helical types. Microtubules of 15 and 16 PFs display mainly 4-start type structures. A few 14-4 and 15-3 structures were found (Fig. 1b), but their populations were too small to generate reconstructions of good quality.
Structures of microtubules with different PF numbers
After supervised classification, for each structural type of MT we applied the iterative helical real space reconstruction strategy (IHRSR), to refine their symmetry parameters (Egelman, 2007). The refinement started with parameters based on the theoretical prediction (Chretien and Wade, 1991; Wade and Chretien, 1993). The refined symmetry parameters agreed very well with the predictions (see Table 1).
Table 1. Parameters for the microtubule maps of various types computed in this study.
| Structural type | Symmetry parameters from IHRSR refinement | Resolution (Å) corresponding to FSC=0.5 | Resolution cutoff applied to final map (Å) | ||
|---|---|---|---|---|---|
| Rotation(°) | Z-rise(Å) | Before symmetrization | After symmetrization | ||
| 11-3 | -32.47 | 11.08 | 22.2 | 14.8 | 10 |
| 12-3 | -29.88 | 10.16 | 16.7 | 9.3 | 8 |
| 13-3 | -27.69 | 9.39 | 16.0 | 9.8 | 8 |
| 14-3 | -25.77 | 8.72 | 15.3 | 9.3 | 8 |
| 15-4 | -23.83 | 10.81 | 11.1 | 8.9 | 8 |
| 16-4 | -22.40 | 10.18 | 17.4 | 10.5 | 10 |
Summation of power spectra of the extracted image boxes showed layer-lines extending to 10Å and beyond, indicating the density maps should reveal structural information beyond that resolution. To estimate the resolution of the final maps, we calculated Fourier shell correlations (FSC), and the results, at FSC=0.5, are listed in Table 1. After symmetry enforcement, the FSC indicates resolution between 9Å and 10Å in all of the maps, except for MT 11-3 and MT 16-4 which had nominal values of 14.8Å and 10.5Å, respectively. However, we noted that the quality of the MT 11-3 map is significantly better than that of MT 16-4, suggesting that the FSC=0.5 criterion is not the optimal resolution criterion for this study. Therefore, we used resolution cutoff of either 8 or 10Å for the final density maps, as listed in Table 1. In all the resultant density maps, secondary-structural features have been clearly resolved (Fig. 2 and 3).
Figure 2.
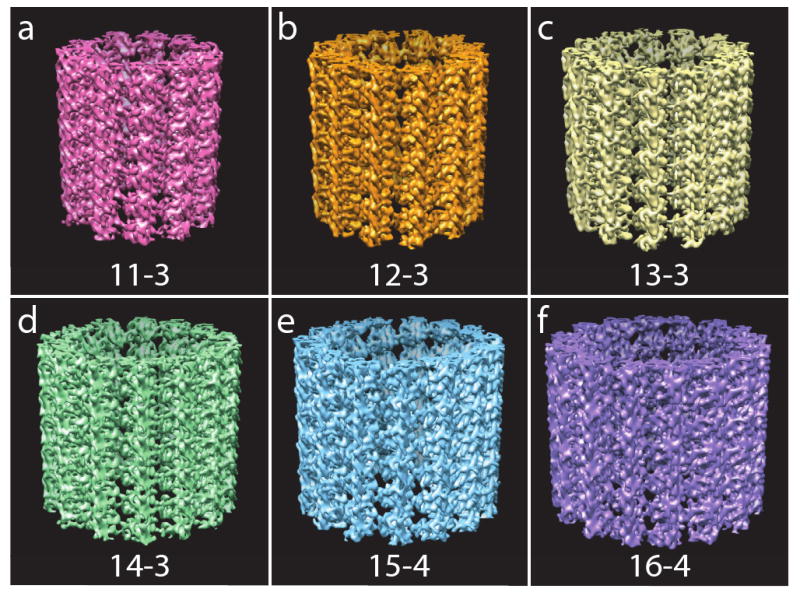
Density maps for different structural types of MTs: (a) MT 11-3 (b) MT 12-3 (c) MT 13-3 (d) MT 14-3 (e) MT 15-4 (f) MT 16-4. The secondary structural features are clearly resolved in the density maps. MT 13-3 has perfectly straight PFs (Fig 2c). In contrast, super-twists exist for other types of MTs. For MT 11-3, 12-3, 15-4, and 16-4, the density maps display a minor right-handed supertwist (Fig 2a - 2c, and 2e - 2f). For MT 14-3, the density map shows a slight left-handed supertwist (Fig 2d).
Figure 3.
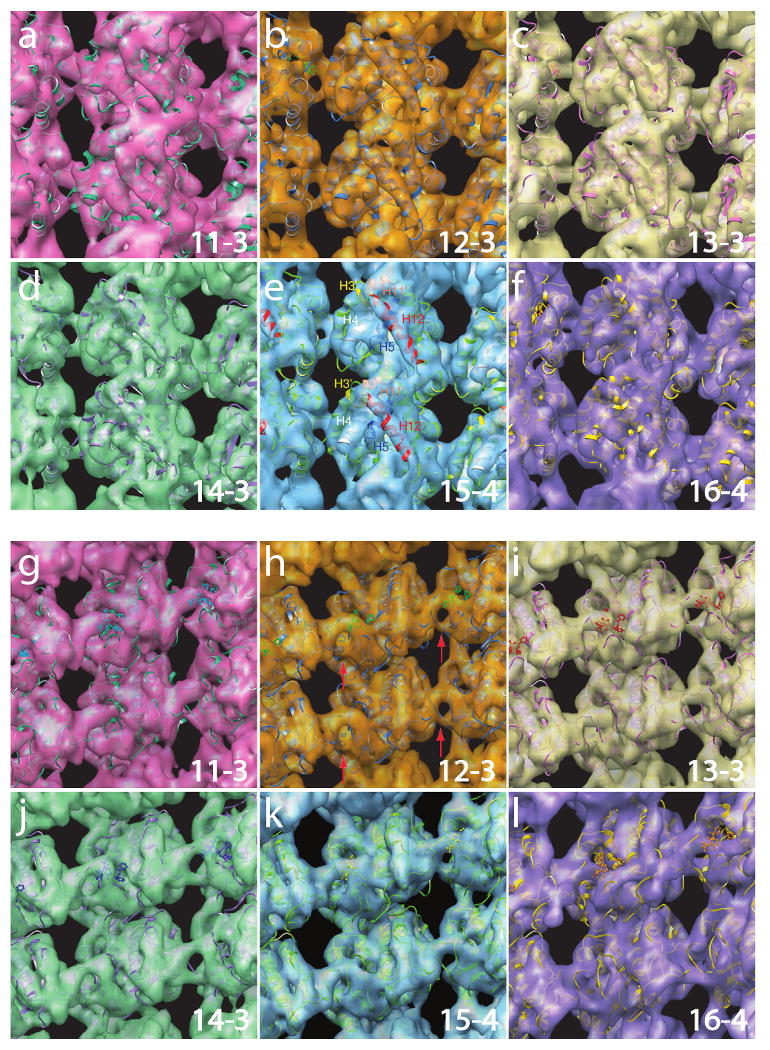
Pseudo-atomic structural models docked into density maps. Panels (a) - (f) show external views of the structures for MT 11-3, MT 12-3, MT 13-3, MT 14-3, MT 15-4, and MT 16-4, respectively. Helices H12, H11′ and H3′ are marked in (e). Panels (g) - (l) show the same structures as in the (a) - (f), but from the lumen side. Density features in the inter-PF regions are consistent across the six structures, indicating a structural conservation of interactions. A ring-shaped density feature for the inter-PF interaction is indicated by red arrows in (h). A homology model of the missing H1′-S2 loop has been included in the fitting for α-tubulin.
The density map of MT 13-3 displays straight PFs with no supertwist (Fig. 2c). For most of the other MTs structures, the resultant density maps display a right-handed supertwist (MT 11-3, 12-3, 15-4, 16-4), while that for MT 14-3 shows a left-handed supertwist. These results agree with the theoretical predictions very well (Chretien and Wade, 1991). The supertwists introduce only very slight deviation from straightness of the PFs, just discernable for the relatively short lengths of the MTs that are shown in Figure 2. In contrast, the change in angle between PFs, reflected in the decrease of the lateral curvature from MT 11-3 to MT 16-4 is obvious in the end-on views. Figure 4a shows a comparison of the end-on views of 5 PFs extracted from the density maps of MT 11-3 and MT 16-4.
Figure 4.
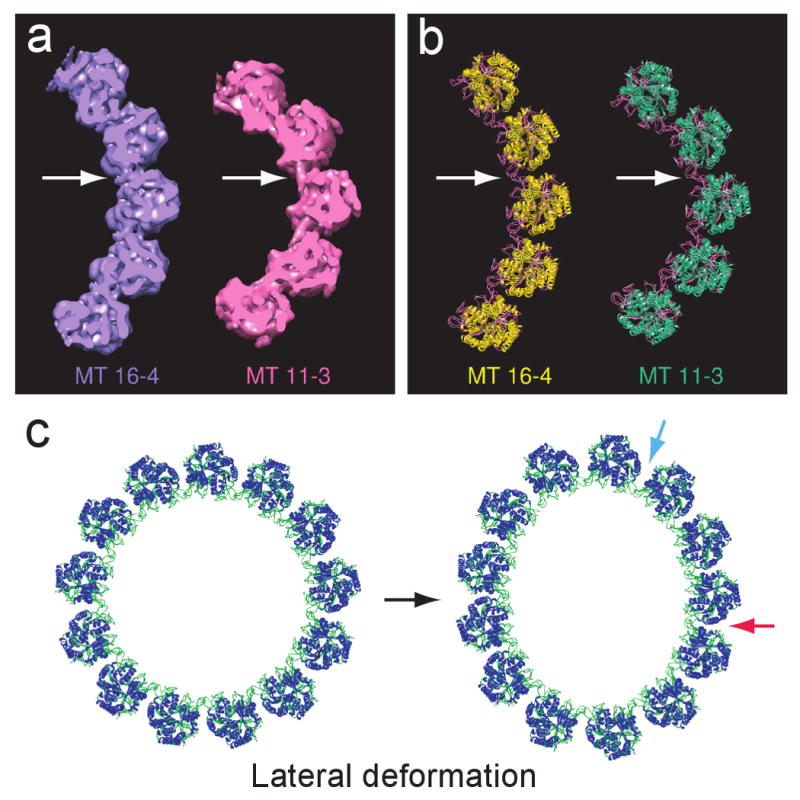
End-on views of the MT density maps and the structural model of MT lateral deformation (see also Movie S1). Panels (a) and (b) show significant difference in lateral curvature for the extreme pairs of our structural maps and models, MT 16-4 and MT 11-3. Arrows point to lateral connection region in (a) the density maps and (b) the structural models; here, loops belonging to adjacent tubulin molecules in the neighboring PFs appear to mediate the inter-PF interaction. (c) Model for 8% deformation of the 13-3 MT, a degree of deformation that has been found experimentally in the A-tubule of MT doublets. The red arrow indicates a closely packed region in which lateral curvature is decreased; the blue arrow indicates a loosely packed region with a high lateral curvature.
With secondary-structural features well resolved in each of the reconstructions, we were able to precisely dock the tubulin crystal structure into the density maps, to generate pseudo-atomic models for each of the MT types (Fig. 3). The structure of the tubulin dimer obtained by electron crystallography (PDB ID: 1JFF) is missing residues 35 to 60 in α-tubulin. A homology model was generated for the missing region (see Methods). Docking was carried out with the rigid body fitting function in Chimera (Goddard et al., 2007; Pettersen et al., 2004).
Most of the interaction between PFs on one side of the tubulin dimer involves the M-loop, which connects beta strand S7 and helix H9, in both α- and β-tubulins. In each of the maps it was evident that some adjustment of this loop was necessary to optimize the fit of the crystal structure into the density map, as had been noted previously (Li et al., 2002). Both loops were moved slightly (3.3Å and 0.5Å respectively) towards the minus end to match the density map, followed by local geometric refinement using Coot (Emsley and Cowtan, 2004). As shown in Figure 3 (panels a - l), the resultant structure fits into all of the density maps very well.
When the models are viewed from the external side of the MT, the orientation of the tubulin molecules is very consistent, producing essentially identical external surfaces featuring H12, H11′, H3′, and H4 and the end of H5 (as marked in Fig. 3e). This region is where motor proteins and other MAPs bind to MTs (Al-Bassam et al., 2002; Hirose et al., 2006; Kikkawa and Hirokawa, 2006; Mizuno et al., 2004; Sindelar and Downing, 2007).
Conservation of loop-loop interaction under various lateral curvatures
On the lumenal side of the MTs (Fig. 3g - l), all of the resultant structural maps reveal a very consistent density feature connecting between the neighboring PFs, indicateing a lateral interaction that is highly conserved among all six structural types, despite the differing lateral curvatures. The connecting density feature shows a distinctive ring shape (Fig. 3g - l) on the lumenal side (marked by arrows in Fig. 3h and in the end-on view in Fig 4a at the corresponding regions). This feature appears to be the major connection to the neighboring PFs.
Docking of the tubulin structure into the density maps revealed that the ring-shaped connecting density features derive mainly from the M-loops (marked in Fig. 5a, i.e. at the periphery of the tubulin monomers), which comprise residues Tyr-272 to Ser-287 in α-tubulin, and residues Phe-272 to Val-288 in β-tubulin. Our results confirm that the M-loops participate in inter-PF interaction as was reported in previous structural studies on MT 13-3 (Li et al., 2002; Nogales et al., 1999). Our density maps also more clearly reveal additional sites of interaction in the region of the PF adjacent to the M loops. Toward the neighboring PF, the connecting density of the M loop branches and runs into both the densities of the H1′-S2 loop and the H2-S3 loop (see Fig. 5a). The H1′-S2 loop is composed of residues Phe-53 to Arg-64 in α-tubulin, and Tyr-53 to Arg-64 in β-tubulin. The H2-S3 loop is composed of residues Gly-81 to Gln-91 in α-tubulin, and Gly-81 to Asn-91 in β-tubulin. In β-tubulin, part of the H2-S3 loop forms local helical domains (helices H2′ and H2″).
Figure 5.

The structure of inter-PF interactions. (a) The M loop (marked in magenta) of one tubulin molecule interacts with both the H1′-S2 loop (in yellow) and the H2-S3 loop (in red) of the adjacent tubulin molecule in the neighboring PF. The densities of the H1-H1′ loops (in green) merge into the densities of for H1′-S2 loop and the H2-S3, and contribute to stabilizing the H1′-S2 and H2-S3 loops. In the neighboring α-tubulin molecules, the densities from the end of the helix H6 (in white) and the S9-S10 loop (in orange) run into the ring-shaped density of the M loop, and may stabilize the latter. In the β-tubulin molecule, Taxol occupies the pocket between M-loop, S9-S10 loop, H6, and H7, and may push the M loop out to extend further towards the H1′-S2 and H2-S3 loops in the neighboring PF. (b) In the region of perfect helical lattice, the α-α interaction provides an environment of salt bridges between Lys 280 and Glu 90, and between His 283 and Glu 55. The β-β interaction offers an environment conducive for a salt bridge between Arg 284 and Glu 55. The interaction between the M loop and the H2-S3 loop involves segment Ser-Gln-Gln from the M loop and segment Arg-Pro-Asp from the H2-S3 loop.(c) At the seam, the β-α interaction is very similar to that of α-α interaction in the perfect lattice region, and provides a environment for salt bridges Lys 280 - Asp 90 and His 283 - Glu 55. The α-β interaction resembles that of β-β in the perfect lattice region, with salt-bridge-forming residues Arg 284 and Glu 55 very close to one another. The interaction between the M loop and the H2-S3 loop involves segments His-Pro-Glu from the M loop and Ser-Gln-Gln from the H2-S3 loop. The His-Pro-Glu at the seam and the Arg-Pro-Asp in the perfect lattice region are highly conserved and have very similar properties.
Inter-PF interactions in the regions with perfect helical lattice and at the seam
While the above-described loop interactions provide a mechanism for easy lateral deformation, they must nevertheless be strong enough to confer the high rigidity and resilience that have been measured in biophysical experiments (Felgner et al., 1996; Gittes et al., 1993; Kurachi et al., 1995; Schaap et al., 2006; Venier et al., 1994). To obtain insights into these contrasting properties, we studied molecular details of inter-PF interactions in our structural models. We identified a number of candidate residues that may form salt bridges and contribute to stable inter-PF interactions.
Interaction between the M loop, H1′ -S2 loop, and helix H3 were originally proposed to be responsible for inter-PF interaction (Nogales et al., 1999). However, from a higher resolution structural map of MT 13-3, it became clear that helix H3 does not play a significant role in the interaction (Li et al., 2002). Our current results further demonstrate that lateral inter-PF interactions involving the M loops and H1′-S2 and H2-S3 loops are the major contacts in MTs with a range of PF angles.
Although side chains are not resolved in our density maps, the docked atomic structures provide sufficient definition of the location and the local environment of the peptides that we can gain some insight into inter-PF interactions.
α-α and β-β interactions in the regions with perfect helical lattice
In the regions with perfect helical lattice, the closest contact between two neighboring α-tubulin molecules is near Lys 280 (marked in red in Fig. 5b) on the M loop between H7 and S9, and Glu-90 (marked in yellow in Fig. 5b) which approaches from the H2-S3 loop of the neighboring α-tubulin. These two residues may form a salt bridge and thus provide a stable interaction between the neighboring α-tubulin molecules. Also, in a possible second salt bridge, His-283 and the conserved Glu-55 appear to participate in an interaction between the M loop and the H1′-S2 loop. These two connections account for branching of the density between the neighboring α-tubulins.
Between two neighboring β-tubulins, the M loop is closest to the H1′-S2 loop at Arg-284, which approaches Glu-55 on the H1′-S2 loop of the other β-tubulin of the pair. It provides a good environment for a stable salt bridge interaction. In fact, Arg-284 and Glu-55 have been found to form a stable salt bridge in a recent molecular dynamics simulation with Taxol present (Mitra and Sept, 2008). Interaction between the H2-S3 loop and the M loop occurs where Pro-89 induces a turn in the chain between Arg-88 and Asp-90 on the H2-S3 loop. Across from it, on the M loop, are Ser-280, Gln-281, and Gln-282 (marked in orange in Fig. 5b). This environment provides the possibility of formation of a hydrogen bond network.
β-α and α-β interactions at the seam
At the seam, our pseudo-atomic structural models for the density maps of MT 11-3, 12-3, 13-3, and 14-3 display interactions that are surprisingly similar to those in the perfect lattice region.
As shown in Figure 5c, the β-α interaction closely resembles the α-α interaction. Glu-55 is conserved between α- and β-tubulins. Asp-90 in α-tubulin and Glu-90 in β-tubulin are both negatively charged residues. The molecular architecture at the seam therefore provides an environment conducive to the formation of a pair of salt bridges between His-283 and Glu-55, and Lys-280 and Asp-90, corresponding to those of the α-α interaction at the perfect lattice region.
Similarly, the α-β interaction is analogous to the β-β interaction at the perfect lattice region. First of all, between the M loop and the H1′-S2 loop, Arg-284 and Glu-55 may form a stable salt bridge. Between the M loop and the H2-S3 loop, the three residue group of His-88-Pro-89-Glu-90 in α is almost identical to the residue group Arg-88-Pro-89-Asp-90 in β of the perfect lattice region, suggesting that the same or a similar kind of interaction exists.
Other loop interactions
Besides the contribution of the stable salt bridges within the connecting loops to the strength of the inter-PF interactions, the arrangement of the neighboring loops may provide a stabilizing architecture to enhance the connection. As shown in Fig. 5a, the densities of the H1′-S2 loop and the H2-S3 loop are supported by density from the H1-H1′ loops (for both α- and β-tubulins). Next to the M loop at the right side in α-tubulin, the connecting density branches out into the end of helix H6 and the S9-S10 loop (residues Asn-356 to Gln-372). It appears that the end of H6 and the S9-S10 loop together stabilize the M-loop. In our structural model, this region is surrounded by three negatively charged residues, Glu-279, Asp-218 and Asp-367, that could potentially form an interaction network around a trapped, positively charged ion, such as Mg2+. In the corresponding region of β-tubulin, the density is accounted for by the end of H6 and a Taxol molecule.
Additional interaction site for MTs with high numbers of PFs
As the number of component PFs increases, decreases in lateral curvature must eventually result in close contact between two neighboring tubulin molecules at a radius outside the interacting loops. The development of an additional contact between neighboring PFs is observed in our density map of MT 16-4 (Fig. 4a). Docking of the atomic structure revealed that the density arises mainly from helix H3 on one side and the end of helix H9 of the other. It is noteworthy that this density connects in the region near the salt-bridge-forming residues Lys-124 and Glu-290, which are conserved between α- and β-tubulin.
Discussion
It is not surprising that most of the accommodation of variation in lateral curvature of the MT wall occurs in the loop region, where the M, H1′-H2, and H2-S3 loops interact and connect neighboring PFs. However, the consistency of the density characteristics in this region, along with the lack of detectable changes within the core of the tubulin molecules, are remarkable features of our set of reconstructions. The inter-PF interaction involving the connecting loops on adjacent PFs (Fig. 4a-b) is conserved across six structural types and apparently provides enough flexibility to allow a fairly wide range of angles between PFs. It is well known that polymerization of purified tubulin protein always produces a mixture of multiple structural types with different PF numbers and lateral curvatures. Apparently, environmental fluctuations are sufficient to cause variation in structural type and lateral curvature. The ease with which the MTs adapt to different lateral curvatures corresponds to the experimentally measured low resistance to lateral deformation. This property may be limited to MTs with moderate numbers of PFs, i.e., around 13, given the finite limits on lateral curvature (Fig. 4c, see also the morph movie of the structural models in the supplemental materials: Movie S1).
Taxol has been proposed to stabilize MTs by promoting a conformation of the M loop that favors the inter-PF interaction as the drug molecule occupies the pocket between the M-loop, the S9-S10 loop, and helices H6 and H7 (Nogales et al., 1999). It may be that Taxol pushes the M loop out to extend further towards the neighboring PF, which would actually enhance its flexibility. Conflicting results have been reported concerning the effect of Taxol on the rigidity of MTs (Dye et al., 1993; Felgner et al., 1996; Gittes et al., 1993; Kurachi et al., 1995; Mickey and Howard, 1995; Venier et al., 1994). The current consensus is that Taxol increases MT flexibility, which would be in line with an increased flexibility of the M-loop.
Since the loops of the inter-PF interactions and their supporting structures are positioned toward the lumenal side of the MT, binding of inner-MT associated proteins (iMAPs) to the lumen side wall of MTs could have substantial effects on the local interactions between neighboring PFs. In the complete tubule of MT doublets isolated from sea urchin sperm flagella, iMAPs were found to run across PFs on the lumenal side (Downing and Sui, 2007; Sui and Downing, 2006). Their binding pattern showed some resemblance to that proposed for the MAP tau when it is co-polymerized with tubulin (Kar et al., 2003). These iMAPs were proposed to stabilize the MT structure so as to allow bending as the active beating motion of flagella occurs. Binding of these iMAPs to the lumen side may also contribute to the lateral deformation of MTs seen in the doublet structure.
The ability to respond to stress by lateral deformation is surely an important property of MTs that allows them to maintain structural integrity. For example, the ability to bend is important in MTs' function as major cytoskeleton components, as MTs are often subjected to sharp bending or buckling in live cells. In a recent study of MT curvature in LLC-PK1 cells, MT bending driven by associated motor proteins was seen to reach a high curvature, over 3μm-1 (Bicek et al., 2009). It is difficult to imagine such a high degree of bending in the absence of some component of lateral deformation. Clearly, though, the structure has a resistance to complete flattening that would allow formation of a sharp kink. Static deformation is also found in some MTs, particularly in flagella and cilia. In eukaryotic flagella/cilia, MTs exist mainly in the doublet form and are subject to various bending motions through the beating cycle. In our recent study of sea urchin doublets by cryo-electron tomography, the A-tubule displayed lateral deformation of about 8% giving rise to an oval cross section, while singlet MTs retained their cylindrical shape in the same tomogram (Sui and Downing, 2006). Figure 4c shows our structural model of the 13-3 MT, after application of an 8% deformation as in the MT doublet. Within the A-tubule, the angle between PFs varied within the range typically seen for 10-PF through to 17-PF MTs. Apparently, loop-loop interaction provide the flexibility required to accommodate lateral curvature changes and may contribute significantly to the bending response of MTs.
As discussed above, lateral deformation, while an intrinsic property of MTs, is limited by geometric constraints of the tubulin molecules. A decrease in curvature will bring the neighboring tubulin molecules closer at high radius (as indicated by the red arrow in Fig. 4c). Decrease in curvature beyond the point where neighboring tubulin molecules encounter one another would impose stress on the loop interactions that could result in disruption of the MT structure. An indentation measurement on MTs in vitro reported an elastic lateral deformation of about 15% before the MT broke (de Pablo et al., 2003; Schaap et al., 2006). That deformation limit is twice the intrinsic deformation that we found in the doublet MT (Fig. 4c). If uniformly distributed, it would result in inter-PF angles corresponding to those in MTs with between 8 and 21 PFs.
As lateral curvature further decreases, contacts between neighboring tubulin molecules could increase the stress at the loop-loop interaction region. In the extreme, the loop-loop interaction would be disrupted, resulting in a collapse of inter-PF interaction, as observed in the indentation experiments. Also with decreasing lateral curvature, other types of inter-PF interaction could arise between neighboring PFs. Some interaction has been observed in the 16-PF MTs in this study. How the MT structure adapts to accommodate larger numbers of PFs, up to 20, found in accessory MTs of spermatozoa in several insect species (Dallai et al., 2006), remains to be investigated.
Our structural models indicate a similar architecture for inter-PF interactions at the seam and the region of perfect helical lattice. We also compared our density map and structural model of MT 13-3 with the MT-kinesin density map published recently (EMDB ID code: EMD-1340) (Sindelar and Downing, 2007), as well as several improved maps (Sindelar and Downing, 2010). In the MT-kinesin maps, α- and β-tubulins are clearly discriminated, so we can examine any differences that exist between the α-α and β-β interactions. At the resolution of those studies, i.e. about 8 Å, the densities in the regions of α-α and the β-β interaction of the kinesin-decorated MTs are indistinguishable and match the density seen in the present work. Our structure model and density maps match very well with the MT-kinesin map at the seam region and in the region of perfect helical lattice (Supplemental Material: Figure S1), providing additional support to our conclusions.
Conclusion
Density maps of multiple structural types of MTs have been obtained at a resolution sufficient that we can clearly visualize secondary-structural features. These maps have enabled us to build pseudo-atomic models for MTs 11-3, 12-3, 13-3, 14-3, 15-4, and 16-4. Analysis of the density maps and the structural models has provided insights on inter-PF interactions under various lateral curvatures. Low resistance to lateral deformation is an intrinsic property of MTs that is essential for maintenance of structural integrity during bending or buckling. The inter-PF interactions arise mainly between the M loops of tubulin molecules in one PF and the H1′-S2 and H2-S3 loops of tubulin molecules in the neighboring PF, and they provide flexibility to accommodate lateral deformation. Meanwhile, strong inter-PF interactions are supported or stabilized by local architecture at the lumen side that may contribute to the overall rigidity of MTs. Microtubules have an elegant architecture that confers both the rigidity and flexibility that are essential to the astonishingly diverse MT functions in cells and organelles. Binding of iMAPs or ligands on the lumenal side of the MTs may directly modulate the inter-PF interactions and their stabilizing structures, thereby modifying the mechanical properties of the MT. Inter-PF interactions at the seam are very similar to those in the regions of perfect helical lattice, suggesting that the existence of the seam, when present, is not a significant factor in determining the mechanical properties of MTs.
Experimental Procedures
Microtubule polymerization
Polymerization was carried out under two experimental conditions, using purified bovine brain tubulin (Cytoskeleton, Inc). (1) Taxol condition. Frozen tubulin with a concentration of 10 mg/ml in PEM buffer (80 mM PIPES, pH 6.8, 1 mM EGTA, 1 mM MgCl2, and 1 mM GTP) was thawed on ice and centrifuged at 4°C at 355,000 g (100,000 rpm; Beckman Coulter TLA 120.2 rotor), to remove any precipitate. GTP was then added to the supernatant to a final concentration of 1 mM, and the mixture was incubated at 37 °C for 20 min. 200 μM Taxol (paclitaxel; Sigma) in Low-PEM buffer (25mM PIPES pH 6.8, 25mM NaCl, 1mM EGTA, 2mM MgCl2) was prepared during incubation and then added to the sample to a final concentration of 60 μM, along with 3% DMSO from the original Taxol stock. After an additional 15 min incubation at 37°C, the sample was placed on top of 60% glycerol in Low-PEM buffer and centrifuged for 20 min at 89,000 g (50,000 rpm; TLA 120.2 rotor). The resulting MT pellet was washed two times and resuspended in 10 μl Low PEM buffer for TEM specimen preparation. (2) DMSO and Taxotere condition. The polymerization process was the same as that for Taxol condition described above, except that 20% DMSO was added to the supernatant together with 1 mM GTP before it was incubated at 37 °C, and Taxotere (docetaxel, Sigma) was used as the stabilizing agent instead of Taxol.
Electron Microscopy
TEM specimens were prepared with copper grids covered by in-house prepared holey carbon films, which were made as replicas of 2 μm Nucleopore filters (Whatman/Schleicher & Schuell), using Victawet (E. F. Fullam) as a parting layer. The sample solutions prepared as described above were applied to glow-discharged grids, which were briefly blotted with #1 filter paper (Whatman) at the edge and then plunged into liquid ethane cooled by liquid nitrogen.
Frozen hydrated specimens were examined with a JEOL-4000 microscope operating at 400kV and 60,000 magnification. About 550 micrographs were recorded on Kodak SO-163 film with defocus ranging from -0.6 to -2.8μm. The micrographs were digitized with a customized robotic scanning system that uses a Nikon Coolpix 8000 scanner (Typke et al., 2005). The final pixel size of the digitized images was about 1.05Å.
Image analysis
In general, the image processing followed a single-particle strategy, using customized scripts written in the SPIDER package (Frank et al., 1996). Image boxes, each containing about 10 dimer repeats, were extracted along MTs in the digitized micrographs. Boxes from each MT were treated as a group and processed as described previously (Li et al., 2002), with some modifications as detailed in the main text. The power spectra of selected image boxes show the second layer-line corresponding to 20 Å. The best images show layer-lines extending to 10Å in power spectra averaged from aligned image boxes of a single MT. The layer-lines corresponding to 80 Å repeats were not visible which indicates that there is no detectable structural difference between the α- and β-monomers in these plain MTs at the resolution of experiment. Ignoring the difference between α- and β-tubulin, we treated the MTs as helical objects. As described below, all extracted images were aligned parallel to a box edge, using the strategy described by Li et al. (2002), and then subjected to supervised classification. For each structural type, the iterative helical real space reconstruction strategy (IHRSR), was applied to refine the symmetry parameters and reconstruct density maps (Egelman, 2007).
Image extraction
For each MT, the coordinate pairs denoting its head and tail were marked out manually and saved in a document file. These coordinates were used to calculate the rough orientations of the MTs. Coordinates of image box centers along each MT were also calculated, for image extraction. Coordinate and orientation parameters were updated after each step of image processing.
In-plane rotation alignment
The extracted images were aligned following the methodology described by Li et al. (2002). In brief, a Radon transform of the power spectrum was computed for each image box. The peak position in the sinogram provided the in-plane rotational angle by which the MT segments would become precisely aligned with the box edge. Before this strategy was applied to experimental data, MT models with different number of PFs (PFs 10-17) were used to test whether it would work with the full range of MT types. The results confirmed that the supertwist that is seen for all but the 13-PF MTs did not introduce any problems.
Supervised classification based on multiple model volumes
Classification of images into different structural types was carried out with a supervised classification strategy. Microtubule models for classification were generated from an electron-crystallographic structure of tubulin dimer (PDB ID: 1JFF, (Lowe et al., 2001)) and the theoretically predicted symmetry parameters (Chretien and Wade, 1991). To avoid bias, the model maps used for supervised classification were filtered to a resolution of 36Å. Structural models of the following types of MTs were used for supervised classification, MT 9-2, 10-2, 11-2, 11-3, 12-2, 12-3, 13-3, 14-3, 14-4, 15-3, 15-4, 16-4, 17-4. Projections of these volumes were then calculated at 0.5° intervals around the MT axis, including up to ±15° out-of plane tilt. Extracted images from a given MT were processed as a group. The PF number, polarity, and start number of the MT were analyzed sequentially. For each round of classification, the class of that group of images is identified and accepted for further processing only when the majority of the images (70%) fell into a certain class.
Refinement of symmetry parameters
In order to determine the symmetry parameters for each type of MTs, we applied the iterative helical real space reconstruction (IHRSR) strategy (Egelman, 2007) with some modifications, to the selected images of each MT type. In brief, for each structural type, the reference model volume (filtered to resolution of 36 Å) was used only one time as the initial model. Selected images of each type of MT were aligned against the projections of the reference model volume. 3D data volumes were generated using aligned images; these then served as the reference for the next cycle of iteration. IHRSR was first performed for binned images with a pixel size of 8Å. When refinement of the symmetry parameters stabilized (normally within 10 cycles), images with pixel size of 4Å and then 2Å were used for further IHRSR refinement. The final 3D volume for each structural type was obtained by weighted back projection following (Sindelar and Downing, 2007; Yonekura and Toyoshima, 2000). Symmetrization was imposed followed by Fourier amplitude compensation at high resolution.
Pseudo-atomic model building
The structure of the tubulin dimer obtained by electron crystallography (PDB ID: 1JFF) (Lowe et al., 2001) is missing residues 35 to 60 in α-tubulin. A homology model was generated for the missing region, using the assumptions that the lowest energy structures are similar between the α- and β-monomers for this region, and that the region in α-tubulin is more flexible than in β-tubulin (N. Banavali, personal communication, 2009). The tubulin dimer structure was fitted into the density maps using the rigid body fitting function in Chimera (Goddard et al., 2007; Pettersen et al., 2004). To match the density maps, the M-loop were moved 3.3Å and 0.5Å, respectively in α- and β-tubulin, towards the minus end of MTs, followed by local geometric refinement using Coot (Emsley and Cowtan, 2004). The pseudo-atomic models of the various types of MTs were then generated by application of a symmetry operation to the fitted structural coordinates. Figures in this paper were generated with Chimera.
Supplementary Material
Acknowledgments
We thank Dr. N. K. Banavali at the Wadsworth Center for providing the homology structural model for the H1′-S2 loop of α-tubulin, Dr. E.H. Egelman at University of Virginia for providing initial scripts of the IHRSR strategy, Dr. B. F. McEwen at the Wadsworth Center for valuable suggestions and critical reading of the manuscript, and Drs. M. Koonce, A. Khodjakov, and C. L. Rieder at the Wadsworth Center for helpful discussion and suggestions. This work was supported by NIH grant GM51487 and by the U.S. Department of Energy under Contract No. DE-AC02-05CH11231.
The density maps have been deposited in EMDB, http://emsearch.rutgers.edu, with accession codes EMD-5191 to EMD-5196.
Footnotes
Publisher's Disclaimer: This is a PDF file of an unedited manuscript that has been accepted for publication. As a service to our customers we are providing this early version of the manuscript. The manuscript will undergo copyediting, typesetting, and review of the resulting proof before it is published in its final citable form. Please note that during the production process errors may be discovered which could affect the content, and all legal disclaimers that apply to the journal pertain.
References
- Al-Bassam J, Ozer RS, Safer D, Halpain S, Milligan RA. MAP2 and tau bind longitudinally along the outer ridges of microtubule protofilaments. J Cell Biol. 2002;157:1187–1196. doi: 10.1083/jcb.200201048. [DOI] [PMC free article] [PubMed] [Google Scholar]
- Amos LA, Amos WB. The bending of sliding microtubules imaged by confocal light microscopy and negative stain electron microscopy. J Cell Sci Suppl. 1991;14:95–101. doi: 10.1242/jcs.1991.supplement_14.20. [DOI] [PMC free article] [PubMed] [Google Scholar]
- Andreu JM, Diaz JF, Gil R, de Pereda JM, Garcia de Lacoba M, Peyrot V, Briand C, Towns-Andrews E, Bordas J. Solution structure of Taxotere-induced microtubules to 3-nm resolution. The change in protofilament number is linked to the binding of the taxol side chain. J Biol Chem. 1994;269:31785–31792. [PubMed] [Google Scholar]
- Bicek AD, Tuzel E, Demtchouk A, Uppalapati M, Hancock WO, Kroll DM, Odde DJ. Anterograde microtubule transport drives microtubule bending in LLC-PK1 epithelial cells. Mol Biol Cell. 2009;20:2943–2953. doi: 10.1091/mbc.E08-09-0909. [DOI] [PMC free article] [PubMed] [Google Scholar]
- Bohm KJ, Vater W, Fenske H, Unger E. Effect of microtubule-associated proteins on the protofilament number of microtubules assembled in vitro. Biochim Biophys Acta. 1984;800:119–126. doi: 10.1016/0304-4165(84)90049-7. [DOI] [PubMed] [Google Scholar]
- Bui KH, Sakakibara H, Movassagh T, Oiwa K, Ishikawa T. Asymmetry of inner dynein arms and inter-doublet links in Chlamydomonas flagella. J Cell Biol. 2009;186:437–446. doi: 10.1083/jcb.200903082. [DOI] [PMC free article] [PubMed] [Google Scholar]
- Chretien D, Flyvbjerg H, Fuller SD. Limited flexibility of the inter-protofilament bonds in microtubules assembled from pure tubulin. Eur Biophys J. 1998;27:490–500. doi: 10.1007/s002490050159. [DOI] [PubMed] [Google Scholar]
- Chretien D, Fuller SD, Karsenti E. Structure of growing microtubule ends: two-dimensional sheets close into tubes at variable rates. J Cell Biol. 1995;129:1311–1328. doi: 10.1083/jcb.129.5.1311. [DOI] [PMC free article] [PubMed] [Google Scholar]
- Chretien D, Wade RH. New data on the microtubule surface lattice. Biol Cell. 1991;71:161–174. doi: 10.1016/0248-4900(91)90062-r. [DOI] [PubMed] [Google Scholar]
- Dallai R, Afzelius BA. Microtubular diversity in Insect spermatozoa: results obtained with a new fixative. J Struct Biol. 1990;103:164–179. [Google Scholar]
- Dallai R, Lupetti P, Mencarelli C, Kwang WJ. Unusual axonemes of hexapod spermatozoa. Int Rev Cytol. 2006;254:45–99. doi: 10.1016/S0074-7696(06)54002-1. [DOI] [PubMed] [Google Scholar]
- de Pablo PJ, Schaap IAT, MacKintosh FC, Schmidt CF. Deformation and collapse of microtubules on the nanometer scale. Phys Rev Lett. 2003;91:0981011–0981014. doi: 10.1103/PhysRevLett.91.098101. [DOI] [PubMed] [Google Scholar]
- Downing KH, Sui H. Structural insights into microtubule doublet interactions in axonemes. Curr Opin Struct Biol. 2007;17:253–259. doi: 10.1016/j.sbi.2007.03.013. [DOI] [PubMed] [Google Scholar]
- Dye RB, Fink SP, Williams RC., Jr Taxol-induced flexibility of microtubules and its reversal by MAP-2 and Tau. J Biol Chem. 1993;268:6847–6850. [PubMed] [Google Scholar]
- Egelman EH. The iterative helical real space reconstruction method: surmounting the problems posed by real polymers. J Struct Biol. 2007;157:83–94. doi: 10.1016/j.jsb.2006.05.015. [DOI] [PubMed] [Google Scholar]
- Emsley P, Cowtan K. Coot: model-building tools for molecular graphics. Acta Crystallogr D. 2004;60:2126–2132. doi: 10.1107/S0907444904019158. [DOI] [PubMed] [Google Scholar]
- Felgner H, Frank R, Biernat J, Mandelkow EM, Mandelkow E, Ludin B, Matus A, Schliwa M. Domains of neuronal microtubule-associated proteins and flexural rigidity of microtubules. J Cell Biol. 1997;138:1067–1075. doi: 10.1083/jcb.138.5.1067. [DOI] [PMC free article] [PubMed] [Google Scholar]
- Felgner H, Frank R, Schliwa M. Flexural rigidity of microtubules measured with the use of optical tweezers. J Cell Sci. 1996;109(Pt 2):509–516. doi: 10.1242/jcs.109.2.509. [DOI] [PubMed] [Google Scholar]
- Gittes F, Mickey B, Nettleton J, Howard J. Flexural rigidity of microtubules and actin filaments measured from thermal fluctuations in shape. J Cell Biol. 1993;120:923–934. doi: 10.1083/jcb.120.4.923. [DOI] [PMC free article] [PubMed] [Google Scholar]
- Goddard TD, Huang CC, Ferrin TE. Visualizing density maps with UCSF Chimera. J Struct Biol. 2007;157:281–287. doi: 10.1016/j.jsb.2006.06.010. [DOI] [PubMed] [Google Scholar]
- Heuser T, Raytchev M, Krell J, Porter ME, Nicastro D. The dynein regulatory complex is the nexin link and a major regulatory node in cilia and flagella. J Cell Biol. 2009;187:921–933. doi: 10.1083/jcb.200908067. [DOI] [PMC free article] [PubMed] [Google Scholar]
- Hirose K, Akimaru E, Akiba T, Endow SA, Amos LA. Large conformational changes in a kinesin motor catalyzed by interaction with microtubules. Mol Cell. 2006;23:913–923. doi: 10.1016/j.molcel.2006.07.020. [DOI] [PMC free article] [PubMed] [Google Scholar]
- Hirose K, Amos WB, Lockhart A, Cross RA, Amos LA. Three-dimensional cryoelectron microscopy of 16-protofilament microtubules: structure, polarity, and interaction with motor proteins. J Struct Biol. 1997;118:140–148. doi: 10.1006/jsbi.1997.3840. [DOI] [PubMed] [Google Scholar]
- Hirose K, Lockhart A, Cross RA, Amos LA. Nucleotide-dependent angular change in kinesin motor domain bound to tubulin. Nature. 1995;376:277–279. doi: 10.1038/376277a0. [DOI] [PubMed] [Google Scholar]
- Kar S, Fan J, Smith MJ, Goedert M, Amos LA. Repeat motifs of tau bind to the insides of microtubules in the absence of taxol. EMBO J. 2003;22:70–77. doi: 10.1093/emboj/cdg001. [DOI] [PMC free article] [PubMed] [Google Scholar]
- Kasas S, Dietler G. Techniques for measuring microtubule stiffness. Curr Nanosci. 2007;3:79–96. [Google Scholar]
- Kikkawa M, Hirokawa N. High-resolution cryo-EM maps show the nucleotide binding pocket of KIF1A in open and closed conformations. EMBO J. 2006;25:4187–4194. doi: 10.1038/sj.emboj.7601299. [DOI] [PMC free article] [PubMed] [Google Scholar]
- Kikkawa M, Ishikawa T, Wakabayashi T, Hirokawa N. Three-dimensional structure of the kinesin head-microtubule complex. Nature. 1995;376:274–277. doi: 10.1038/376274a0. [DOI] [PubMed] [Google Scholar]
- Kurachi M, Hoshi M, Tashiro H. Buckling of a single microtubule by optical trapping forces: direct measurement of microtubule rigidity. Cell Motil Cytoskeleton. 1995;30:221–228. doi: 10.1002/cm.970300306. [DOI] [PubMed] [Google Scholar]
- Lanzavecchia S, Bellon PL, Dallai R, Afzelius BA. Three-dimensional reconstructions of accessory tubules observed in the sperm axonemes of two insect species. J Struct Biol. 1994;113:225–237. [Google Scholar]
- Ledbetter MC, Porter KR. Morphology of microtubules of plant cell. Science. 1964;144:872–874. doi: 10.1126/science.144.3620.872. [DOI] [PubMed] [Google Scholar]
- Li H, DeRosier DJ, Nicholson WV, Nogales E, Downing KH. Microtubule structure at 8 A resolution. Structure. 2002;10:1317–1328. doi: 10.1016/s0969-2126(02)00827-4. [DOI] [PubMed] [Google Scholar]
- Lowe J, Li H, Downing KH, Nogales E. Refined structure of alpha beta-tubulin at 3.5 A resolution. J Mol Biol. 2001;313:1045–1057. doi: 10.1006/jmbi.2001.5077. [DOI] [PubMed] [Google Scholar]
- Mandelkow EM, Schultheiss R, Rapp R, Muller M, Mandelkow E. On the surface lattice of microtubules: helix starts, protofilament number, seam, and handedness. J Cell Biol. 1986;102:1067–1073. doi: 10.1083/jcb.102.3.1067. [DOI] [PMC free article] [PubMed] [Google Scholar]
- McEwen B, Edelstein SJ. Evidence for a mixed lattice in microtubules reassembled in vitro. J Mol Biol. 1980;139:123–145. doi: 10.1016/0022-2836(80)90300-9. [DOI] [PubMed] [Google Scholar]
- McIntosh JR, Porter KR. Microtubules in the spermatids of the domestic fowl. J Cell Biol. 1967;35:153–173. doi: 10.1083/jcb.35.1.153. [DOI] [PMC free article] [PubMed] [Google Scholar]
- Mickey B, Howard J. Rigidity of microtubules is increased by stabilizing agents. J Cell Biol. 1995;130:909–917. doi: 10.1083/jcb.130.4.909. [DOI] [PMC free article] [PubMed] [Google Scholar]
- Mitra A, Sept D. Taxol allosterically alters the dynamics of the tubulin dimer and increases the flexibility of microtubules. Biophys J. 2008;95:3252–3258. doi: 10.1529/biophysj.108.133884. [DOI] [PMC free article] [PubMed] [Google Scholar]
- Mizuno N, Toba S, Edamatsu M, Watai-Nishii J, Hirokawa N, Toyoshima YY, Kikkawa M. Dynein and kinesin share an overlapping microtubule-binding site. EMBO J. 2004;23:2459–2467. doi: 10.1038/sj.emboj.7600240. [DOI] [PMC free article] [PubMed] [Google Scholar]
- Nogales E, Whittaker M, Milligan RA, Downing KH. High-resolution model of the microtubule. Cell. 1999;96:79–88. doi: 10.1016/s0092-8674(00)80961-7. [DOI] [PubMed] [Google Scholar]
- Nogales E, Wolf SG, Downing KH. Structure of the alpha beta tubulin dimer by electron crystallography. Nature. 1998;391:199–203. doi: 10.1038/34465. [DOI] [PubMed] [Google Scholar]
- Pampaloni F, Florin EL. Microtubule architecture: inspiration for novel carbon nanotube-based biomimetic materials. Trends Biotech. 2008;26:302–310. doi: 10.1016/j.tibtech.2008.03.002. [DOI] [PubMed] [Google Scholar]
- Pettersen EF, Goddard TD, Huang CC, Couch GS, Greenblatt DM, Meng EC, Ferrin TE. UCSF Chimera--a visualization system for exploratory research and analysis. J Comput Chem. 2004;25:1605–1612. doi: 10.1002/jcc.20084. [DOI] [PubMed] [Google Scholar]
- Poole CA, Flint MH, Beaumont BW. Analysis of the morphology and function of primary cilia in connective tissues: a cellular cybernetic probe? Cell Motil. 1985;5:175–193. doi: 10.1002/cm.970050302. [DOI] [PubMed] [Google Scholar]
- Ravelli RB, Gigant B, Curmi PA, Jourdain I, Lachkar S, Sobel A, Knossow M. Insight into tubulin regulation from a complex with colchicine and a stathmin-like domain. Nature. 2004;428:198–202. doi: 10.1038/nature02393. [DOI] [PubMed] [Google Scholar]
- Roth KE, Rieder CL, Bowser SS. Flexible-substratum technique for viewing cells from the side: some in vivo properties of primary (9+0) cilia in cultured kidney epithelia. J Cell Sci. 1988;89(Pt 4):457–466. doi: 10.1242/jcs.89.4.457. [DOI] [PubMed] [Google Scholar]
- Schaap IA, Carrasco C, de Pablo PJ, MacKintosh FC, Schmidt CF. Elastic response, buckling, and instability of microtubules under radial indentation. Biophys J. 2006;91:1521–1531. doi: 10.1529/biophysj.105.077826. [DOI] [PMC free article] [PubMed] [Google Scholar]
- Schwartz EA, Leonard ML, Bizios R, Bowser SS. Analysis and modeling of the primary cilium bending response to fluid shear. Am J Physiol. 1997;272:F132–138. doi: 10.1152/ajprenal.1997.272.1.F132. [DOI] [PubMed] [Google Scholar]
- Simon JR, Salmon ED. The structure of microtubule ends during the elongation and shortening phases of dynamic instability examined by negative-stain electron microscopy. J Cell Sci. 1990;96:571–582. doi: 10.1242/jcs.96.4.571. [DOI] [PubMed] [Google Scholar]
- Sindelar CV, Downing KH. The beginning of kinesin's force-generating cycle visualized at 9-A resolution. J Cell Biol. 2007;177:377–385. doi: 10.1083/jcb.200612090. [DOI] [PMC free article] [PubMed] [Google Scholar]
- Sindelar CV, Downing KH. An atomic-level mechanism for activation of the kinesin molecular motors. Proc Natl Acad Sci USA. 2010;107:4111–4116. doi: 10.1073/pnas.0911208107. [DOI] [PMC free article] [PubMed] [Google Scholar]
- Sosa H, Hoenger A, Milligan RA. Three different approaches for calculating the three-dimensional structure of microtubules decorated with kinesin motor domains. J Struct Biol. 1997;118:149–158. doi: 10.1006/jsbi.1997.3851. [DOI] [PubMed] [Google Scholar]
- Sosa H, Milligan RA. Three-dimensional structure of ncd-decorated microtubules obtained by a back-projection method. J Mol Biol. 1996;260:743–755. doi: 10.1006/jmbi.1996.0434. [DOI] [PubMed] [Google Scholar]
- Sui H, Downing KH. Molecular architecture of axonemal microtubule doublets revealed by cryo-electron tomography. Nature. 2006;442:475–478. doi: 10.1038/nature04816. [DOI] [PubMed] [Google Scholar]
- Tilney LG, Bryan J, Bush DJ, Fujiwara K, Mooseker MS, Murphy DB, Snyder DH. Microtubules: evidence for 13 protofilaments. J Cell Biol. 1973;59:267–275. doi: 10.1083/jcb.59.2.267. [DOI] [PMC free article] [PubMed] [Google Scholar]
- Tuszynski JA, Luchko T, Portet S, Dixon JM. Anisotropic elastic properties of microtubules. Eur Phys J E Soft Matter. 2005;17:29–35. doi: 10.1140/epje/i2004-10102-5. [DOI] [PubMed] [Google Scholar]
- Typke D, Nordmeyer RA, Jones A, Lee J, Avila-Sakar A, Downing KH, Glaeser RM. High-throughput film-densitometry: an efficient approach to generate large data sets. J Struct Biol. 2005;149:17–29. doi: 10.1016/j.jsb.2004.09.003. [DOI] [PubMed] [Google Scholar]
- Venier P, Maggs AC, Carlier MF, Pantaloni D. Analysis of microtubule rigidity using hydrodynamic flow and thermal fluctuations. J Biol Chem. 1994;269:13353–13360. [PubMed] [Google Scholar]
- Wade RH, Chretien D. Cryoelectron microscopy of microtubules. J Struct Biol. 1993;110:1–27. doi: 10.1006/jsbi.1993.1001. [DOI] [PubMed] [Google Scholar]
- Wang HW, Nogales E. Nucleotide-dependent bending flexibility of tubulin regulates microtubule assembly. Nature. 2005;435:911–915. doi: 10.1038/nature03606. [DOI] [PMC free article] [PubMed] [Google Scholar]
- Wolf SG, Mosser G, Downing KH. Tubulin conformation in zinc-induced sheets and macrotubes. J Struct Biol. 1993;111:190–199. doi: 10.1006/jsbi.1993.1049. [DOI] [PubMed] [Google Scholar]
- Yonekura K, Toyoshima C. Structure determination of tubular crystals of membrane proteins. III. Solvent flattening. Ultramicroscopy. 2000;84:29–45. doi: 10.1016/s0304-3991(00)00008-5. [DOI] [PubMed] [Google Scholar]
Associated Data
This section collects any data citations, data availability statements, or supplementary materials included in this article.