

The liver, under normal conditions, presents only one mitosis per 1,000 hepatocytes, and the cells contain a fair amount of glycogen, lipids, and proteins.
Table 1 indicates the two types of factors controlling normal liver physiology. It is very difficult to define the exact role of each of these factors because they are very closely interrelated. The typical alterations induced by a portacaval shunt constitute the best demonstration of the existence of these two types of factors.1,2 In fact, in addition to the typical signs of atrophy in this model, the presence of regeneration with increases in the number of mitosis from 1.14 to 6 can be observed. The appearance of atrophy and ultrastructural deterioration demonstrates a lowering of factors controlling the size and morphology of the liver, and the latter indicates the appearance of regulating factors of regeneration.
Table 1. Factors Regulating Liver Size and Regeneration.
| Factors for Liver Throphism | Factors for Liver Regeneration |
|---|---|
| Hepatocyte content | Rapid activation of hepatocyte spontaneous renewal to maintain liver mass constant |
| Glycogen | |
| Lipids | |
| Vitamins | |
| Electrolytes | |
| Hepatocyte structures |
In a series of investigations during 1971 to 1977,3-5 we have established that insulin is the main factor that regulates the size, morphology, and structure of the liver. In fact, a nonhypoglycemic insulin infusion into the ligated left portal vein for four days after an Eck fistula greatly reduced the left lobular hepatocyte atrophy, preserved the hepatocyte ultrastructure, and increased the cell renewal (mitosis rose from six to 15 per 1,000 cells). This effect was not changed by the addition of glucagon, regardless of the dose. The finding that insulin increased the number of mitoses raised the question of the importance of hormones in the regeneration process.
After this study, several authors6-10 have described hormonal changes in both rats and dogs, ie, decreases in insulin, triiodothyronine, thyroxine, and calcitonin levels, whereas glucagon and corticosterone levels increase. Furthermore, we have recently reported that sexual hormones are involved in liver regeneration after 70% hepatectomy in rats.11-13 Estrogen levels increase in the serum with a corresponding increase in estrogen receptors, which correlates with the peak of the mitotic index. On the other hand, serum testosterone and androgen receptors display a very significant decrease.
On the basis of these hormonal changes, many speculations have been proposed to attempt to define the role of hormones in liver regeneration. Nevertheless, none of these hypotheses were conclusive for the following reasons: (1) it is possible to prevent the typical insulin-glucagon change after hepatectomy by glucose infusion without affecting liver regeneration in a major way; (2) insulin and glucagon in vitro do not affect hepatocyte proliferation; (3) triiodothyronine, thyroxine, calcitonin, and sex hormones in vitro do not show particular activity on hepatocyte proliferation; (4) the administration of all these hormones in animals after hepatectomy has never provided consistent data on liver regeneration; and finally (5) and even of further importance are the results we have obtained by transplanting small livers into much larger recipients. A rapid growth of small livers occurs during the first day after transplantation, which is similar to that observed after partial hepatectomy. None of the typical hormonal alterations observed after hepatectomy occurred during this process.
Because hormonal changes did not provide any conclusive answers as related to liver regeneration, in 1975 several investigations on growth factors in serum and tissue were initiated.
Table 2 illustrates the growth factors that have been partially isolated from serum14-19 and liver.19-32 As reported in Table 2, we have been working on the extraction and purification of hepatic stimulator substance (HSS) since 1980. HSS was first described by LaBrecque and Pesch20 in the cytosol of partially hepatectomized rats and subsequently identified in canine liver by Starzl et al.22
Table 2. Tissue and Serum Growth Factors.
| Investigator | Time Period | Name of Substance | Purification (fold) | Molecular Weight (kd) |
|---|---|---|---|---|
| Tissue factors | ||||
| Blomquist | 1957 | |||
| LaBrecque | 1975-1987 | HSS | 110,000 | 14-15 |
| Hatase | 1979 | 30 | ||
| Starzl | 1979 | |||
| Goldberg | 1980-1985 | Hepatopoietin | 13,000 | 38 |
| Terblanche | 1980 | |||
| Francavilla | 1981-1987 | HSS | 38,000 | 15-50 |
| Schwarz | 1985 | 14-25 | ||
| Weberman | 1984 | |||
| Fleig | 1986 | |||
| Serum factors | ||||
| Morley | 1973 | 400,000 | 26 | |
| Michalopoulos | 1984-1986 | HPTA | 120 | |
| HPTB | 3 | |||
| Russell | 1984 | 65 | ||
| Nakamura | 1984 | Hepatotrophin | 20,000 | 120 |
| Goldberg | 1980-1985 | Hepatopoietin | 13,000 | 38 |
| Diaz-Gil | 1986 | HP | 83,000 | 64 |
Abbreviations: HPTA, hepatopoietin A; HPTB, hepatopoietin B; HP, hepatic DNA-synthesis promoter.
Table 3 reports the steps in the purification and the physicochemical characteristics of the active chromatographic fraction, referred to as F150, that is obtained from weanling rat liver cytosol using fast protein liquid chromatography (FPLC) apparatus. This fraction stimulated DNA synthesis in hepatocytes in a dose-dependent regimen when injected in 40% hepatectomized rats (Fig 1). The activity of this fraction is organ specific but not species specific.33
Table 3. Steps in the Purification of HSS and Chemical and Physicochemical Properties of Fraction F150 Obtained From Weanling Rat Liver.
| Material | Protein Injected in Each Rat (mg/2 mL) | DNA Synthesis (cpm/mg DNA)* | Resistant to | Purification (fold) | ||
|---|---|---|---|---|---|---|
| Heat | Trypsin | Neuroaminidase | ||||
| Cytosol | 75 | 43,350 ± 8,820† | — | — | ||
| 65°C supernatant | 20 | 56,720 ± 10,240† | — | 6 | ||
| OH-F | 10 | 66,350 ± 11,350† | — | 15 | ||
| 30 Kd | 2.75 | 63,520 ± 13,220† | — | 102 | ||
| F150 | 0.003 | 54,380 ± 10,200 | 100% | 30% | 100% | 38,100 |
[3H]thymidine incorporation in a 40% hepatectomized rat injected with phosphate-buffered saline was 16,500 cpm/mg DNA. The numbers are the averages from no less than 20 different rats ± SD.
Significantly different from controls, P < .05.
Fig 1.

Dose response curve in 40% hepatectomized rats injected with F150. F150 was injected intraperitoneally six hours after operation. [3H]Thymidine incorporation, percentage of labeled nuclei and percentage of mitosis were determined 24 hours after operation.*P < .05.
Similar to the findings with hormones, the considerable knowledge obtained on growth factors has not yet resulted in any conclusive theory on liver regeneration. A better understanding of this process is clinically very important, not only for cases of liver damage but also for hepatic transplantation.
It has been observed that in clinical liver transplantation a liver from a small donor, occasionally transplanted into a much larger recipient, rapidly increases in size and achieves a size comparable to that of a normal liver for that particular recipient in a period of 2 weeks. These phenomena have been extensively studied in dogs in which small-for-size livers were transplanted into larger recipients.34
In Fig 2, the increase in the volume of a small liver transplanted in a larger animal is compared with that of a normal-for-size liver transplanted into a dog of suitable size.
Fig 2.
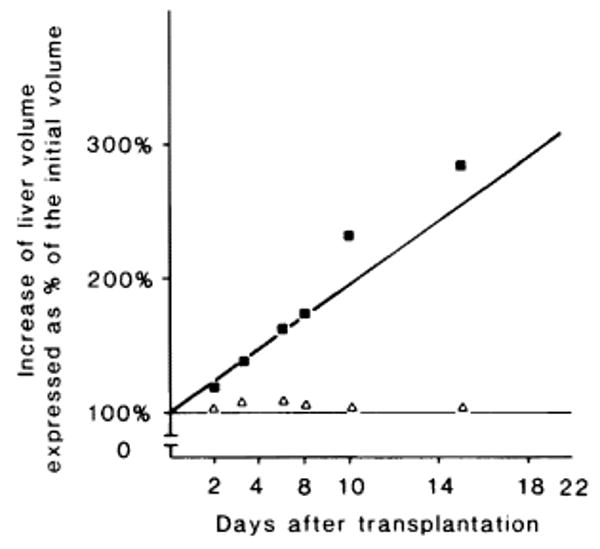
Change in liver volume after transplantation. The growth of a small-for-size liver transplanted in a large recipient (■) and the growth of a normal liver transplanted in a recipient of similar size (Δ) are expressed as a percentage of the initial volume.
A great increase in thymidine kinase, ornithine, and decarboxylase levels and in the percentage of mitoses was detected only in the small liver transplanted in a host of a larger size. This indicates an active hepatocyte proliferation. Figure 3 compares the insulin glucagon changes observed in both models. Despite a different rate of hepatocyte proliferation, the hormonal changes observed were similar but at the same time different from the levels observed in a regenerating liver induced by partial hepatectomy.3
Fig 3.

Plasma insulin and plasma glucagon levels in the two groups of animals: ●, small-for-size liver transplanted in large recipient; o, normal liver transplanted in a recipient of similar size.
In this experiment, the lack of specific hormonal changes suggests that the role of hormones in liver regeneration has to be reevaluated, and it raises the question of the existence of inhibitors as additional factors of liver growth regulation. A small liver, when transplanted into a large animal, might be unable to produce enough inhibitor substance to keep a normal plasma concentration. Therefore, regeneration could be seen as a complex mechanism in which the initiating key is the plasma concentration of inhibitors. This possibility even further complicates the already complex view of the regeneration process. In fact, we know only a few pieces of the puzzle that are responsible for the complex system of regeneration, and even more discouraging, we do not fully understand how all these pieces fit together.
Acknowledgments
Supported by research grants from the Veterans Administration; Project Grant No. AM-29961 from the National Institutes of Health, Bethesda, MD; and by Grant No. 885/02 16544 from the Consiglio Nazionale delle Ricerche, Italy.
References
- 1.Fisher ER, Fisher B. Lab Invest. 1963;12:929. [PubMed] [Google Scholar]
- 2.Putnam CW, Porter KA, Starzl TE. Ann Surg. 1976;184:155. doi: 10.1097/00000658-197608000-00003. [DOI] [PMC free article] [PubMed] [Google Scholar]
- 3.Starzl TE, Porter KA, Putnam CW. Lancet. 1975;2:1241. doi: 10.1016/s0140-6736(75)92076-0. [DOI] [PubMed] [Google Scholar]
- 4.Starzl TE, Porter KA, Watanabe R, et al. Lancet. 1976;1:821. doi: 10.1016/s0140-6736(76)90477-3. [DOI] [PubMed] [Google Scholar]
- 5.Starzl TE, Francavilla A, Halgrimson CG, et al. Surg Gynecol Obstet. 1973;137:179. [PMC free article] [PubMed] [Google Scholar]
- 6.Bucher NLR, Patel U, Cohen S. Porter R, Whelan J. CIBA Foundation Symposium No 55. Amsterdam: Elsevier; 1978. Hepatotrophic Factors; p. 95. [Google Scholar]
- 7.Bucher NLR, Swaffield MN. Proc Natl Acad Sci USA. 1975;72:1157. doi: 10.1073/pnas.72.3.1157. [DOI] [PMC free article] [PubMed] [Google Scholar]
- 8.Leffert HL, Koch KS, Moran T, et al. Gastroenterology. 1979;78:1470. [PubMed] [Google Scholar]
- 9.Starzl TE, Porter KA, Francavilla JA, et al. Porter R, Whelan J. CIBA Foundation Symposium No 55. Amsterdam: Elsevier; 1978. Hepatotrophic Factors; p. 111. [DOI] [PubMed] [Google Scholar]
- 10.Francavilla A, Porter KA, Benichou J, et al. J Surg Res. 1978;25:409. doi: 10.1016/s0022-4804(78)80005-5. [DOI] [PMC free article] [PubMed] [Google Scholar]
- 11.Francavilla A, DiLeo A, Eagon PK, et al. Gastroenterology. 1984;86:552. [PMC free article] [PubMed] [Google Scholar]
- 12.Francavilla A, Eagon PK, DiLeo A, et al. Gastroenterology. 1986;91:182. doi: 10.1016/0016-5085(86)90456-7. [DOI] [PMC free article] [PubMed] [Google Scholar]
- 13.Francavilla A, Eagon PK, DiLeo A, et al. Gastroenterology. 1986;91:1263. doi: 10.1016/s0016-5085(86)80026-9. [DOI] [PMC free article] [PubMed] [Google Scholar]
- 14.Morley CGD, Kingdon HS. Biochim Biophys Acta. 1973;308:260. doi: 10.1016/0005-2787(73)90156-1. [DOI] [PubMed] [Google Scholar]
- 15.Michalopoulos G, Houck KA, Dolan ML, et al. Cancer Res. 1984;44:4414. [PubMed] [Google Scholar]
- 16.Nakamura T, Nowa K, Ichihara A. Biochem Biophys Res Commun. 1984;122:1450. doi: 10.1016/0006-291x(84)91253-1. [DOI] [PubMed] [Google Scholar]
- 17.Russell WE, McGowan JA, Bucher NRL. J Cell Physiol. 1984;119:183. doi: 10.1002/jcp.1041190207. [DOI] [PubMed] [Google Scholar]
- 18.Nakamura N, Teramoto H, Ichihara A. Proc Natl Acad Sci USA. 1986;83:6489. doi: 10.1073/pnas.83.17.6489. [DOI] [PMC free article] [PubMed] [Google Scholar]
- 19.Diaz-Gil JJ, Escartin P, Garcia-Canero R, et al. Biochem J. 1986;235:49. doi: 10.1042/bj2350049. [DOI] [PMC free article] [PubMed] [Google Scholar]
- 20.LaBrecque DR, Pesch LA. J Physiol. 1975;248:273. doi: 10.1113/jphysiol.1975.sp010973. [DOI] [PMC free article] [PubMed] [Google Scholar]
- 21.Hatase O, Fujii T, Kuramitsu M, et al. Acta Med Okayama. 1979;33:73. [PubMed] [Google Scholar]
- 22.Starzl TE, Terblanche J, Porter KA, et al. Lancet. 1979;1:127. doi: 10.1016/s0140-6736(79)90519-1. [DOI] [PMC free article] [PubMed] [Google Scholar]
- 23.Terblanche J, Porter KA, Starzl TE, et al. Surg Gynecol Obstet. 1980;151:538. [PMC free article] [PubMed] [Google Scholar]
- 24.LaBrecque DR, Bachur NR. Am J Physiol. 1982;242:281. doi: 10.1152/ajpgi.1982.242.3.G281. [DOI] [PubMed] [Google Scholar]
- 25.LaBrecque DR, Steele G, Fogerty S. Fed Proc. 1983;42:438. [Google Scholar]
- 26.LaBrecque DR, Wilson M, Fogerty S. Exp Cell Res. 1984;150:419. doi: 10.1016/0014-4827(84)90585-8. [DOI] [PubMed] [Google Scholar]
- 27.Francavilla A, Ove P, Van Thiel DH, et al. Horm Metab Res. 1984;16:237. doi: 10.1055/s-2007-1014755. [DOI] [PMC free article] [PubMed] [Google Scholar]
- 28.Francavilla A, Ove P, Polimeno L, et al. Hepatology. 1985;5:922. [Google Scholar]
- 29.Fleig WE, Lehmann H, Wagner H, et al. Hepatology. 1986;3:19. doi: 10.1016/s0168-8278(86)80141-6. [DOI] [PubMed] [Google Scholar]
- 30.Schwarz LC, Makowka L, Falk JA, et al. Ann Surg. 1985;202:296. doi: 10.1097/00000658-198509000-00004. [DOI] [PMC free article] [PubMed] [Google Scholar]
- 31.LaBrecque DR, Wilson M, Rinderknecht C, et al. Hepatology. 1986;6:505. [Google Scholar]
- 32.LaBrecque DR, Steele G, Fogerty S, et al. Hepatology. 1987;7:100. doi: 10.1002/hep.1840070121. [DOI] [PubMed] [Google Scholar]
- 33.Francavilla A, Ove P, Polimeno L, et al. Cancer Res. 1987;47:5600. [PMC free article] [PubMed] [Google Scholar]
- 34.Kam G, Lynch S, Svanas G, et al. Hepatology. 1983;7:362. doi: 10.1002/hep.1840070225. [DOI] [PMC free article] [PubMed] [Google Scholar]