Abstract
Rationale and Objectives
To examine the effects of the number of categories in the rating scale used in an observer experiment on the results of ROC analysis by a simulation study.
Materials and Methods
We have previously evaluated the effects of computer-aided diagnosis (CAD) on radiologists’ characterization of malignant and benign breast masses in serial mammograms. The evaluation of the likelihood of malignancy was performed on a quasi-continuous (0-100 points) confidence-rating scale. In this study, we simulated the use of discrete confidence-rating scales with fewer number of categories and analyzed the results with receiver operating characteristic (ROC) methodology. The observers’ estimates of the likelihood of malignancy were also mapped to BI-RADS assessments with 5 and 7 categories and ROC analysis was performed. The area under the ROC curve and the partial area index obtained from ROC analysis of the different confidence-rating scales were compared.
Results
The fitted ROC curves and the performance indices do not change significantly when the confidence-rating scales were varied from 6 to 101 points if the estimated operating points obtained directly from the data are distributed relatively evenly over the entire range of true-positive fraction (TPF) and false-positive fraction (FPF). The mapping of the likelihood of malignancy observer data to the 7-category BI-RADS assessment scale allowed reliable ROC analysis, whereas mapping to the 5-category BI-RADS scale could cause erratic ROC curve fitting because of the lack of operating points in the mid-range or failure in ROC curve fitting because of data degeneration for some observers.
Conclusion
ROC analysis of discrete confidence rating scales with few but relatively evenly distributed data points over the entire FPF and TPF range is comparable to that of a quasi-continuous rating scale. However, ROC analysis of discrete confidence rating scales with few and unevenly distributed data points may cause unreliable estimations.
Keywords: Computer-Aided Diagnosis, Continuous and Discrete Confidence Rating Scales, ROC Observer Study, Classification, Mammography
INTRODUCTION
The effect of using quasi-continuous or discrete confidence rating scales on the results of receiver operating characteristic (ROC) observer study has been studied by a number of researchers. Rockette et al (1) carried out an observer experiment using both 5-point discrete scale and a quasi-continuous 100-point scale. The results of ROC analysis showed no statistically significant difference between the performance index Az achieved with the two scales. However, they suggested that the use of quasi-continuous scale can be more reliable for ROC analysis because it can avoid the problem of “degenerate” data sets.
King et al(2) performed an observer study to estimate the likelihood of the presence of abnormality on chest images using a quasi-continuous scale. Then they mapped the quasi-continuous observer ratings to a 5-point rating scale using two different sets of criteria for determining the range of each category and used ROC methodology to analyze the results. They concluded that the diagnostic accuracy derived from the quasi-continuous rating data are insensitive to the particular way those data are mapped to discrete categories. They also suggested that the use of a quasi-continuous scale is better in observer studies because of the insensitivity of the mapping to discrete categories and the reduced likelihood of “degenerate” data.
Wagner et al(3) performed a Monte Carlo simulation study of multiple-reader, multiple-case ROC experiments to evaluate the data quantization effects. They concluded that the discretization to five categories can reduce the precision of ROC measurements, in comparison to that obtained from continuous scale.
Berbaum et al (4) suggested that quasi-continuous 101-point scale ratings fitted with a standard binormal model may sometimes yield inappropriate chance line crossings, reducing the statistical power to detect the differences between two experimental conditions. They concluded that the use of proper ROC models with the discrete confidence rating data may present better results, however, they stressed that this should be investigated further.
We have previously studied radiologists’ performance of characterizing malignant and benign masses in single-view serial mammograms with and without CAD (5, 6) using ROC methodology. The observers’ estimate of the likelihood of malignancy (LM) of the lesions was collected on a quasi-continuous 101-point confidence-rating scale. In this experiment the observers recorded their own ratings using a slide bar on a computer user interface. In another ROC observer study, we compared stereoscopic and monoscopic viewing of breast tissue specimen radiographs for characterization of malignant and benign lesions. The radiologists were asked to verbally provide an estimate of the LM for each lesion on a quasi-continuous 101-point confidence-rating scale while a research assistant help record the LM estimate on a slide bar.
In this study, we examined the effects of the number of categories in the rating scale used in an ROC experiment on the results of ROC analysis by a simulation study. The observer rating data collected from the CAD mass characterization experiment were used as examples. We simulated the use of discrete confidence-rating scales with a small number of categories and also performed the mapping of the LM estimates to simulated BI-RADS assessments. We compared the performance indices and statistical significance obtained with ROC analysis for the different confidence-rating scales. In addition we analyzed the distribution of the radiologists’ ratings for both observer experiments (CAD mass characterization and comparison of stereoscopic viewing to monoscopic viewing) in order to study the radiologists’ “internal” confidence ratings scale, which they use when evaluate the cases in the observer studies.
MATERIALS AND METHODS
Single-view temporal pairs observer experiment
In our previous observer study of radiologists’ performance for characterization of mammographic masses on serial mammograms with and without a CAD system (6), 253 temporal image pairs (138 malignant and 115 benign) containing masses on serial mammograms from 96 patients were used. All cases were biopsy-proven. The data collection protocol had been approved by our Institutional Review Board. Patient informed consent was waived for this retrospective study. The interval change of a mass on a corresponding temporal pair was analyzed by our CAD system. The CAD system achieved a test Az value of 0.87 for the data set. The radiologists assessed the masses on the temporal pairs and provided estimates of the LM and BI-RADS assessments. The LM estimates were provided on a quasi-continuous confidence-rating scale of 0 to 100 (0=negative, 1=high likelihood of benignity, 100=high likelihood of malignancy). The BI-RADS assessments were made on a scale 1 to 5 (1=Negative, 2=Benign, 3=Probably Benign, 4=Suspicious, 5=Highly Suggestive) (7).
The radiologists interpreted the images in two reading conditions. The first reading condition is referred to as the “independent” mode, in which the radiologist read the masses without computer aid. The second reading condition is referred to as the “sequential” mode (8), in which the radiologist initially read a temporal pair without computer aid, followed by reading the same pair with computer aid. The computer would first record the radiologist's rating without computer aid before displaying the computer rating of the mass. The radiologist's final rating occurred after taking into consideration the computer rating. For simplicity of presentation we will consider that there were a total of three modes from the above two reading conditions: independent mode, sequential mode without CAD, and sequential mode with CAD.
Eight Mammography Quality Standards Act (MQSA) radiologists and 2 breast-imaging fellows participated in the observer performance study. For simplicity, we refer them as 10 radiologists in the following discussions.
Mapping of quasi-continuous LM ratings to discrete confidence-rating scales
In the current study the radiologists’ quasi-continuous LM ratings from the three reading modes (independent mode, sequential mode without CAD, and sequential mode with CAD) were mapped to three discrete confidence-rating scales with reduced numbers of possible categories by uniformly binning the adjacent ratings into bins of equal width. The three discrete rating scales used were 1 to 5, 1 to 10, and 1 to 20. The mapping was performed by separating the category 0 (negative) in an additional category 0 for all of the three discrete rating scales.
ROC analysis of BI-RADS assessments
To study the curve fitting properties and performance of the ROC methodology for observer data with a limited number of categories, ROC analyses of the 5-point BI-RADS assessments for the ten observers and the three reading modes were also performed. The results were compared to the results from the quasi-continuous and discrete confidence-rating scales for LM.
Mapping of quasi-continuous LM ratings to BI-RADS assessment
We also performed a mapping from the LM estimates to simulated BI-RADS assessments. Three different methods were used to map the LM estimates, as listed in Table 1. The first one mapped the quasi-continuous LM ratings [0 to 100] to the simulated BI-RADS categories as follows: [0] to 1; [1, 2] to 3; [3, 70] to 4; and [71, 100] to 5. This mapping was defined by an experienced MQSA-radiologist in our institution to relate the LM ratings and BI-RADS assessments before the current scale of BI-RADS assessments with defined ranges of LM was published. This mapping will be referred to as BI-RADS(r5) in the following discussion. The second mapping of LM follows the definition of ACR breast imaging lexicon 2003 (9) for the relation between the LM and the 5-category assessments as follows: [0] to 1; [1, 2] to 3; [3, 94] to 4; and [95, 100] to 5. This mapping will be referred to as BI-RADS(5). The third mapping of LM also follows the definition of ACR breast imaging lexicon 2003 (9) for the relation between the LM and BI-RADS with the three additional subcategories for category 4: [0] to 1; [1, 2] to 3; [3, 34] to 4; [35, 65] to 5; [66, 94] to 6; and [95, 100] to 7. It will be referred to as BI-RADS(7).
Table 1.
Mapping of LM estimates (the quasi-continuous LM ratings (0 to 100)) to simulated BI-RADS assessments. The first mapping (BI-RADS(r5)) is based on the definition given by an experienced MQSA-radiologist in our institution The second mapping (BI-RADS(5)) follows the definition of ACR breast imaging lexicon 2003 for the relation between the LM and the 5-category assessments. The third mapping (BI- RADS(7)) also follows the definition of ACR breast imaging lexicon 2003 with the three additional subcategories for category 4.
| Mapping #1 | LM | 0 | [1,2] | [3,70] | [71,100] | |||
| BI-RADS(r5) | 1 | 2 | 3 | 4 | 5 | |||
| Mapping #2 | LM | 0 | [1,2] | [3,94] | [95,100] | |||
| BI-RADS(5) | 1 | 2 | 3 | 4 | 5 | |||
| Mapping #3 | LM | 0 | [1,2] | [3,34] | [35,65] | [66,94] | [95,100] | |
| BI-RADS(7) | 1 | 2 | 3 | 4 | 5 | 6 | 7 |
Stereomammography-observer experiment
The stereomammography observer experiment (10) was used as a second example to illustrate the confidence rating scale the radiologists actually use, which may be considered the radiologists’ “internal” rating scale. In this experiment, monoscopic and stereoscopic images were acquired for 158 breast tissue specimens. The data collection protocol had been approved by our Institutional Review Board. Patient informed consent was waived for this retrospective study. Two views were taken for each specimen. Forty percent of the specimens contained malignancy and the other contained benign or normal tissue. A sequential design was used for the observer reading. Initially the radiologist evaluated the biopsy specimen on a single image (mono mode) and provided an estimate of LM. The radiologist then read the specimen on a stereoscopic image pair (stereo mode). The observers were free to change their LM ratings after reading the stereoscopic images. The radiologists were asked to provide the LM estimates on a quasi-continuous confidence-rating scale of 0 to 100. The observers verbally reported their estimates to a research assistant, who then recorded the ratings with the help of a computer interface. This was a different way to collect observer data than the previous study. In this case the radiologist directly reported a numerical value without involving the uncertainty of marking the rating themselves on a slide bar. Five MQSA radiologists, who were a subgroup of the 8 MQSA-radiologists participating in the previous study, served as observers in this experiment.
Statistical Analysis
The radiologists’ classification accuracy based on the confidence-rating scales was analyzed by the Dorfman-Berbaum-Metz (DBM) multi-reader multi-case (MRMC) methodology (11). In DBM analysis the ROC curve was derived from latent binormal distributions fitted to the observer ratings by maximum likelihood estimation. The area under the ROC curve, Az, was provided by the DBM program. We also derived the partial area index, Az(0.9), (12) above a sensitivity threshold of 0.9 as an additional performance index. The statistical significance of the difference in Az between the different reading conditions was estimated by the DBM analysis and that for Az(0.9) by the Student's two-tailed paired t-test.
RESULTS
Mapping of quasi-continuous LM ratings to discrete confidence-rating scales
For the ten radiologists, the average Az in estimating the likelihood of malignancy for the 6, 11, 21 and 101-category confidence rating scales was 0.787, 0.786, 0.787, and 0.787, respectively (Table 2) for the independent reading mode without CAD. The observers’ Az improved to 0.847, 0.844, 0.844, and 0.843, respectively, with CAD. The improvement was statistically significant (p=0.008, 0.011, 0.008, and 0.005 respectively) for each of the confidence rating scales. The corresponding average Az results for the sequential mode without CAD are also presented in Table 2. The corresponding standard deviations for the observers’ average Az are presented in Table 3. For the three reading modes the standard deviations had a slightly increasing trend when the number of categories in the confidence rating scales decreased. However, the difference between the lowest and largest standard deviations was very small, only about one-tenth of the values of the standard deviation themselves. The corresponding average partial area index for the four confidence rating scales without CAD was 0.193, 0.203, 0.205, and 0.206, respectively (Table 4). With CAD the partial area index was improved to 0.388, 0.371, 0.371, and 0.366, respectively. The improvement was also statistically significant for all of the confidence rating scales (p=0.009, 0.006, 0.004, and 0.005, respectively, Student's paired t-test). The corresponding average partial area index results for the sequential mode without CAD are presented in Table 4. For each of the three reading modes the differences in the Az values between any two of the 6, 11, 21 and 101-category confidence rating scales were not statistically significant (p>0.5). Similar results were observed for Az(0.9).
Table 2.
Area under ROC (Az) estimated for the likelihood of malignancy based on the 6, 11, 21 and 101 category confidence rating scales for the three reading modes – independent (Ind), sequential without CAD (NoCAD Seq), and sequential with CAD (With CAD). The statistical significance (p-value) in the differences between pairs of the reading modes was estimated by the DBM method as shown in the last three columns.
| Scale | Ind | NoCAD-Seq | With CAD | DBM | ||
|---|---|---|---|---|---|---|
| A | B | C | A-C | B-C | A-B | |
| 6 | 0.787 | 0.810 | 0.847 | 0.0082 | 0.0036 | 0.1436 |
| 11 | 0.786 | 0.807 | 0.844 | 0.0106 | 0.0017 | 0.2200 |
| 21 | 0.787 | 0.808 | 0.844 | 0.0076 | 0.0014 | 0.2207 |
| 101 | 0.787 | 0.811 | 0.843 | 0.0051 | 0.0011 | 0.139 |
Table 3.
Standard deviation for the corresponding area under ROC (Az) from Table 2 estimated for the likelihood of malignancy based on the 6, 11, 21 and 101 category confidence rating scales for the three reading modes – independent (Ind), sequential without CAD (NoCAD Seq), and sequential with CAD (With CAD).
| Scale | Ind | NoCAD-Seq | With CAD |
|---|---|---|---|
| A | B | C | |
| 6 | 0.03096 | 0.02947 | 0.02714 |
| 11 | 0.02933 | 0.02781 | 0.02545 |
| 21 | 0.02849 | 0.02699 | 0.02471 |
| 101 | 0.02829 | 0.02668 | 0.02461 |
Table 4.
Partial area under ROC estimated for the likelihood of malignancy based on the 6, 11, 21 and 101 category confidence rating scales for the three reading modes – independent (Ind), sequential without CAD (NoCAD Seq), and sequential with CAD (With CAD). The statistical significance (p-value) in the differences between pairs of the reading modes was estimated by the paired t-test as shown in the last three columns.
| Scale | Ind | NoCAD-Seq | With CAD | paired t-test | ||
|---|---|---|---|---|---|---|
| A | B | C | A-C | B-C | A-B | |
| 6 | 0.193 | 0.248 | 0.388 | 0.0088 | 0.013 | 0.0843 |
| 11 | 0.203 | 0.247 | 0.371 | 0.0055 | 0.0044 | 0.0950 |
| 21 | 0.205 | 0.249 | 0.371 | 0.0036 | 0.0021 | 0.1097 |
| 101 | 0.206 | 0.255 | 0.366 | 0.0047 | 0.0012 | 0.1696 |
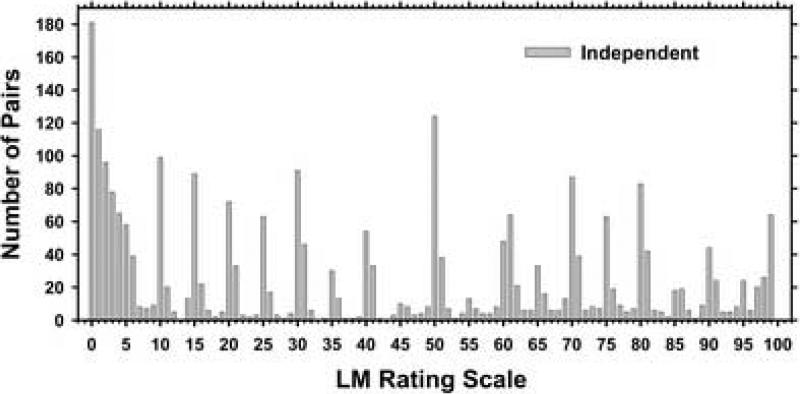
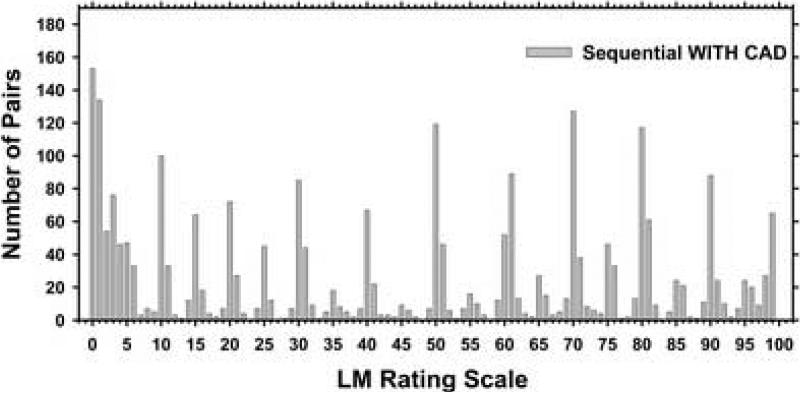
The distributions of the LM ratings for the 10 radiologists and the independent reading mode as well as the sequential reading mode with CAD are shown in Figures 1 and 2. Both histograms show distinctive peaks at the multiple of 10's and 5's with few counts in between. The distribution of the LM ratings for the 10 radiologists and the independent sequential reading mode without CAD (not shown in the manuscript) reveals similar pattern as the distributions shown in Figures 1 and 2. For all modes below 5% LM the radiologists used 1% increment more frequently, likely because the BI-RADS assessment sets the cutoff point between BI-RADS category 3 and 4 at an LM of 2%.
Figure 1.
Distribution of the original likelihood of malignancy ratings assessed on a quasi-continues confidence rating scale (0 to 100 points) by 10 radiologists in the independent reading mode.
Figure 2.
Distribution of the original likelihood of malignancy ratings assessed on a quasi-continues confidence rating scale (0 to 100 points) by 10 radiologists in the sequential reading mode with CAD.
ROC analysis of BI-RADS assessments
The MRMC analyses of the BI-RADS assessments for the 10 radiologists and for the three reading modes are summarized in Table 5 and Table 6. The average area under ROC curve Az, was 0.770, 0.820 and 0.851 for the independent mode, sequential mode without CAD, and sequential mode with CAD, respectively. The improvement for the sequential mode with CAD compared to independent mode was statistically significant (p=0.0432). The improvement for the sequential mode with CAD compared to sequential mode without CAD approached significance (p=0.0522).
Table 5.
Average area under ROC, Az, for the Independent mode, Sequential mode without CAD, and Sequential mode with CAD. The scales in terms of LM and BI-RADS are the original readings, LM-6 Categories is the linear binning from the 101-rating scale to 6 rating scale shown in Table 2, the mappings LM→BI-RADS(r5) and LM→BI- RADS(7) are described in Table 1. The average Az values for the mapping LM→BI- RADS(5) are not shown because the MRMC program failed to converge for two of the radiologist readings (Tables 6).
| Scale | Ind | NoCAD-Seq | With CAD | DBM | ||
|---|---|---|---|---|---|---|
| A | B | C | A-C | B-C | A-B | |
| LM | 0.787 | 0.811 | 0.843 | 0.0051 | 0.0011 | 0.1390 |
| BI-RADS | 0.770 | 0.820 | 0.851 | 0.0432 | 0.0522 | 0.1992 |
| LM-6 Categories | 0.787 | 0.810 | 0.847 | 0.0082 | 0.0036 | 0.1436 |
| LM→BI-RADS(r5) | 0.769 | 0.789 | 0.806 | 0.2303 | 0.0818 | 0.8718 |
| LM→BI-RADS(7) | 0.782 | 0.810 | 0.843 | 0.0094 | 0.0013 | 0.1346 |
Table 6.
Area under ROC (Az) for the Sequential mode with CAD. The mapping of the LM(101) scale to the other scales was described in Table 1. The mean Az was obtained by averaging the individual Az values. The average Az value derived from the average a and b parameters for the individual fitted ROC curves was also included for each condition.
| Radiologist | LM | BI-RADS | LM-6 Categories | LM→BI-RADS | ||
|---|---|---|---|---|---|---|
| (r5) | (5) | (7) | ||||
| 1 | 0.891 | 0.864 | 0.896 | 0.863 | 0.837 | 0.891 |
| 2 | 0.863 | 0.876 | 0.870 | 0.815 | 0.817 | 0.881 |
| 3 | 0.806 | 0.785 | 0.804 | 0.795 | 0.792 | 0.808 |
| 4 | 0.920 | 0.892 | 0.919 | 0.913 | 0.903 | 0.929 |
| 5 | 0.797 | 0.768 | 0.780 | 0.814 | 0.756 | 0.792 |
| 6 | 0.865 | 0.847 | 0.862 | 0.859 | * | 0.880 |
| 7 | 0.831 | 0.902 | 0.838 | 0.789 | * | 0.841 |
| 8 | 0.759 | 0.759 | 0.761 | 0.759 | 0.636 | 0.744 |
| 9 | 0.828 | 0.902 | 0.781 | 0.689 | 0.953 | 0.798 |
| 10 | 0.793 | 0.828 | 0.826 | 0.662 | 0.736 | 0.769 |
| mean | 0.835 | 0.842 | 0.834 | 0.796 | * | 0.833 |
| ave (a,b) | 0.843 | 0.851 | 0.847 | 0.806 | * | 0.843 |
indicates Az values that were not available due to failure of convergence of the MRMC program.
Mapping of quasi-continuous LM ratings to BI-RADS assessments
The average Az values resulting from the different reading modes for the two types of mapping from the LM to the BI-RADS assessment categories, BI-RADS(r5) and BI-RADS(7), are shown in Tables 5 and 6. The Az results for the individual radiologists obtained from the different rating scales in the sequential mode with CAD are shown in Table 6. The sequential mode with CAD was selected as an example to be discussed in more details because it is a typical representation of the mapping results for the 3 reading modes.
The MRMC analysis of the LM(101) mapping to the BI-RADS(r5) resulted in Az of 0.769, 0.789 and 0.806 for the independent mode, sequential mode without CAD, and sequential mode with CAD, respectively. With this simulated rating scale, there was no statistically significant improvement between any of the reading modes (p>0.05) (Table 5).
The MRMC analysis of the LM(101) mapping to the BI-RADS based on ACR breast imaging lexicon with 5 categories (BI-RADS(5)) was successful for only 8 of the radiologists (Table 6). MRMC did not converge for two of the radiologists due to “degenerate” data (13). For this reason, BI-RADS(5) was not included in Table 5. The difference in the Az values between the LM(101) and the simulated BI-RADS(5) for the 8 radiologists was the largest compared to the other mappings among the 3 reading modes.
The results for the additional mapping of LM to the BI-RADS categories based on the current ACR breast imaging lexicon with the three additional subcategories for category 4 (total of 7 categories, BI-RADS(7)) are shown in Tables 5 and 6. The average Az for the independent mode, sequential mode without CAD, and sequential mode with CAD were 0.782, 0.810 and 0.843, respectively (Table 5). The improvement between the independent mode and the sequential mode with CAD was statistically significant (p=0.0094). The improvement between the sequential mode without CAD and the sequential mode with CAD was also statistically significant (p=0.0013). The difference in the Az values between LM(101) and the simulated BI-RADS(7) for the 10 radiologists was the smallest among all mappings to BI-RADS categories.
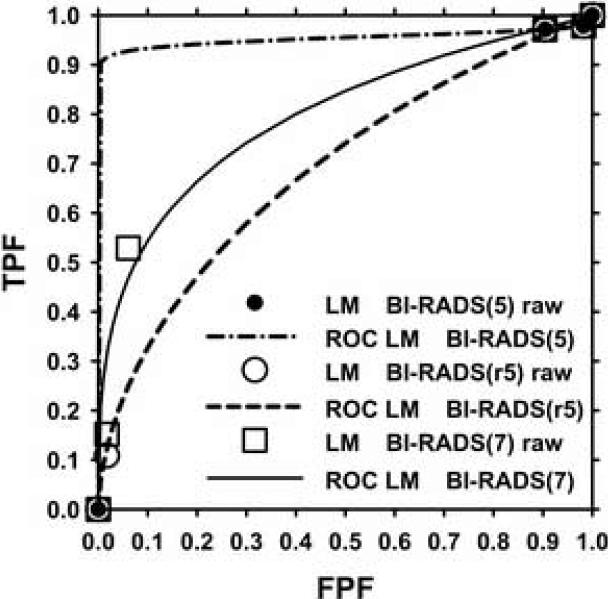
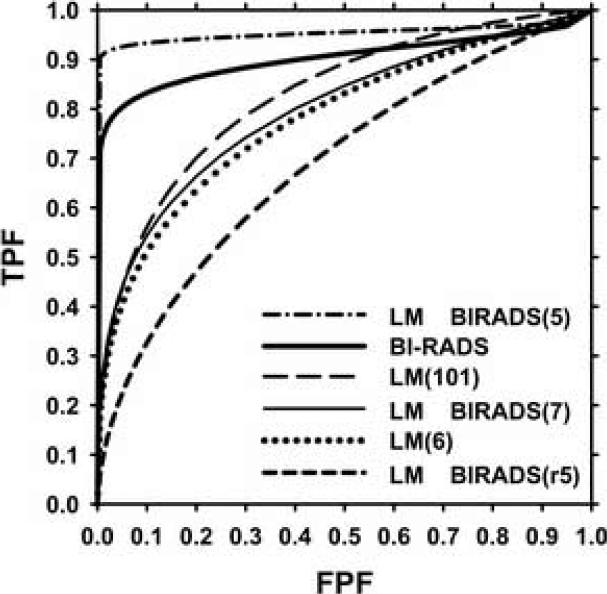
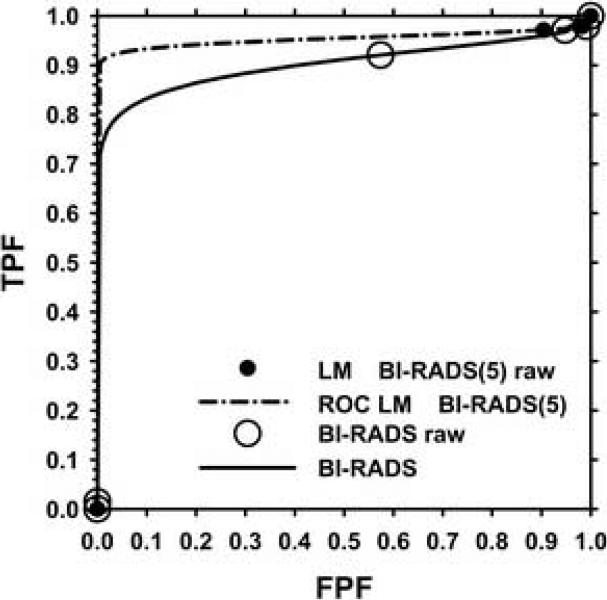
The Az results for some of the radiologists differed substantially among the different mappings. One such case is Radiologist 9 for the sequential mode with CAD (Table 6). The ROC curves for the simulated and true BI-RADS assessments for Radiologist 9 are shown in Figures 3–5. Figure 3 compared the ROC curves for the simulated assessments BI-RADS(5), BI-RADS(r5) and BI-RADS(7). There is a large difference between the corresponding curves for BI-RADS(5) and BI-RADS(r5) with Az values of 0.953 and 0.689, respectively. The data points used as input to the ROC curve fitting program are also shown. Data points are missing in the middle range of false-positive fraction (FPF) and true-positive fraction (TPF) for both curves. The difference in the fitted ROC curves is caused by an additional data point in the case of BI-RADS(r5) at low FPF and TPF values. For the BI-RADS(5) data points of Radiologist 9 there are no LM ratings mapped to category 5 due to the broad LM range (3%-94%) of category 4.
Figure 3.
Fitted ROC curves for the LM mapping to the BI-RADS(5) scale, the BI-RADS(r5) and the BI-RADS(7) scale with the corresponding raw data points for Radiologist 9 reading in sequential mode with CAD. The Az for BI-RADS(5), BI-RADS(r5) and BI-RADS(7) are 0.953, 0.689 and 0.798, respectively.
Figure 5.
Fitted ROC curves for the BI-RADS assessments, LM (101-point scale) mapping to LM (5-point scale), LM (101-point scale) mapping to the BI-RADS(5), BI-RADS(r5) and BI-RADS(7) for Radiologist 9 reading in sequential mode with CAD. The Az for BI-RADS(5), BI-RADS, LM(101), BI-RADS(7), LM(6) and BI-RADS(r5) are 0.953, 0.902, 0.828, 0.798, 0.781, and 0.689 respectively.
There is also a large difference between the BI-RADS(5) and the BI-RADS(7) ROC curves (Az values of 0.953 and 0.798, respectively) shown in Figure 3. Two additional data points are present in the middle range of FPF and TPF for BI-RADS(7) and the ROC curve fits well to these points. The additional data points strongly impacted the fitted ROC curve and made it very close to the curve fitted to the original LM(101) data (Az=0.828).
The ROC curves for the original BI-RADS assessments (Az=0.902) is plotted in Figure 4. A data point is present in the middle range of FPF and TPF and the ROC curve fits well to this point.
Figure 4.
Fitted ROC curves for the LM mapping to the BI-RADS(5) scale and the BI-RADS scale with the corresponding raw data points for Radiologist 9 reading in sequential mode with CAD. The Az for BI-RADS(5) is 0.953 and Az for BI-RADS is 0.902.
The ROC curves for all three simulated BI-RADS assessments, the simulated LM(6) (Az=0.781) and the original LM(101) (Az=0.828) and BI-RADS assessments (Az=0.902) for Radiologist 9 are compared in Figure 5. The ROC curve for the original BI-RADS assessment was different from all three simulated BI-RADS assessments. It was closest to the simulated BI-RADS(5). However, both curves were much higher than that for the simulated BI-RADS(7) (Az=0.798). The ROC curve for BI-RADS(7) was closest to that for LM(6) (Az=0.781) and that for LM(101).
Stereomammography-observer experiment
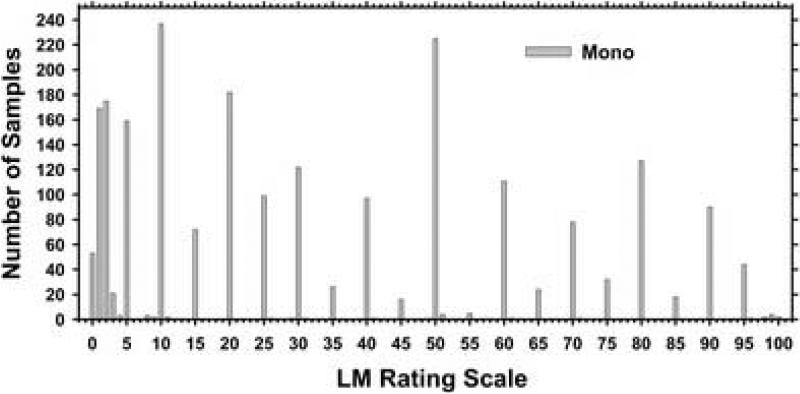
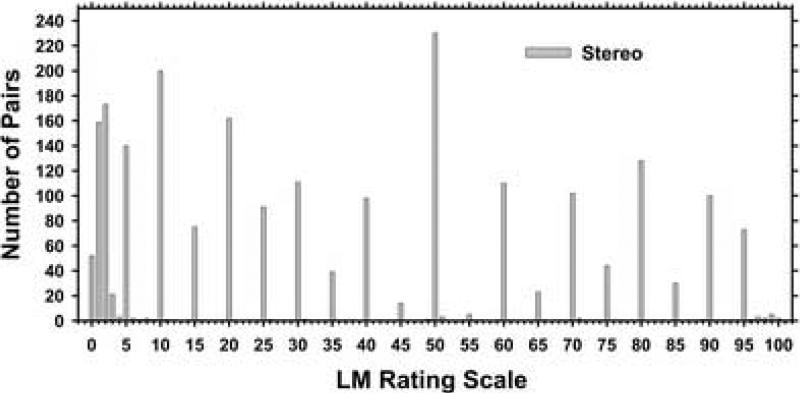
For the observer experiment comparing monoscopic and stereoscopic viewing of breast tissue specimens, the Az for the LM was 0.70 for the mono mode and 0.72 for the stereo mode and the difference was statistically significant (p=0.04). Detailed analysis of the results can be found in the literature (10). The distributions of the LM ratings for all 5 radiologists are shown in Figures 6 and 7 for the monoscopic and stereoscopic reading modes, respectively. For both modes below 5% the radiologists used a finer increment of 1% because the BI-RADS assessment sets a threshold of 2% LM between category 3 and 4. For the LM estimates above 5% there were very few ratings between the 5's and 10's. Another minor exception is at the high end of the scale near 100%. Few radiologists rated a lesion with LM of 100%; instead, an LM of 98% or 99% were used. The comparison of these histograms with those in the CAD experiment illustrates the radiologists’ internal rating scale in contrast to the apparent rating scale that involved uncertainties in recording the ratings with a slide bar.
Figure 6.
Distribution of the original likelihood of malignancy ratings assessed on a quasi-continuous confidence rating scale (0 to 100 points) by 5 radiologists in the monoscopic reading mode.
Figure 7.
Distribution of the original likelihood of malignancy ratings assessed on a quasi-continuous confidence rating scale (0 to 100 points) by 5 radiologists in the stereoscopic reading mode.
DISCUSSION
One important observation in our study was that in both observer experiments (temporal pair CAD experiment and stereomammography experiment) the radiologists were reporting their LM ratings mainly at the 5's and the 10's on the scale although the experiments were designed to allow quasi-continuous 0 to 100 ratings. In the case of the temporal pair observer experiment a non-negligible number of ratings between the 5's and 10's (Figures 1, 2) was observed. In this experiment the radiologists used a cursor to move a slider to mark the ratings on the slide bar themselves. For the stereomammography observer study the radiologists dictated the estimated LM ratings to an assistant who was trained to record exactly the ratings provided by the radiologists. In this case almost all the ratings were primarily at 10's and secondarily at 5's on the scale (Figures 6-7), except for those below 5% and above 95%. This comparison indicated that when the radiologists recorded data on a 101-point slide bar by themselves, the LM ratings recorded between the 10's or the 5's were likely caused by uncertainties in placing the slider rather than true LMs that the radiologists had in mind. The radiologists might not deem it important to make corrections if the slider's marking was within a few percent of what they intended. These “hand-jitters” are thus experimental artifacts rather than true variance in the observers’ decision. This analysis provides strong evidence that the quasi-continuous rating scale is practically only an 11- or 21-category scale because of the human observer's inability to make estimates within a few percentage points. This is consistent with their subjective opinion that they would not be able to make LM estimate better than about 10%.
The use of continuous and discrete confidence rating scales does not cause significant differences in the ROC analysis of the observer study for assessing temporal change of masses with and without CAD. More critical is the distribution of the data across the categories. If the categorical data are distributed relatively evenly over the TPF and FPF range, as in the case of mapping the likelihood of malignancy data collected on (0-100) scale to the uniform LM(6) scale, it would allow more reliable fitting of the ROC curve. This would result in a small difference between the two fitted ROC curves obtained from LM(101) and LM(6). However, if very few categories are used and the categorical data are distributed unevenly, the fitted ROC curves will differ substantially. This was the case for Radiologist 9, when the LM(101) was mapped to BI-RADS(r5) and BI-RADS(5) (Fig. 3). The data were mapped to both ends of the FPF and TPF ranges. The existence of an extra point in the case of BI-RADS(r5) changed drastically the fitted ROC curve compared to that for BI-RADS(5).
An issue specifically related to mammography is the relationship between the LM scale and the BI-RADS assessments. The LM ratings are not uniformly distributed over the BI-RADS scale. Three categories (1-3) are assigned to LM below 2% and a wide range of LM ratings is grouped into category 4. This can cause a large gap in the estimated operating points between the low FPF and TPF range and the high FPF and TPF range and a lack of support operating points in the middle range for some readers. The problem of missing ROC operating points for a large range of FPF and TPF was investigated in greater details in (4). The modified category 4 with three sub-categories has improved the distribution of points. The fitted ROC curve for BI-RADS(7) therefore was very close to those of LM(101) and LM(6).
We have demonstrated that the sensitivity of the results of ROC analysis to a change in the number of categories depends on the uniformity of the distribution of the experimental data. We observed that for a relatively large change in the rating scale (from 101 to 6 confidence categories) and uniform distribution there were only small changes in the average ROC results. However, with non-uniform distribution a decrease in the number of categories could have a strong effect on the fitted ROC curve and on the chance of non-convergence due to degeneracy. For each of the three observer experiment modes there were two cases of non-convergence and two sets of rating data having erratically fitted ROC curves (such as Radiologist 9). These difficulties in the ROC analysis may lead to misleading conclusions for observer experiments.
Based on the results of our study, using a scale of 11 or 21 categories could provide sufficient data points to allow reliable curve fitting for the ROC analysis. Analysis of the observers’ rating distributions in our ROC studies indicates that 11 and 21 categories may be closer to the radiologist “internal” confidence rating scales. These discrete rating scales may therefore be reasonable choices for observer experiments.
There are limitations in our study.
One limitation is that this manuscript addresses only parametric analyses of ROC data. However, lately there is a trend in statistics toward the use of non-parametric approaches for the analysis of ROC data. The effect of discrete versus quasi-continuous ratings may be even more significant in non-parametric analyses with few categories. This should be a topic of interest in future studies.
Another limitation is related to the fact that we obtained experimental data using the 101 confidence rating scale and simulated the discrete scales with smaller number of categories. It is not known if the observers will provide ratings in a way similar to the binning if a small number of categories is used directly for rating data collection in the ROC experiments. Nevertheless, our simulation studies comparing a large number of different rating scales demonstrate the variability in the ROC analysis that may occur if the observers do not make use of the full rating scale or if the categories are defined such that the observers cannot spread their rating data over all categories easily (for example the BI-RADS(5) scale).
A third limitation is that we used the DBM multi-reader multi-case program for ROC curve fitting in this study because it is likely the most commonly used software for ROC analysis at present. A more recent development of the maximum likelihood estimation for the proper ROC analysis (14, 15) may alleviate some of the problems caused by unevenly distributed operating points. It will be of interest to investigate if the discrete rating scales with different number of categories may influence the proper ROC analysis in future studies.
CONCLUSION
In this study we examined the effects of using quasi-continuous and discrete confidence-rating scales for ROC analysis based on data of two observer performance experiments pertaining to lesion assessment in mammography. The analysis showed that the radiologists tended to use 10- to 20-point rating scale when the estimated likelihood of malignancy was higher than 5%. In this study we observed some variations in the average performances using different (larger than 5) confidence-rating scales for estimation of the likelihood of malignancy. The differences are not statistically significant if the discrete rating scales provide relatively evenly distributed data points over the TPF and FPF range. The mapping of the likelihood of malignancy observer data to the ACR 7-category BI-RADS assessment scale also resulted in ROC curves close to those from the original 101-point scale, whereas mapping to the 5-category scale could cause erratic ROC curve fitting because of the lack of data points in the mid-range or failure in ROC curve fitting because of data degeneration for some observers.
ACKNOWLEDGEMENTS
This work is supported by U. S. Army Medical Research and Materiel Command (USAMRMC) grants DAMD 17-02-1-0489 and DAMD17-02-1-0214, and USPHS grant CA95153. The content of this publication does not necessarily reflect the position of the government and no official endorsement of any equipment and product of any companies mentioned in the publication should be inferred. The authors are grateful to Charles E. Metz, Ph.D., for the LABMRMC program.
Grant Supporting this Research:
This work was supported by USAMRMC grants DAMD17-02-1-0489, DAMD17-02-1-0214, and USPHS grant CA95153.
Footnotes
Publisher's Disclaimer: This is a PDF file of an unedited manuscript that has been accepted for publication. As a service to our customers we are providing this early version of the manuscript. The manuscript will undergo copyediting, typesetting, and review of the resulting proof before it is published in its final citable form. Please note that during the production process errors may be discovered which could affect the content, and all legal disclaimers that apply to the journal pertain.
REFERENCES
- 1.Rockette HE, Gur D, Metz CE. The use of continuous and discrete confidence judgements in receiver operating characteristic studies of diagnostic imaging techniques. Investigative Radiology. 1992;27:169–172. doi: 10.1097/00004424-199202000-00016. [DOI] [PubMed] [Google Scholar]
- 2.King JL, Britton CA, Gur D, Rockette HE, David PL. On the validity of the continuous and discrete confidence rating scales in receiver operating characteristic studies. Invest Radiol. 1993;28:962–963. doi: 10.1097/00004424-199310000-00019. [DOI] [PubMed] [Google Scholar]
- 3.Wagner RF, Beiden SV, Metz CE. Continuous versus categorical data for ROC analysis: some quantitative considerations. Academic radiology. 2001;8:328–334. doi: 10.1016/S1076-6332(03)80502-0. [DOI] [PubMed] [Google Scholar]
- 4.Berbaum KS, Dorfman DD, Franken EA, Caldwell RT. An empirical comparison of discrete ratings and subjective probability ratings. Academic Radiology. 2002;9:756–763. doi: 10.1016/s1076-6332(03)80344-6. [DOI] [PubMed] [Google Scholar]
- 5.Hadjiiski LM, Chan HP, Sahiner B, et al. ROC study: Effects of computer-aided diagnosis on radiologists’ characterization of malignant and benign breast masses in temporal pairs of mammograms. Proc. SPIE Medical Imaging. 2003;5032:94–101. [Google Scholar]
- 6.Hadjiiski LM, Chan HP, Sahiner B, et al. Improvement of Radiologists’ Characterization of Malignant and Benign Breast Masses in Serial Mammograms by Computer-Aided Diagnosis: An ROC Study. Radiology. 2004;233:255–265. doi: 10.1148/radiol.2331030432. [DOI] [PubMed] [Google Scholar]
- 7.American College of Radiology . Breast Imaging - Reporting and Data System (BI-RADS) American College of Radiology; Reston, VA: 1998. [Google Scholar]
- 8.Kobayashi T, Xu X- W, MacMahon H, Metz CE, Doi K. Effect of a Computer-aided Diagnosis Scheme on Radiologists’ Performance in Detection of Lung Nodules on Radiographs. Radiology. 1996;199:843–848. doi: 10.1148/radiology.199.3.8638015. [DOI] [PubMed] [Google Scholar]
- 9.American College of Radiology Breast Imaging Reporting and Data System Atlas (BI-RADS Atlas) American College of Radiology; Reston, VA: 2003. [Google Scholar]
- 10.Chan HP, Goodsitt MM, Helvie MA, et al. ROC study of the effect of stereoscopic imaging on assessment of breast lesions. Medical Physics. 2005;32:1001–1009. doi: 10.1118/1.1870172. [DOI] [PubMed] [Google Scholar]
- 11.Dorfman DD, Berbaum KS, Metz CE. ROC rating analysis: Generalization to the population of readers and cases with the jackknife method. Investigative Radiology. 1992;27:723–731. [PubMed] [Google Scholar]
- 12.Jiang Y, Metz CE, Nishikawa RM. A receiver operating characteristic partial area index for highly sensitive diagnostic tests. Radiology. 1996;201:745–750. doi: 10.1148/radiology.201.3.8939225. [DOI] [PubMed] [Google Scholar]
- 13.Metz CE. Some practical issues of experimental design and data analysis in radiological ROC studies. Investigative Radiology. 1989;24:234–245. doi: 10.1097/00004424-198903000-00012. [DOI] [PubMed] [Google Scholar]
- 14.Dorfman DD, Berbaum KS, Metz CE, Lenth RV, Hanley JA, Abu-Dagga H. Proper Receiver Operating Characteristic analysis: The bigamma model. Academic Radiology. 1997;4:138–149. doi: 10.1016/s1076-6332(97)80013-x. [DOI] [PubMed] [Google Scholar]
- 15.Metz CE, Pan X. “Proper” binormal ROC curves: Theory and maximum-likelihood estimation. Journal of Mathematical Psychology. 1999;43:1–33. doi: 10.1006/jmps.1998.1218. [DOI] [PubMed] [Google Scholar]


